Which are the richest countries in the world in 2026? Using the latest data from the IMF World Economic Outlook (April 2026), we’ve ranked nations by GDP per capita at Purchasing Power Parity (PPP) — the gold standard for comparing living standards across borders.
Key findings:
- 🇸🇬 Singapore leads the world at $173,708 GDP per capita (PPP), extending its lead over Luxembourg
- 🇮🇪 Ireland surges to second at $159,129, overtaking Luxembourg ($156,719)
- 🇬🇾 Guyana’s offshore-oil boom vaults it into the top 10 ($95,477) — the fastest-rising economy on the list
- The United States ranks 10th at $94,430, the highest among the world’s large economies
- The world average GDP per capita (PPP) is $27,655
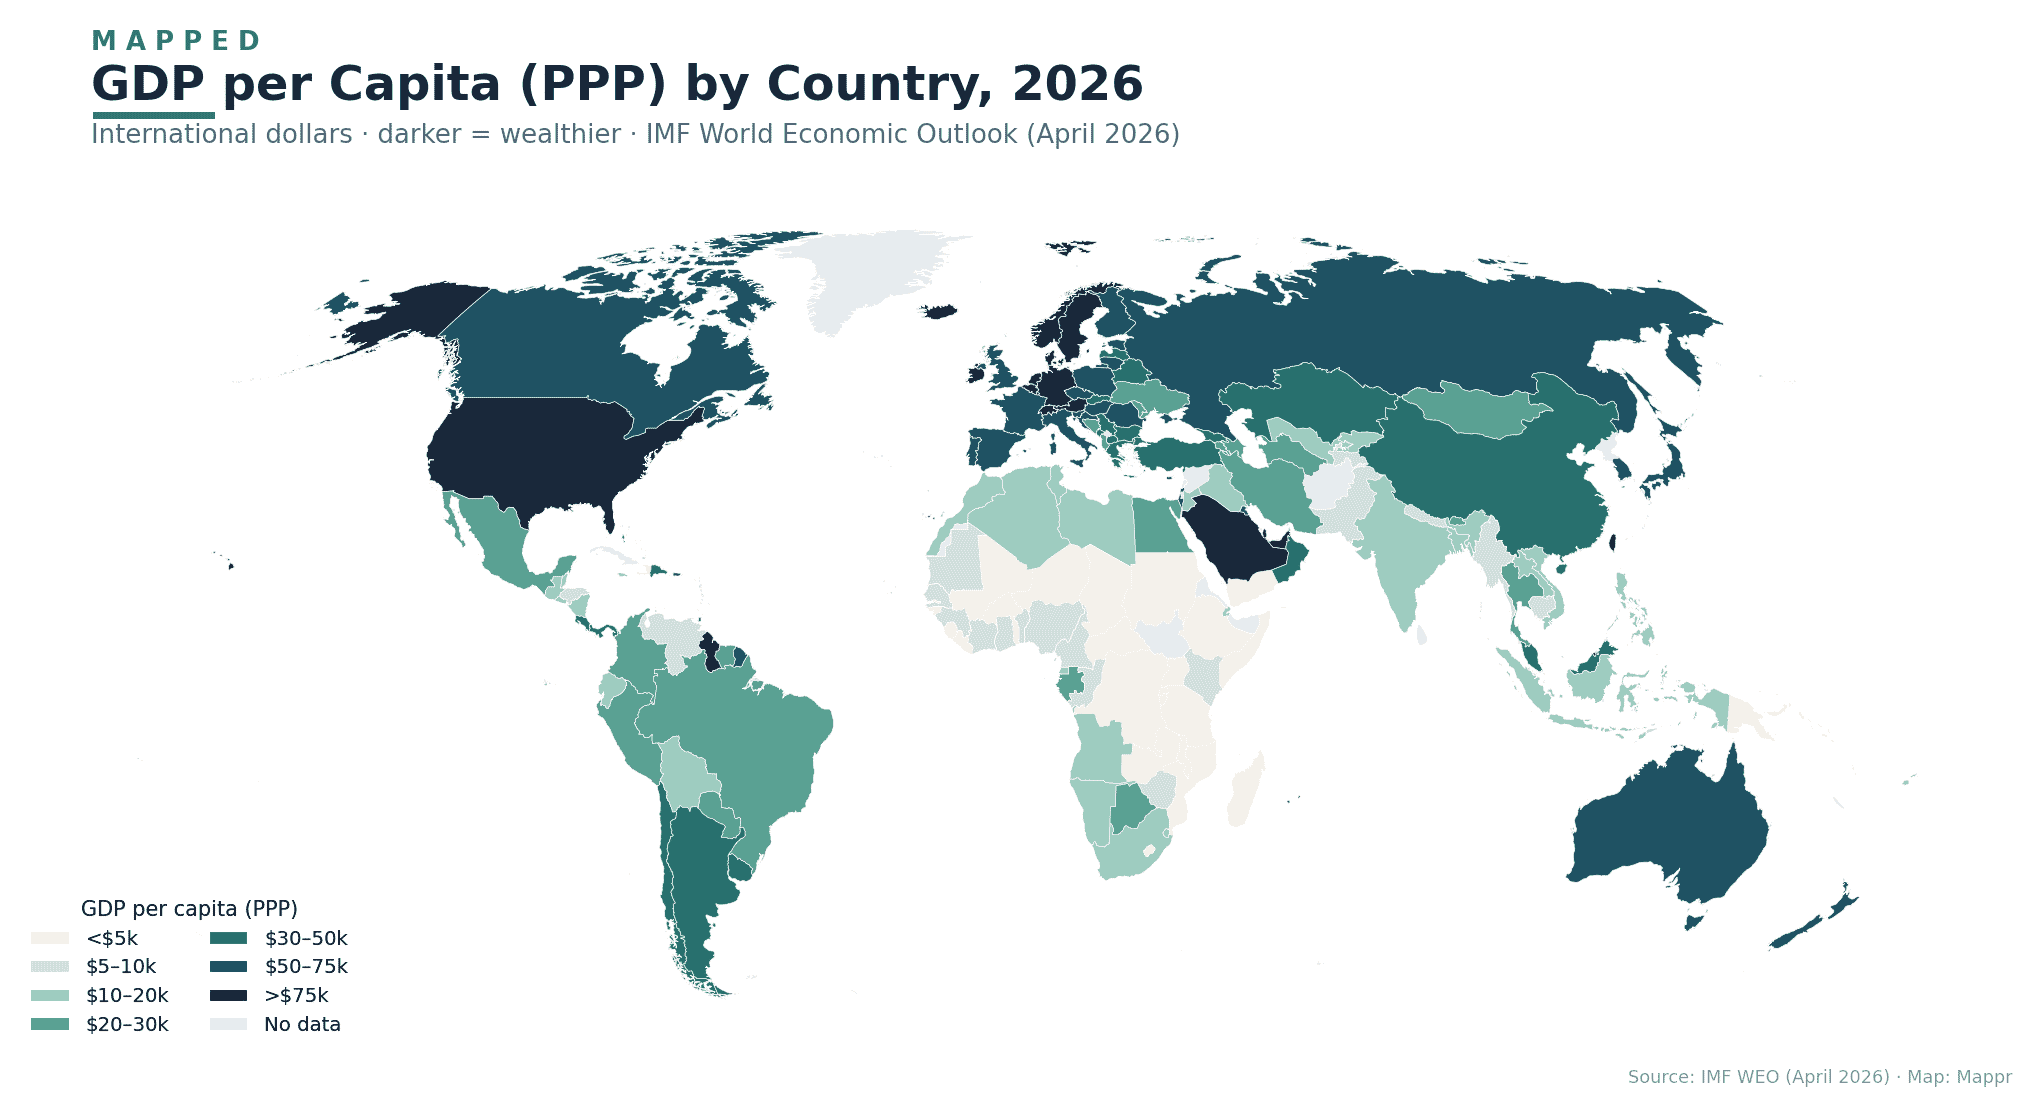
Map: GDP per Capita (PPP) by Country, 2026
Darker shades indicate higher GDP per capita (PPP).
Top 25 Richest Countries in the World (2026)
Below is the ranking of the 25 wealthiest sovereign nations by GDP per capita (PPP), based on IMF projections for 2026. We’ve excluded dependent territories and special administrative regions (Macao, Hong Kong, Bermuda, the Cayman Islands) and small tax-haven micro-states (Liechtenstein, Monaco, San Marino) to focus on sovereign nations with meaningful economic scale.
| Rank | Country | GDP per Capita (PPP) |
|---|---|---|
| 1 | 🇸🇬 Singapore | $173,708 |
| 2 | 🇮🇪 Ireland | $159,129 |
| 3 | 🇱🇺 Luxembourg | $156,719 |
| 4 | 🇳🇴 Norway | $115,548 |
| 5 | 🇶🇦 Qatar | $112,312 |
| 6 | 🇨🇭 Switzerland | $105,680 |
| 7 | 🇹🇼 Taiwan | $98,051 |
| 8 | 🇧🇳 Brunei | $97,858 |
| 9 | 🇬🇾 Guyana | $95,477 |
| 10 | 🇺🇸 United States | $94,430 |
| 11 | 🇩🇰 Denmark | $89,667 |
| 12 | 🇦🇪 United Arab Emirates | $87,774 |
| 13 | 🇳🇱 Netherlands | $87,773 |
| 14 | 🇮🇸 Iceland | $82,730 |
| 15 | 🇲🇹 Malta | $82,421 |
| 16 | 🇸🇦 Saudi Arabia | $78,815 |
| 17 | 🇧🇪 Belgium | $78,607 |
| 18 | 🇦🇹 Austria | $78,334 |
| 19 | 🇸🇪 Sweden | $77,094 |
| 20 | 🇩🇪 Germany | $76,747 |
| 21 | 🇦🇺 Australia | $74,755 |
| 22 | 🇧🇭 Bahrain | $70,165 |
| 23 | 🇨🇦 Canada | $70,006 |
| 24 | 🇫🇮 Finland | $68,861 |
| 25 | 🇰🇷 South Korea | $68,624 |
The Richest Countries — Ranked and Explained
1. 🇸🇬 Singapore — $173,708
Singapore holds the top spot in 2026, having overtaken Luxembourg in recent years. This city-state of just under 6 million people transformed itself from a colonial trading post into the world’s wealthiest nation per capita. Its success rests on its position as Asia’s premier financial hub, a business-friendly regulatory environment, and heavy investment in education and technology. Singapore’s port remains one of the busiest on earth, and its sovereign wealth fund (GIC) manages over $700 billion in assets.
2. 🇮🇪 Ireland — $159,129
Ireland’s remarkable economic story continues, and in 2026 it edges past Luxembourg into second place. Once one of Europe’s poorer nations, it now ranks among the richest thanks to its status as the European headquarters for tech giants like Apple, Google, and Meta, plus a thriving pharmaceutical export sector. Critics rightly note that Ireland’s GDP is inflated by multinational profit-shifting — its modified GNI (GNI*) implies a lower, though still high, standard of living.
3. 🇱🇺 Luxembourg — $156,719
Luxembourg has long been one of the world’s richest nations, and 2026 is no exception. This tiny European country punches far above its weight thanks to a dominant financial-services sector that manages trillions in investment-fund assets. As the seat of several EU institutions and home to global companies like ArcelorMittal, Luxembourg benefits from high-value industries and a highly skilled, multinational workforce that commutes in from neighbouring France, Belgium, and Germany.
4. 🇳🇴 Norway — $115,548
Norway sets the gold standard for resource-wealth management. Its Government Pension Fund Global — the world’s largest sovereign wealth fund at over $1.8 trillion — ensures that North Sea oil and gas revenues benefit current and future generations. Unlike many petrostates, Norway pairs natural-resource wealth with a robust welfare state, strong institutions, and a diversified economy spanning shipping, fisheries, and clean energy.
5. 🇶🇦 Qatar — $112,312
Qatar remains the richest country in the Middle East per capita, powered by the world’s third-largest natural-gas reserves and significant oil wealth. The small Gulf nation has channelled its hydrocarbon revenues into massive sovereign-fund investments (the Qatar Investment Authority manages over $500 billion) and major infrastructure. Post-2022 World Cup, it is focused on diversifying into tourism, sport, and financial services through its National Vision 2030.
6. 🇨🇭 Switzerland — $105,680
Switzerland’s wealth derives not from natural resources but from centuries of financial expertise, precision manufacturing, and political stability. Home to global pharma giants (Novartis, Roche), major banks (UBS), and premium brands (Nestlé, Rolex), Switzerland commands premium pricing across every industry it touches. Its GDP per capita reflects both exceptional productivity and a famously high cost of living.
7. 🇹🇼 Taiwan — $98,051
Taiwan makes the global top 10 in 2026, and it owes that ascent to one thing above all: semiconductors. As the home of TSMC — the company that manufactures the most advanced chips on the planet for Apple, Nvidia, and almost every other tech leader — Taiwan sits at the centre of the modern economy. A highly educated workforce, a dense manufacturing ecosystem, and world-leading export industries give the island of 23 million a per-capita income that now rivals Switzerland’s.
8. 🇧🇳 Brunei — $97,858
This small Southeast Asian sultanate on the island of Borneo derives its enormous wealth from oil and gas, which account for the bulk of GDP and roughly 90% of exports. With a population of just 450,000, that hydrocarbon wealth translates into very high per-capita income. Citizens enjoy free education, healthcare, and subsidised housing, while the government works to diversify through its Wawasan Brunei 2035 vision.
9. 🇬🇾 Guyana — $95,477
No country in the world is getting richer faster than Guyana. Since ExxonMobil struck oil offshore in 2015, this South American nation of 800,000 people has seen its economy multiply several times over, with double-digit GDP growth that vaults it into the global top 10 by 2026. The challenge now is to convert a sudden oil windfall into lasting prosperity — building infrastructure, schools, and institutions before the wells peak — while avoiding the “resource curse” that has trapped other petrostates.
10. 🇺🇸 United States — $94,430
The world’s largest economy by nominal GDP also ranks impressively per capita. The U.S. leads in technology, finance, healthcare, and higher education, with Silicon Valley alone producing more economic value than most countries. America’s combination of a huge domestic market, entrepreneurial culture, deep capital markets, and world-class universities continues to drive innovation and wealth creation — and it remains comfortably the richest of the world’s truly large economies.
11–25: The Rest of the Top 25
🇩🇰 Denmark ($89,667) — Home to Novo Nordisk (one of Europe’s most valuable companies), Maersk, and LEGO, Denmark pairs a strong welfare state with remarkable dynamism in pharma, shipping, and renewable energy.
🇦🇪 United Arab Emirates ($87,774) — The UAE has diversified well beyond oil, turning Dubai into a global tourism, logistics, and finance hub while Abu Dhabi holds vast sovereign-wealth reserves.
🇳🇱 Netherlands ($87,773) — Europe’s logistics gateway and home to multinationals like Shell and ASML — the world’s monopoly supplier of advanced chip-making machines.
🇮🇸 Iceland ($82,730) — A renewable-energy pioneer leveraging geothermal power, with booming fisheries and tourism sectors driving an $80K+ per-capita economy.
🇲🇹 Malta ($82,421) — The smallest EU member economy by size, Malta has built outsized wealth on financial services, online gaming, shipping registries, and Mediterranean tourism.
🇸🇦 Saudi Arabia ($78,815) — The world’s largest oil exporter is investing hundreds of billions through Vision 2030 to diversify into tourism, entertainment, and technology.
🇧🇪 Belgium ($78,607) — Home to the EU capital Brussels, Belgium’s central location and multilingual workforce make it a hub for international organisations and trade.
🇦🇹 Austria ($78,334) — Strong manufacturing, alpine tourism, and a strategic position linking Western and Eastern Europe.
🇸🇪 Sweden ($77,094) — A tech powerhouse (Spotify, Klarna, Ericsson) combined with strong industrial exports and a generous welfare system.
🇩🇪 Germany ($76,747) — Europe’s largest economy excels in automotive (BMW, Mercedes, VW), engineering, and industrial manufacturing.
🇦🇺 Australia ($74,755) — Rich in minerals and natural gas, Australia combines resource wealth with a strong services sector and high wages.
🇧🇭 Bahrain ($70,165) — The Gulf’s financial-services hub, Bahrain has diversified beyond oil into banking, insurance, and Islamic finance.
🇨🇦 Canada ($70,006) — Natural resources (oil sands, minerals, timber) combined with growing tech hubs in Toronto, Vancouver, and Montreal.
🇫🇮 Finland ($68,861) — Known for Nokia and now a thriving gaming industry (Supercell, Rovio), Finland blends tech innovation with forestry and manufacturing.
🇰🇷 South Korea ($68,624) — A manufacturing and tech giant (Samsung, Hyundai, SK Hynix) that rose from poverty to top-25 wealth in two generations.
Just Outside the Top 25
A few major economies sit just below the cut in 2026: 🇫🇷 France ($68,567), 🇨🇾 Cyprus ($67,796), 🇬🇧 United Kingdom ($67,585), and 🇮🇹 Italy ($65,761). The newcomers to the top 25 this year — Taiwan, Guyana, and Malta — edged them out as the chip boom, an oil windfall, and resilient services growth reshaped the league table.
Methodology
All GDP per capita figures are based on Purchasing Power Parity (PPP) in international dollars, as projected by the IMF World Economic Outlook (April 2026). PPP adjusts for differences in the cost of living between countries, making it a more meaningful measure of actual living standards than nominal GDP per capita.
Last updated: June 2026. Data reflects IMF WEO April 2026 projections for the year 2026.
This post uses data from the following sources.
Data Sources:
- IMF World Economic Outlook Database (April 2026) – International Monetary Fund
- IMF DataMapper – GDP per capita, PPP – International Monetary Fund
Also read: Richest Countries in Europe | Richest Countries in Asia | Richest Arab Countries


