The world spent $2.887 trillion on its militaries in 2025 — the eleventh consecutive year of real-terms increases, and the highest figure ever recorded by the Stockholm International Peace Research Institute (SIPRI). The headline rise of 2.9% looks modest, but it conceals a much sharper story: spending excluding the United States grew 9.2% in real terms. Europe added 14% in a single year, Asia-Oceania added 8.1%, and Ukraine’s wartime defence outlay swelled to 39.6% of GDP — an order of magnitude above any other country in the dataset. The map below shows the world by burden, not totals.
Key Takeaways
- $2.887 trillion spent globally in 2025. A real-terms increase of 2.9% versus 2024, and the eleventh consecutive year of rising global military spending.
- Spending excluding the US grew 9.2%. The US — still the world's largest absolute spender — actually pulled back slightly in 2025. Everyone else accelerated.
- Europe added 14%, the largest annual jump since the Cold War. European military spending reached $864 B in 2025; Poland is the most aggressive NATO rearmer.
- Ukraine's defence burden hit 39.6% of GDP. Up from 34.5% the year before — the share is rising as Ukraine's economy contracts and wartime spending grows.
- Global average burden is now 2.5% of GDP — highest since 2009. Eleven straight years of increases now look less like a cyclical bump and more like a regime change.
World Military Expenditure as % of GDP, 2025
The map shades each country by the share of its economy directed to military expenditure in 2025. Eleven countries cross the 4% line and are labelled directly on the map. The United States, despite remaining the world’s largest absolute spender by a wide margin, sits below 4% and is therefore not labelled — a reminder that absolute totals and burden tell different stories.
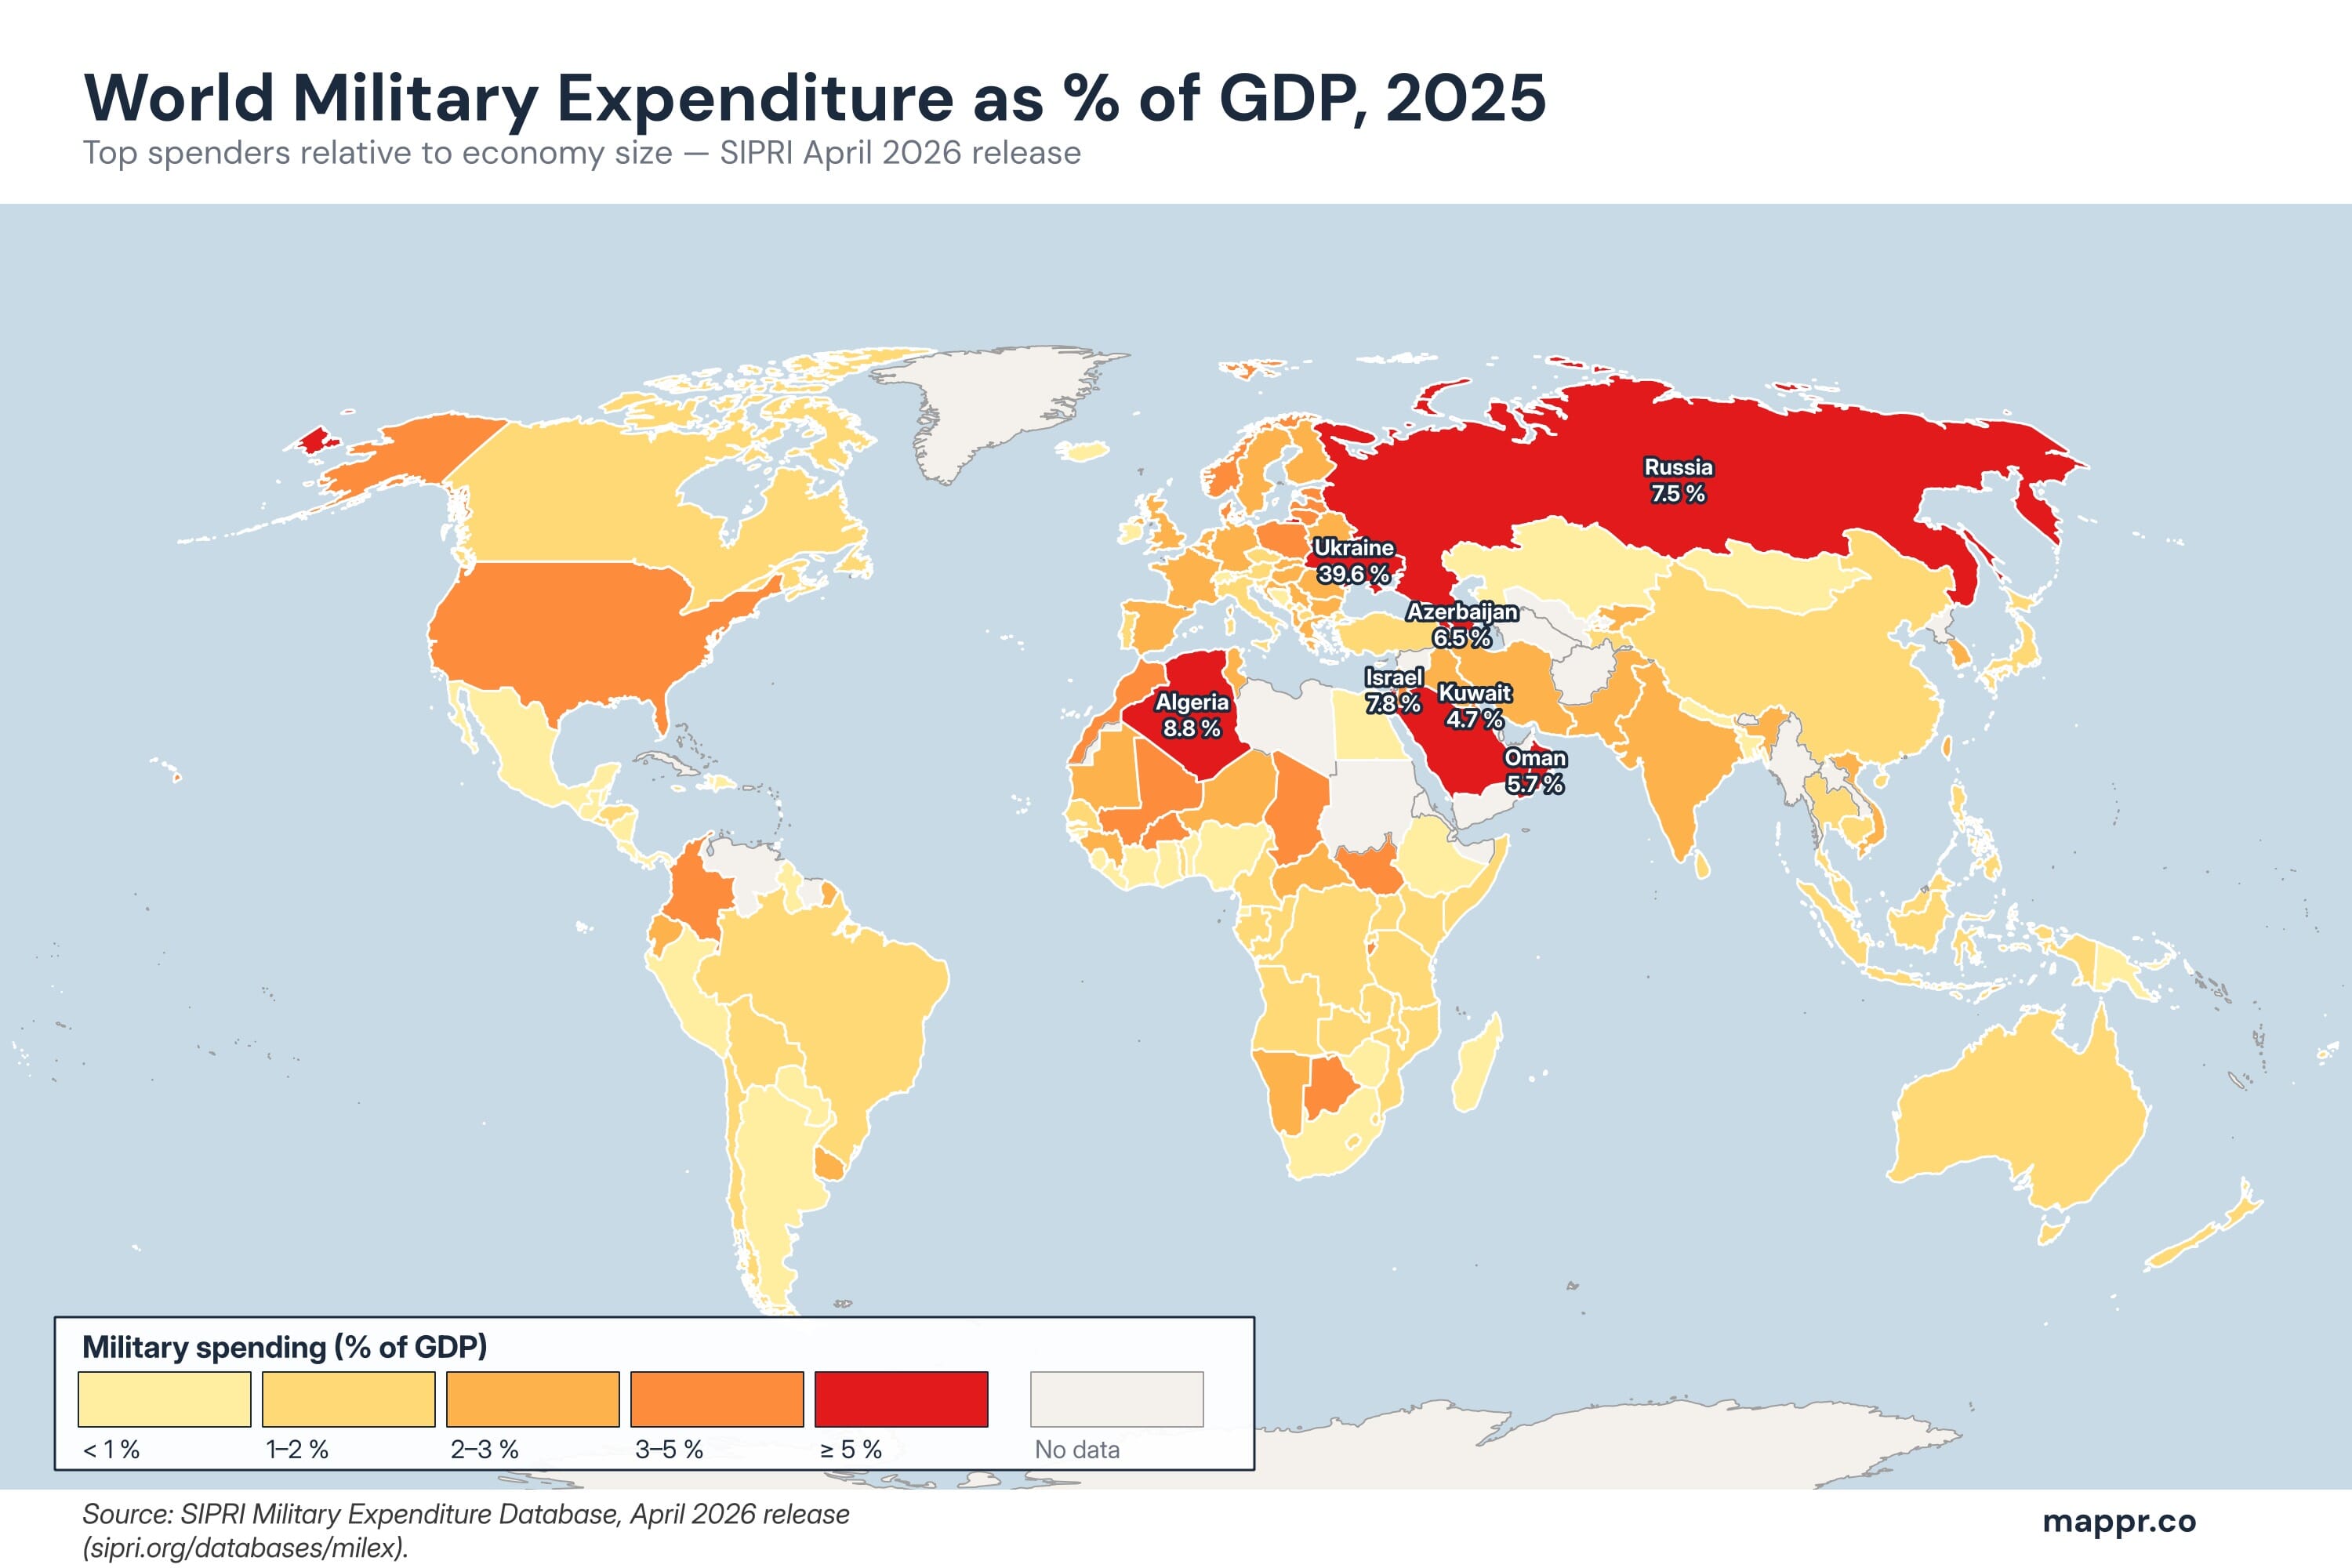
The Eleven Countries Above 4% of GDP
Every country labelled on the map is also a member of the global top eleven by military burden. The list mixes wartime emergencies, structural Gulf-state postures, and a single large NATO rearmer:
| Country | % of GDP | Driver |
|---|---|---|
| 🇺🇦 Ukraine | 39.6% | Ongoing war + economic contraction (numerator and denominator both moving) |
| 🇩🇿 Algeria | 8.8% | Highest in Africa — long-running structural posture |
| 🇮🇱 Israel | 7.8% | Sustained at the elevated post-October-2023 level |
| 🇷🇺 Russia | 7.5% | Highest sustained share since the Soviet era |
| 🇦🇿 Azerbaijan | 6.5% | Sustained South Caucasus posture |
| 🇴🇲 Oman | 5.7% | Gulf-state structural defence posture |
| 🇰🇼 Kuwait | 4.7% | Gulf-state structural defence posture |
| 🇸🇦 Saudi Arabia | > 4% | Largest Gulf spender in absolute terms; structural high burden |
| 🇦🇲 Armenia | > 4% | Sustained South Caucasus posture |
| 🇯🇴 Jordan | > 4% | Long-running regional posture |
| 🇵🇱 Poland | > 4% | Most aggressive NATO rearmer; record post-2022 spending |
The visual cluster groups them together, but the underlying causes diverge. Ukraine’s number is a wartime emergency amplified by a contracting economy. The Gulf states, Algeria and Israel run structural high-burden postures shaped by long-standing regional security calculations. Poland is the European headline story — a large NATO economy that has actively chosen to lift spending to historic highs in response to the war on its eastern border.
The Real Story: Spending Without the US
Press coverage of the SIPRI release tends to lead with the global total — “$2.887 trillion, eleventh straight year of increases” — and that number is real. But the more telling figure is what happens when you strip out the United States: +9.2% in real terms. The US, the single largest absolute spender, actually pulled back slightly in 2025 — the first major spender to do so. Everyone else is rearming.
🇪🇺 Europe: +14% in a single year
European military spending hit $864 billion in 2025 — the largest annual jump on the continent in the post-Cold-War era. Poland leads the charge, with record post-2022 spending and an explicit policy of building the largest army in Europe. Almost every European NATO member raised real-terms spending in 2025; the few exceptions are countries already well above the 2% NATO target.
🌏 Asia & Oceania: +8.1%
Asia-Oceania added 8.1% in real terms — driven largely by China’s continued modernization, Japan’s post-2022 doubling-target trajectory, and steady growth from Australia, India and South Korea. Even at this pace, Asia-Oceania remains a structurally lower-burden region than the Middle East or post-Soviet space.
🇺🇸 United States: a small step back
The US declined slightly in 2025 — a stark contrast with the 2024 release, when the US led the global surge with a +9.4% real-terms jump. The US remains comfortably the world’s largest absolute military spender; the precise 2025 share of GDP is below 4%, which is why the country is not among the labelled set on the map.
Year-Over-Year: From 2024 to 2025
Comparing the SIPRI April 2025 release to the April 2026 release shows the direction of the story rather than just the snapshot:
- Global total: $2.65 T (2024) → $2.887 T (2025), +2.9% real-terms.
- Ukraine burden: 34.5% → 39.6% of GDP — the wartime burden is still rising, not stabilising.
- United States: led 2024’s global surge (+9.4% real); pulled back slightly in 2025.
- Top three concentration: US, China and Russia together accounted for $1.48 T — 51% of the world total.
- Global average burden: climbed past 2.5% of GDP, the highest since 2009.
Why % of GDP Matters
Absolute spending tells you who has the biggest defence budget; share of GDP tells you who is on a war footing or running a structurally high-burden posture. The two views often diverge. The United States spends nearly a trillion dollars a year on defence and remains the world’s largest military by every absolute measure — but at under 4% of GDP, the US is far from its Cold War peaks. Conversely, Algeria’s 8.8% burden is dwarfed in absolute dollars by the US, China or India, but tells a clearer story about where the country prioritises its national resources.
Mixing the two framings without acknowledging the distinction is one of the most common errors in popular military-spending coverage — the same mistake that surfaces every time someone declares Ukraine “the world’s biggest military spender” on the basis of its GDP share alone.
Caveats and Coverage
- Burden, not totals. The map shows military spending as a share of GDP. Don’t conflate it with absolute dollar spending — the US, China and India spend far more in dollar terms than several countries labelled on the map.
- Wartime vs. structural. “% of GDP” mixes wartime emergencies (Ukraine) with long-standing high-burden postures (Gulf states, Algeria). The fact that Ukraine and Kuwait sit at similar levels here does not mean their situations are comparable.
- Ukraine’s denominator. The 39.6% figure is amplified by economic contraction, not just rising spending. Both numerator and denominator are moving.
- Eleven-year claim is global. The “eleventh straight year of increases” is correct globally but does not apply to every country individually — the US declined in 2025; several others have been flat.
- SIPRI estimates. 2025 figures for some countries are SIPRI estimates rather than government publications. SIPRI flags these in the underlying spreadsheet.
- No data ≠ no military. Some politically sensitive territories show as “no data” on the map. This means SIPRI lacks a credible figure or the regime does not publish — not that the country has no armed forces. Notable absences from the 2025 dataset include North Korea, Syria and Eritrea.
- Coverage: 151 countries have 2025 data; 91 territories appear in light grey because SIPRI has no figure or the territory is not a sovereign state.
All figures are drawn from SIPRI's April 2026 release of the Military Expenditure Database, with cross-referencing against the SIPRI fact sheet and press release.
Primary Data Sources:
- SIPRI Military Expenditure Database – Stockholm International Peace Research Institute. Direct file: SIPRI-Milex-data-1949-2025_v1.2.xlsx. Released 27 April 2026.
- Trends in World Military Expenditure, 2025 — SIPRI Fact Sheet – Annual SIPRI fact sheet covering 2025 data, April 2026.
Press Releases and Reports:
- Global military spending rise continues — SIPRI press release – SIPRI press release, April 2026 — source for the headline figures: $2.887 T total, +2.9% real-terms, +9.2% ex-USA, Europe $864 B / +14%, Asia-Oceania +8.1%, top-3 = 51%.
- NATO Defence Expenditure – NATO's quarterly defence expenditure tables, used for cross-referencing the European 2% target context.
Image Sources:
- Map: Mappr editorial – Created by Mappr.co using QGIS and Natural Earth Admin 0 Countries (1:50m, public domain) for the country geometries.
Budgets aside, only a handful of states hold the ultimate deterrent — see our map of countries with nuclear weapons.


- Military Spending By Country In – World Map — SIPRI / mappr.co