
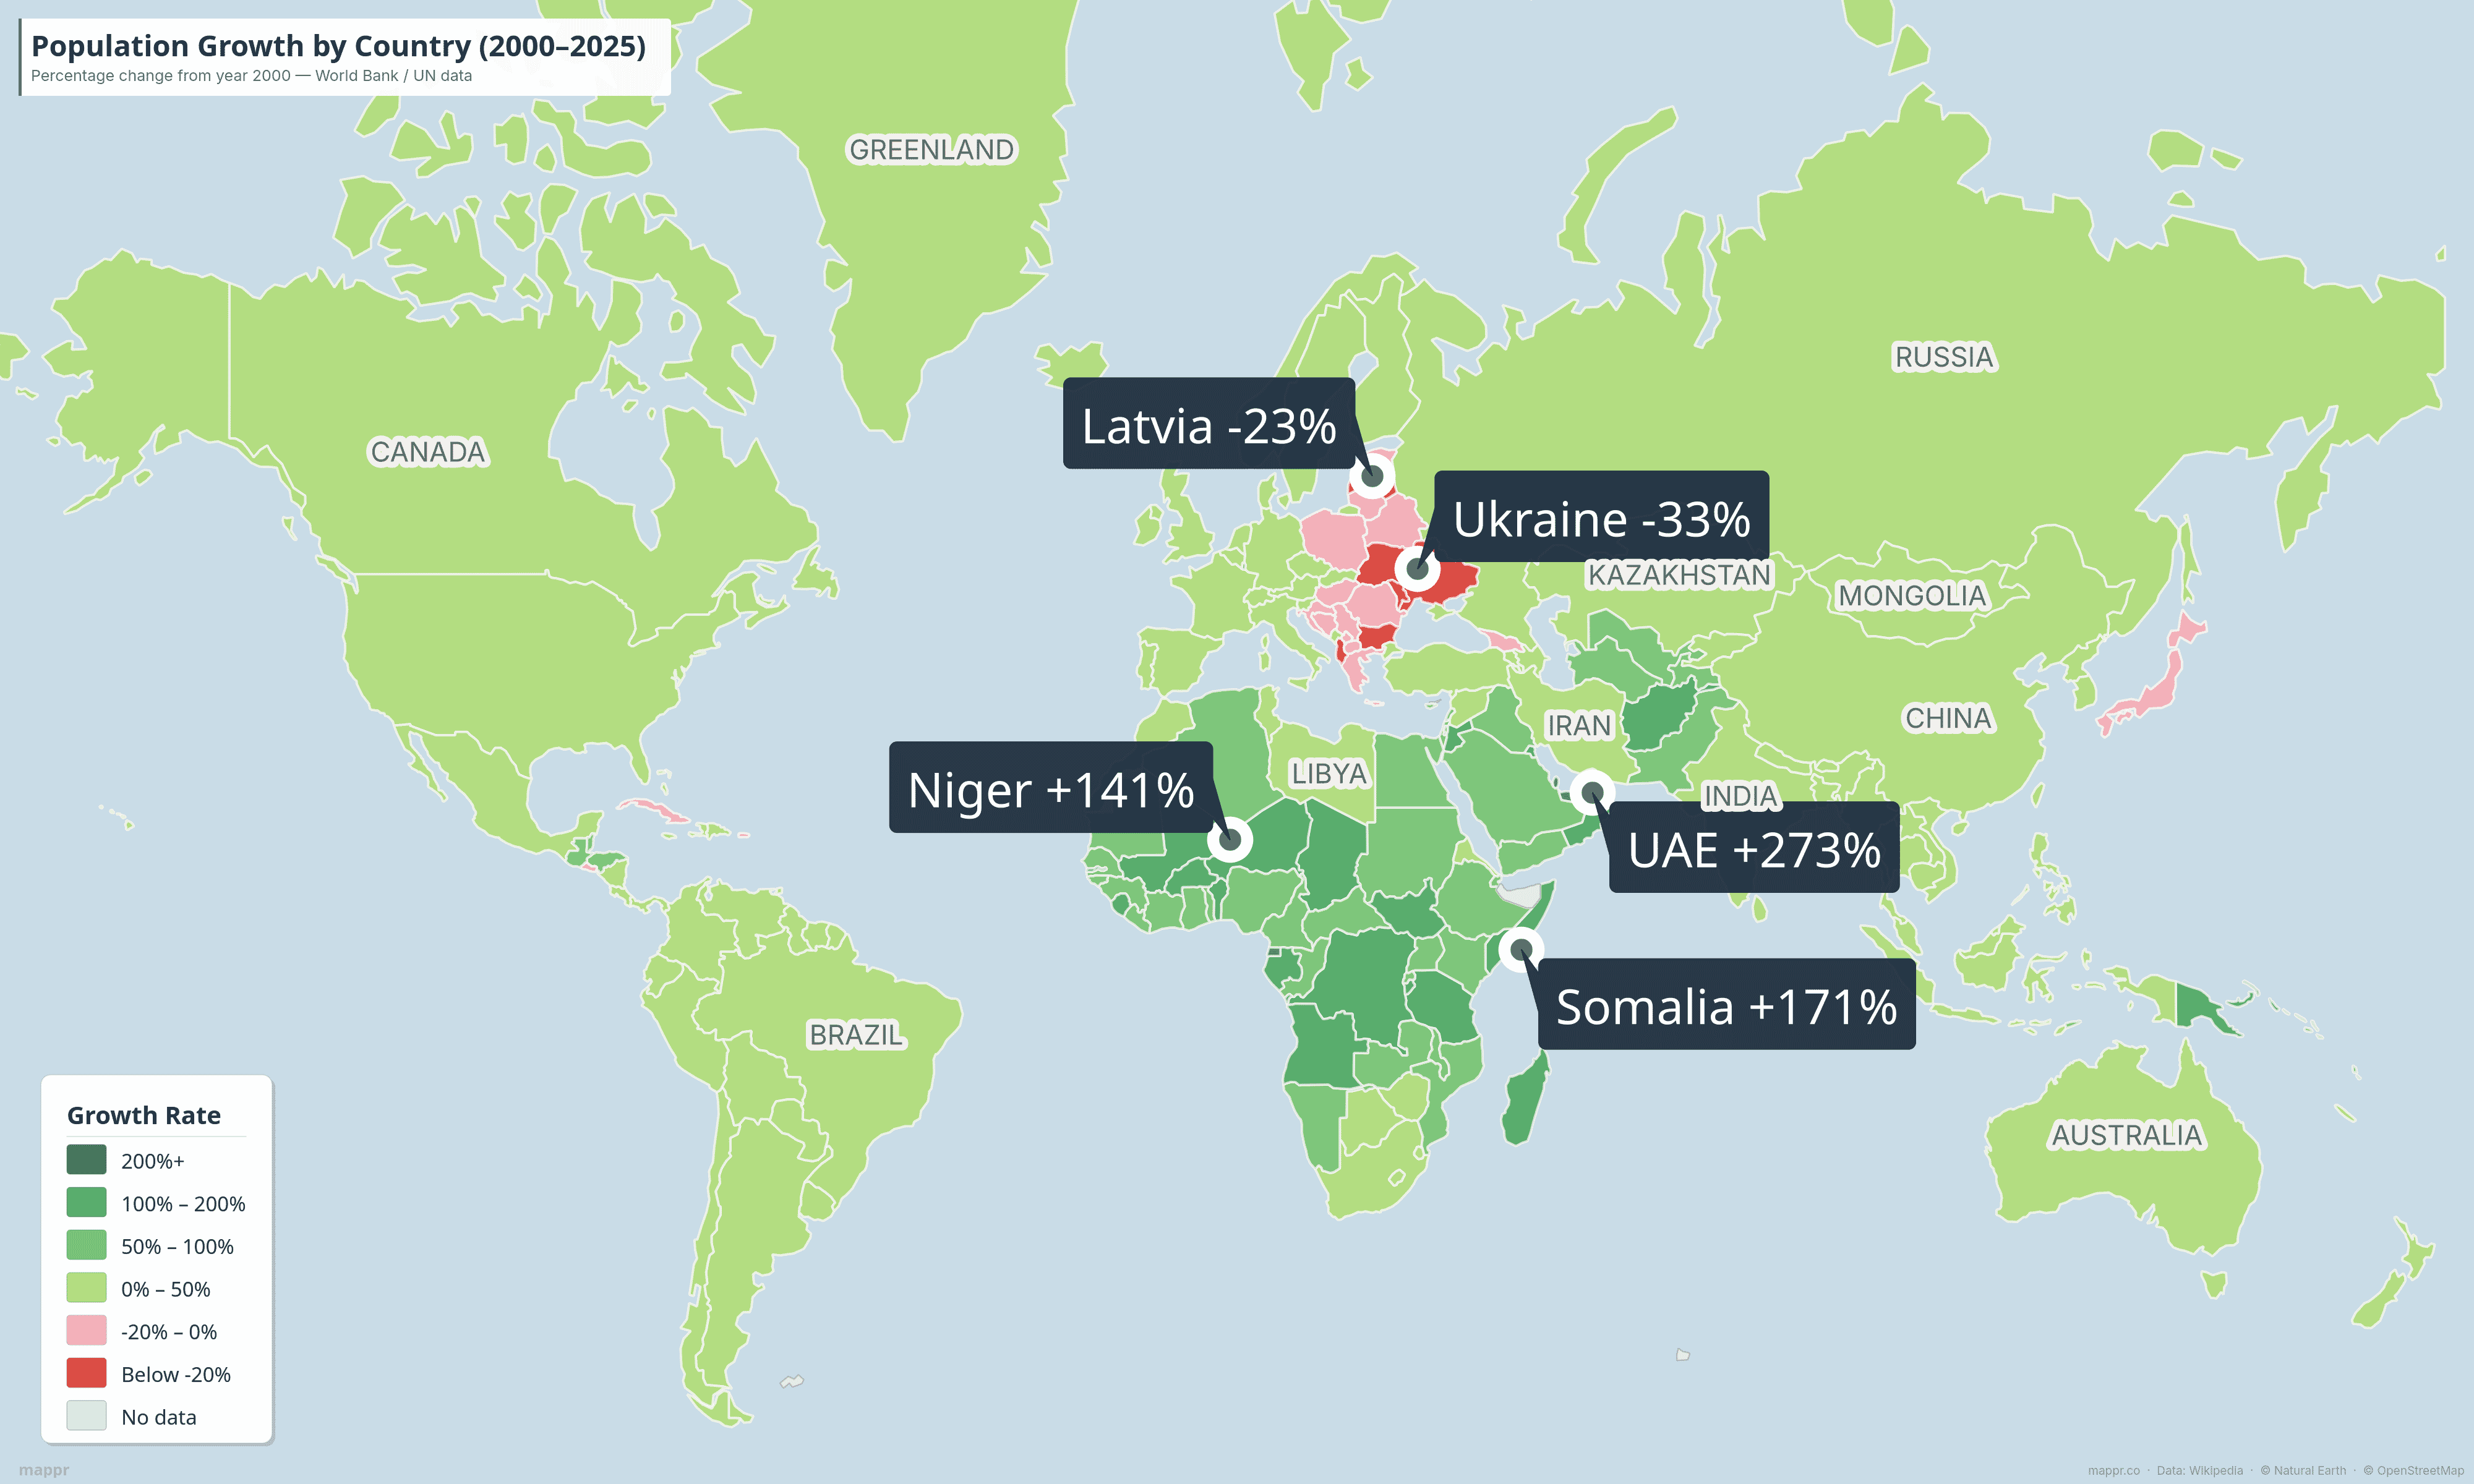
The world added nearly 1.9 billion people between 2000 and 2025 — growing from 6.1 billion to just over 8 billion. But that growth was staggeringly uneven. While Qatar nearly quintupled its population through mass labor migration, countries like Ukraine and Bulgaria lost a quarter or more of their people to emigration, war, and plunging birth rates.
Using data from the World Bank and UN Population Division, we mapped population growth in every country from 2000 to 2025. The results reveal a world splitting in two: explosive growth across the Gulf states and Sub-Saharan Africa, and accelerating decline across Eastern Europe and parts of East Asia.
Key Takeaways
- 183 countries grew, while 32 declined between 2000 and 2025
- Qatar led all nations with ~392% growth — nearly all from migrant workers
- 20 countries more than doubled their population in just 25 years
- Africa grew ~76% as a continent — far outpacing every other region
- India surpassed China as the world’s most populous country in April 2023
- Ukraine lost 34% of its population — the steepest national decline globally
- Europe grew just 1.8% overall, dragged down by steep Eastern European losses
Interactive Map: Population Growth by Country
Hover over any country to see its population change since 2000. Green countries grew, red countries declined — and the darker the shade, the more dramatic the shift.
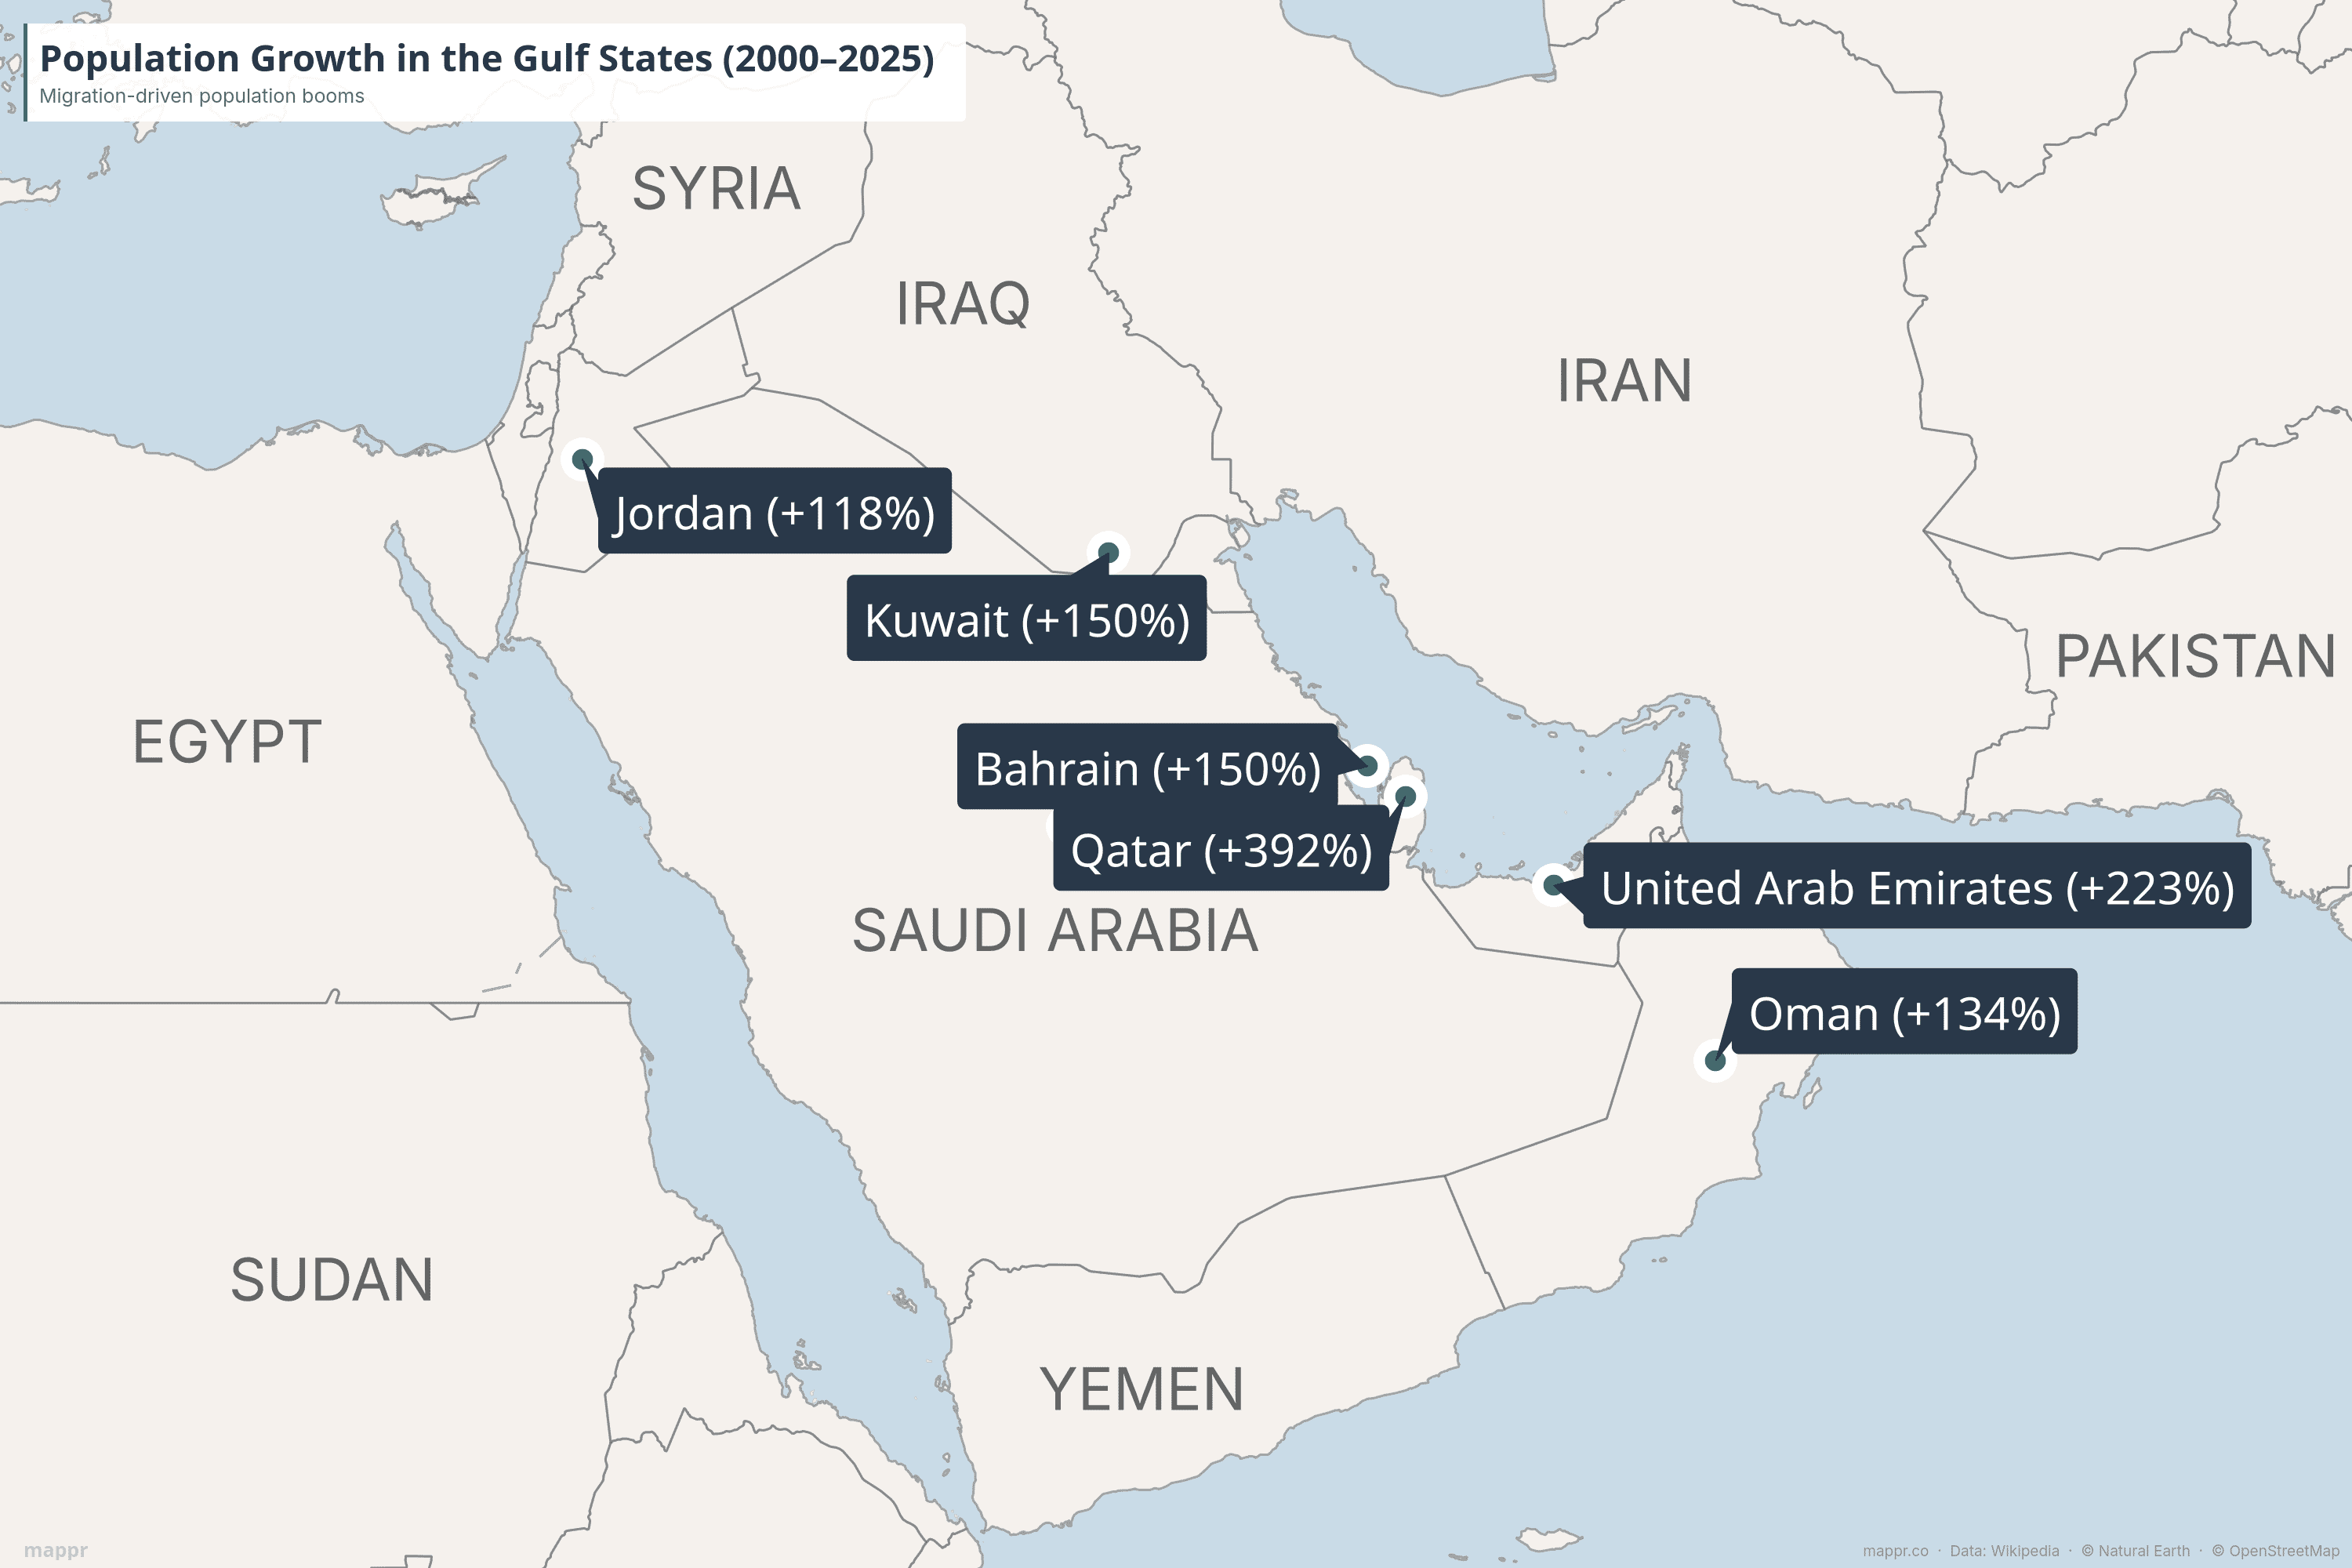
The Gulf States: Migration-Fueled Population Explosions
No region on Earth transformed its demographics as rapidly as the Persian Gulf. Fueled by oil wealth, construction mega-projects, and vast demand for foreign labor, six Gulf nations rank among the top 15 fastest-growing countries since 2000. In most cases, expatriate workers now vastly outnumber citizens.
🇶🇦 Qatar — +392% (645K → 3.2 Million)
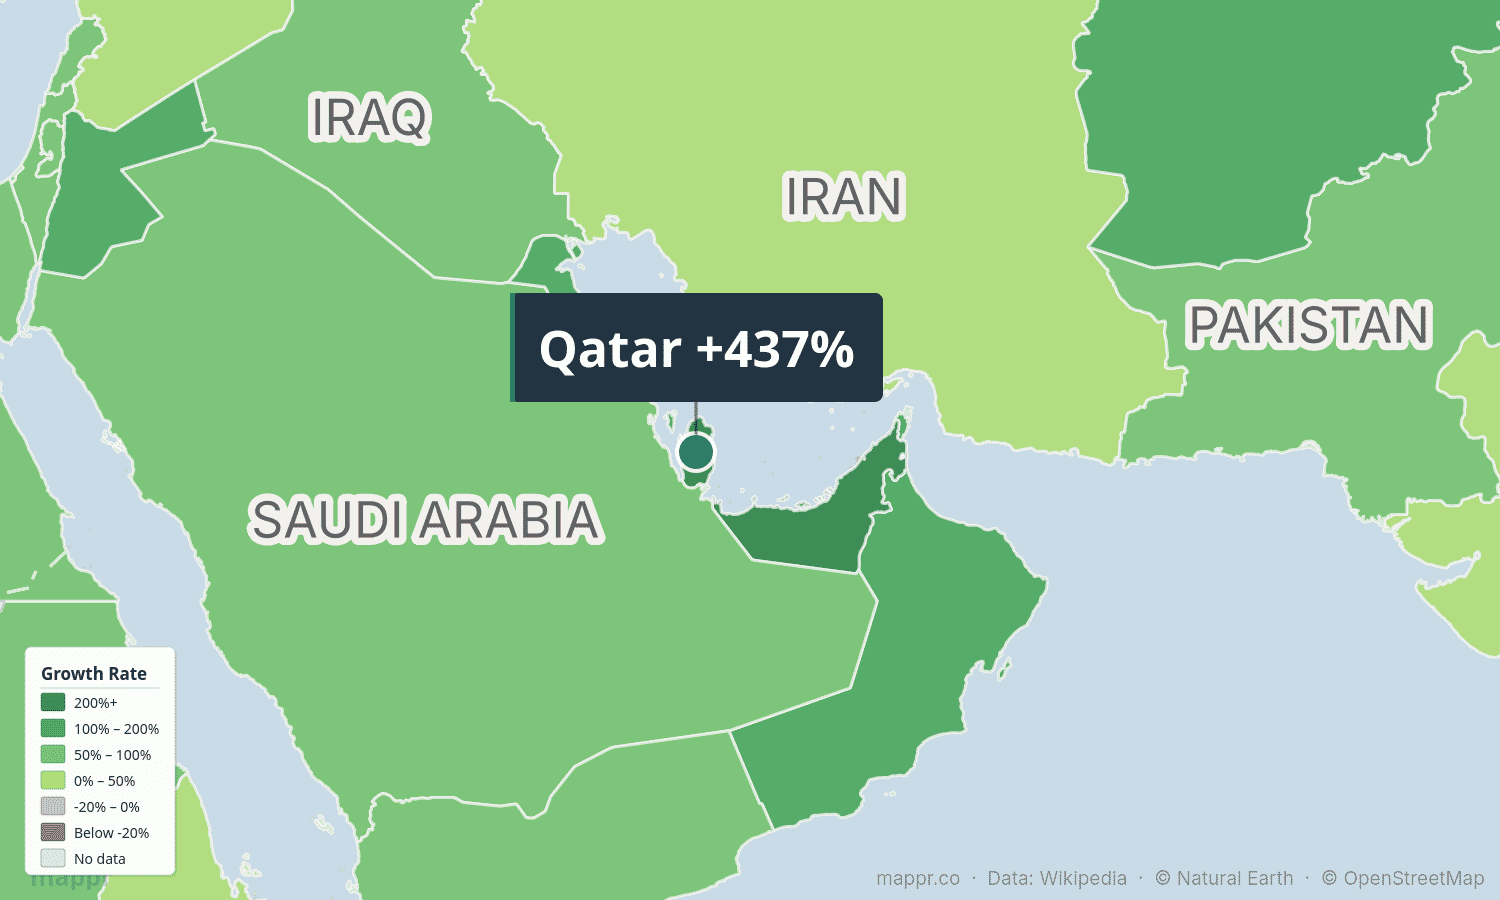
Qatar experienced the most extreme population surge of any country on Earth. In 2000, the tiny peninsula nation had just 645,000 residents. By the end of 2025, that figure reached 3.2 million — a nearly five-fold increase in just 25 years.
The driver was almost entirely labor migration. Qatar’s massive LNG (liquefied natural gas) export boom, followed by the construction frenzy for the 2022 FIFA World Cup, drew millions of foreign workers — primarily from South Asia and Southeast Asia. Today, Qatari citizens make up only about 10-15% of the country’s population. The remaining 85-90% are expatriate workers and their families.
🇦🇪 United Arab Emirates — +223% (3.5M → 11.3 Million)
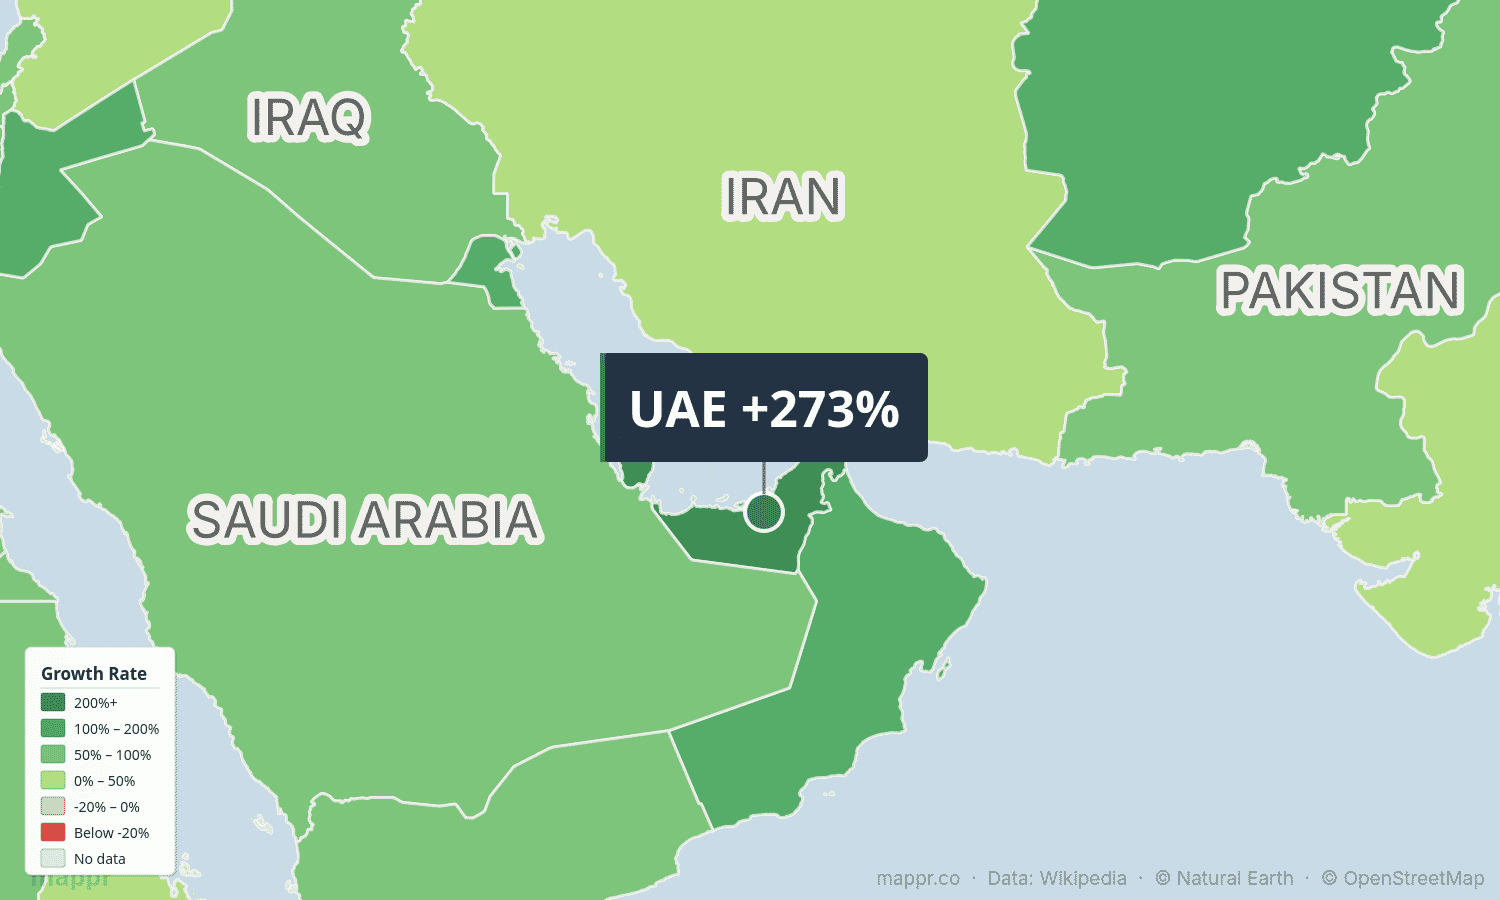
The UAE tripled its population in a single generation. Dubai’s transformation from a modest trading port into a global mega-hub for tourism, finance, and real estate drove enormous labor demand. Like Qatar, Emirati nationals are a small minority — roughly 11% of the total population. The rest are expatriates from India, Pakistan, Bangladesh, the Philippines, and dozens of other countries.
🇧🇭 Bahrain — +150% (638K → 1.6 Million)
Bahrain, the smallest Gulf state, more than doubled its population as it diversified beyond oil into banking, aluminum production, and tourism. Foreign workers account for about 55% of Bahrain’s population — a lower share than Qatar or the UAE, but still a majority of the labor force.
🇰🇼 Kuwait — +150% (1.95M → 4.9 Million)
Kuwait nearly tripled in size, rebounding from the devastation of the 1990 Gulf War. By 2025, more than 3.3 million of Kuwait’s 4.9 million residents are non-Kuwaiti nationals, making it one of the most expatriate-heavy countries in the world.
🇴🇲 Oman — +134% (2.3M → 5.3 Million)
Oman’s population more than doubled as the sultanate invested heavily in infrastructure, ports, and tourism under Sultan Qaboos and his successor. Foreign workers now make up roughly 44% of the population, drawn largely by construction and service-sector jobs.
🇸🇦 Saudi Arabia — +118% (16.2M → 35.3 Million)
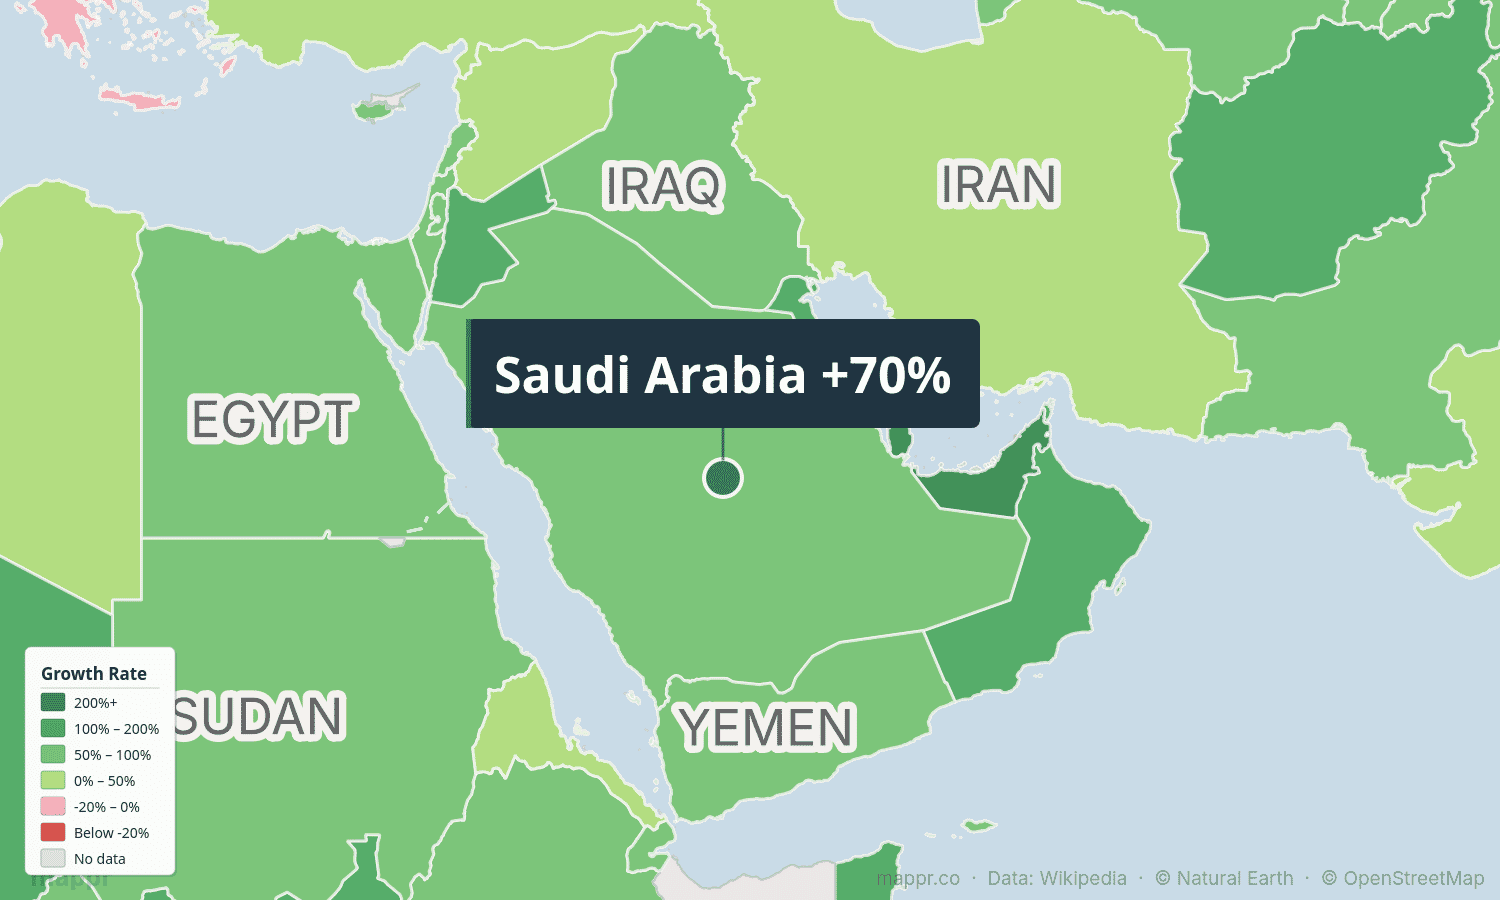
Saudi Arabia is by far the largest Gulf state, and its population more than doubled. Unlike the smaller Gulf nations, Saudi Arabia has both high natural growth (a young population with historically high birth rates) and massive immigration. The Kingdom’s Vision 2030 diversification plan is accelerating population growth further, with mega-projects like NEOM and The Red Sea drawing hundreds of thousands of new workers.
Sub-Saharan Africa: The World’s Fastest-Growing Region
Africa added more people than any other continent since 2000 — growing an estimated 76% in just 25 years. High fertility rates, declining child mortality thanks to improved healthcare, and very young populations are the key drivers. Several African nations more than doubled their populations.
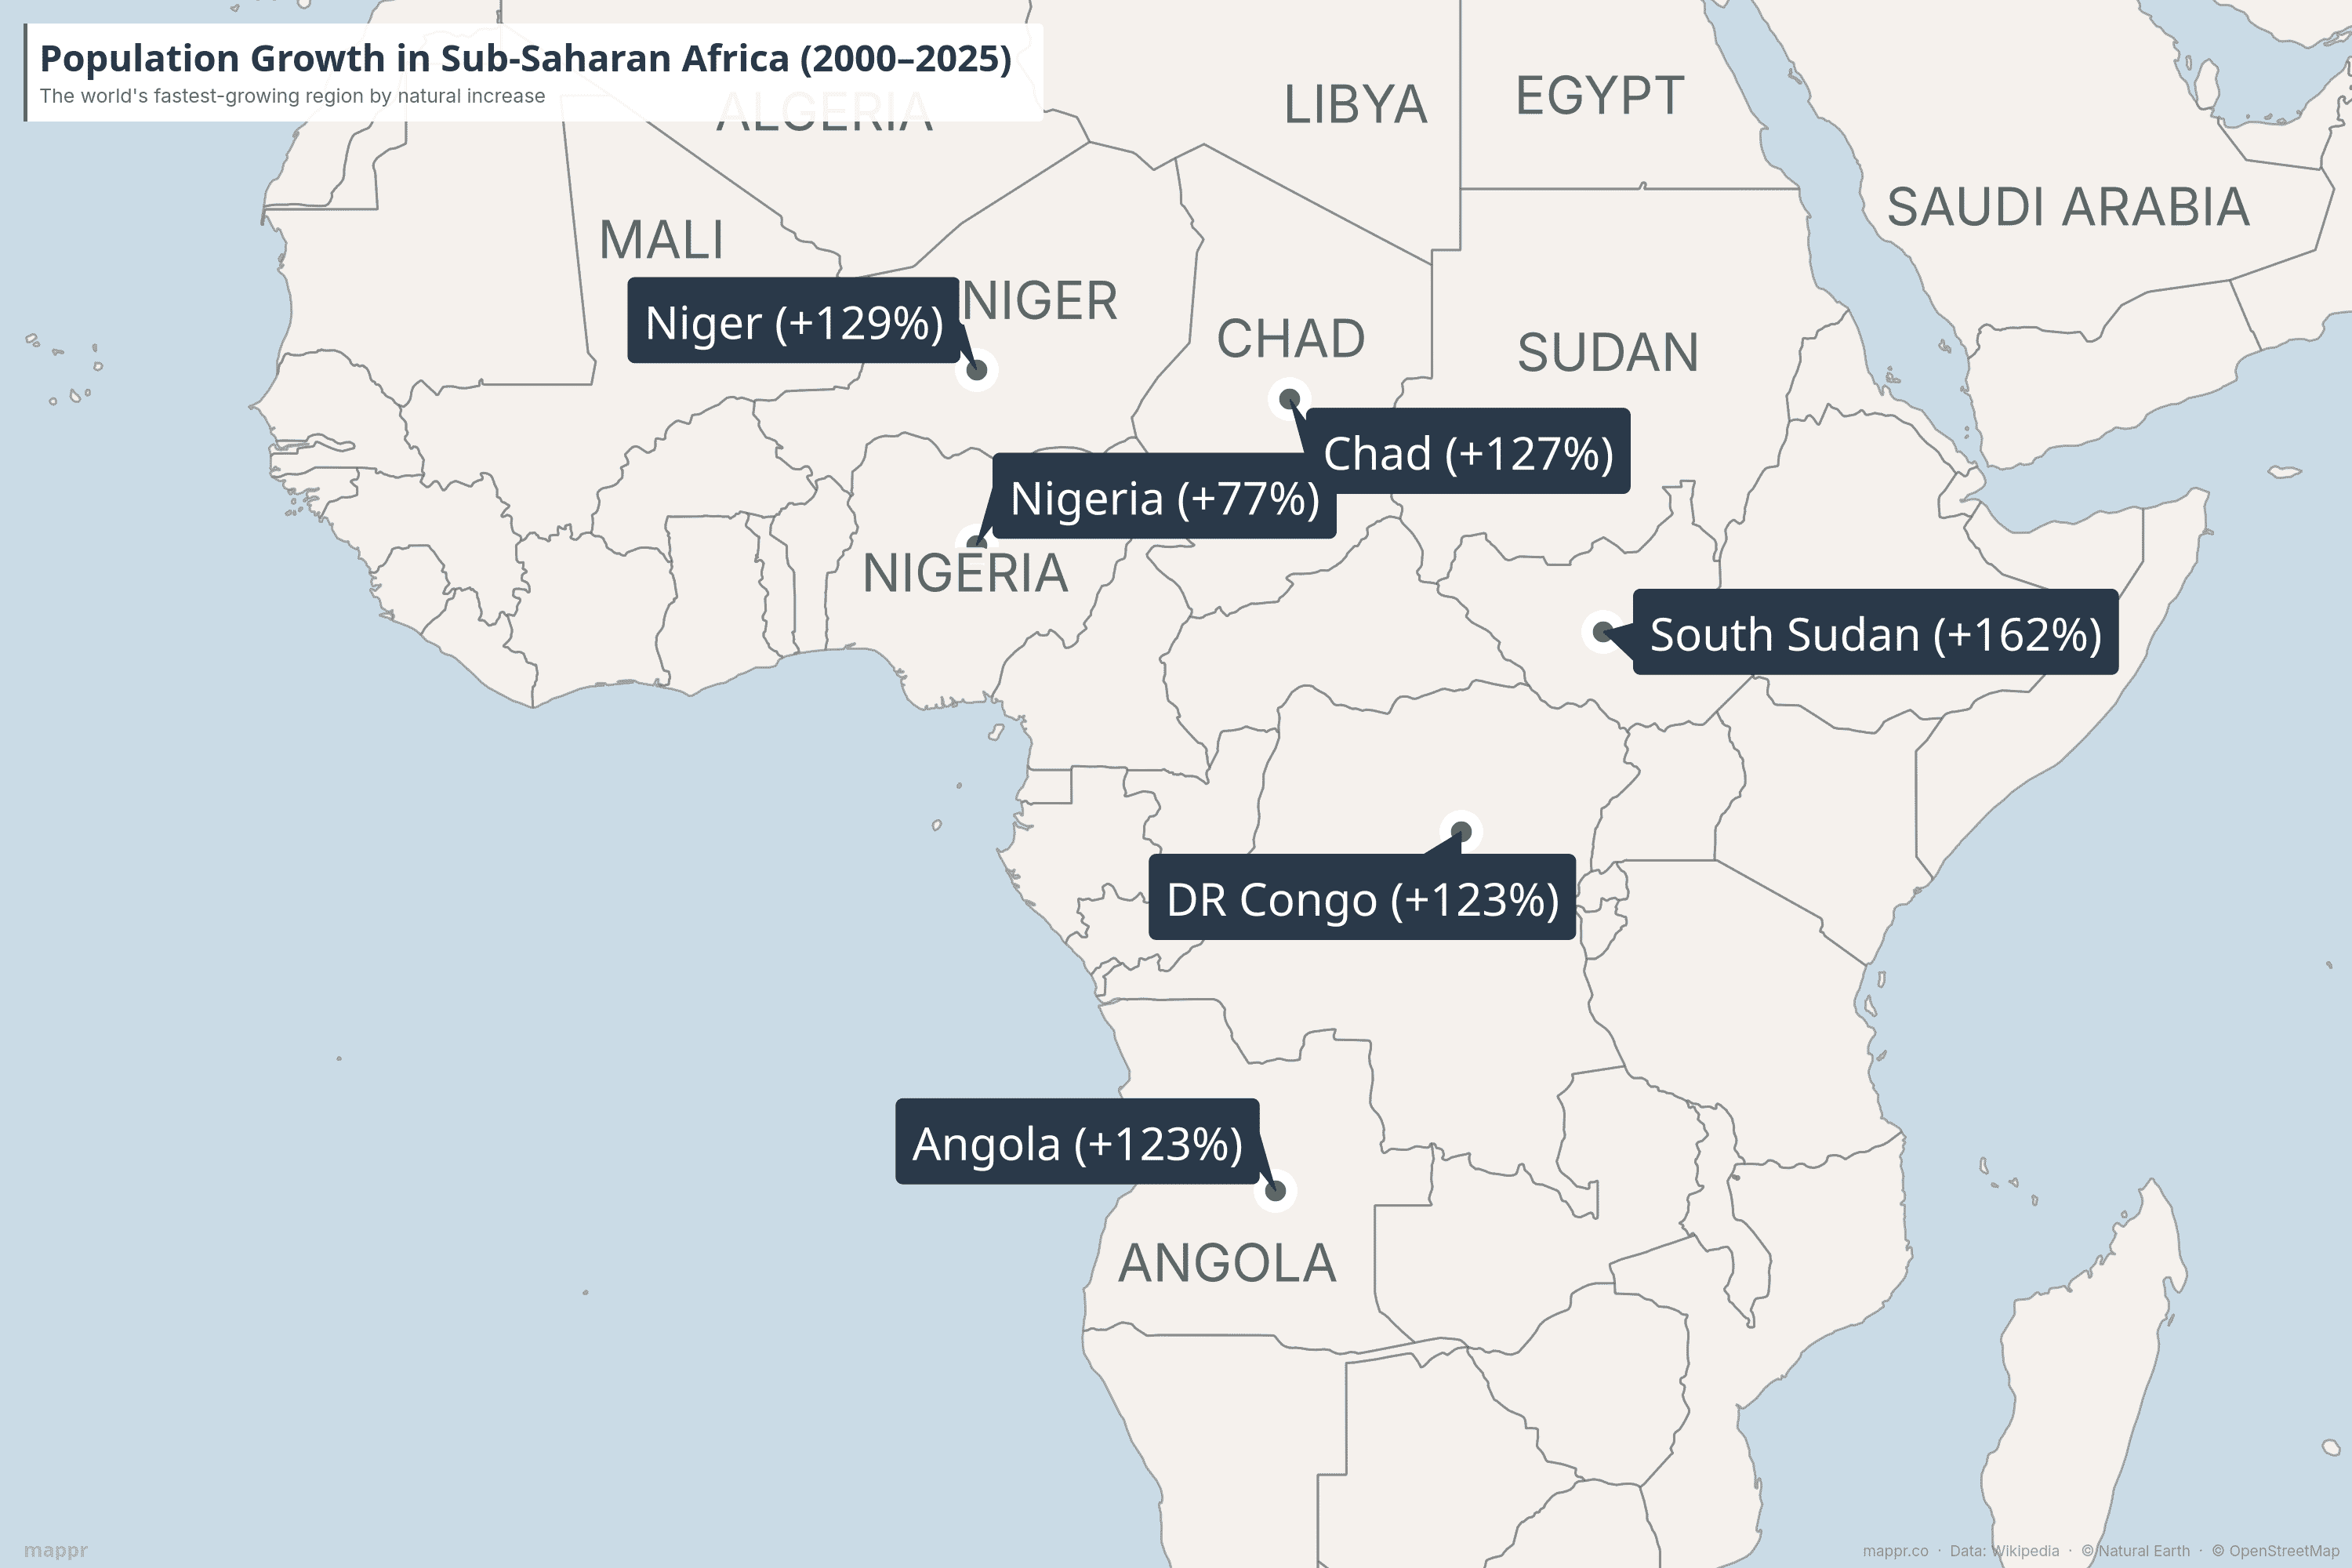
🇳🇪 Niger — +129% (11.5M → 26.3 Million)
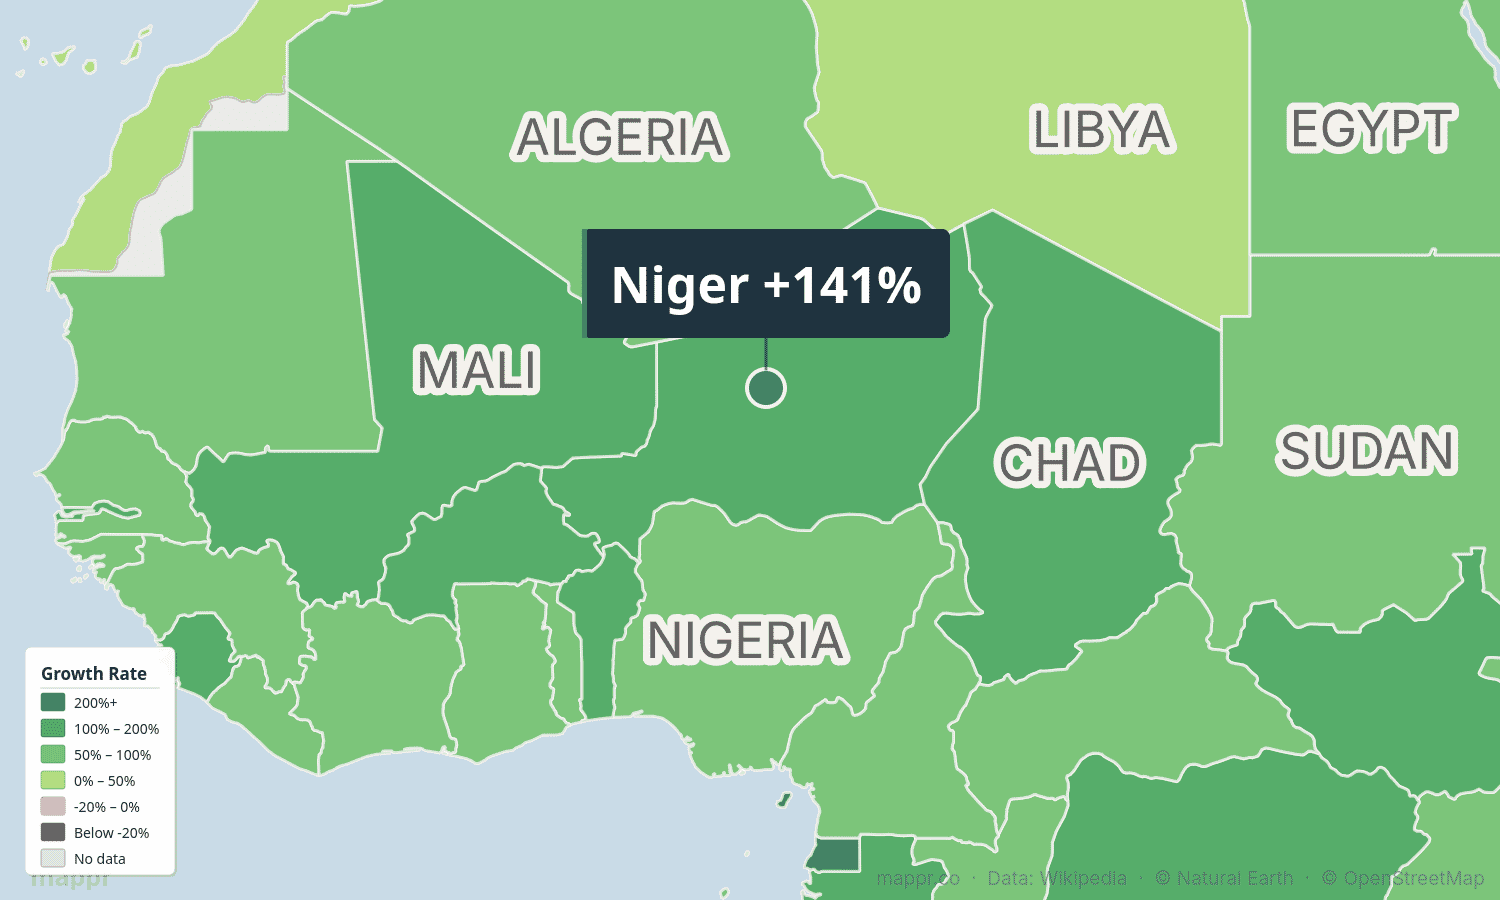
Niger has the highest fertility rate in the world — averaging around 6.7 children per woman. This, combined with a median age of just 15, means Niger’s population has been roughly doubling every two decades. Despite being one of the poorest countries on Earth, its growth rate shows no sign of slowing.
🇹🇩 Chad — +127% (8.5M → 19.3 Million)
Chad more than doubled its population despite persistent conflict, extreme poverty, and a devastating refugee crisis from neighboring Sudan and the Central African Republic. The fertility rate remains above 6 children per woman, sustaining rapid growth even as infrastructure and services struggle to keep pace.
🇦🇴 Angola — +123% (16.2M → 36.2 Million)
Angola’s population more than doubled after the end of its brutal 27-year civil war in 2002. Post-war stability, combined with oil-funded improvements in healthcare and a very high fertility rate (~5.3 children per woman), led to explosive growth. Angola’s median age is just 16 — one of the youngest in the world.
🇨🇩 DR Congo — +123% (50.5M → 112.8 Million)
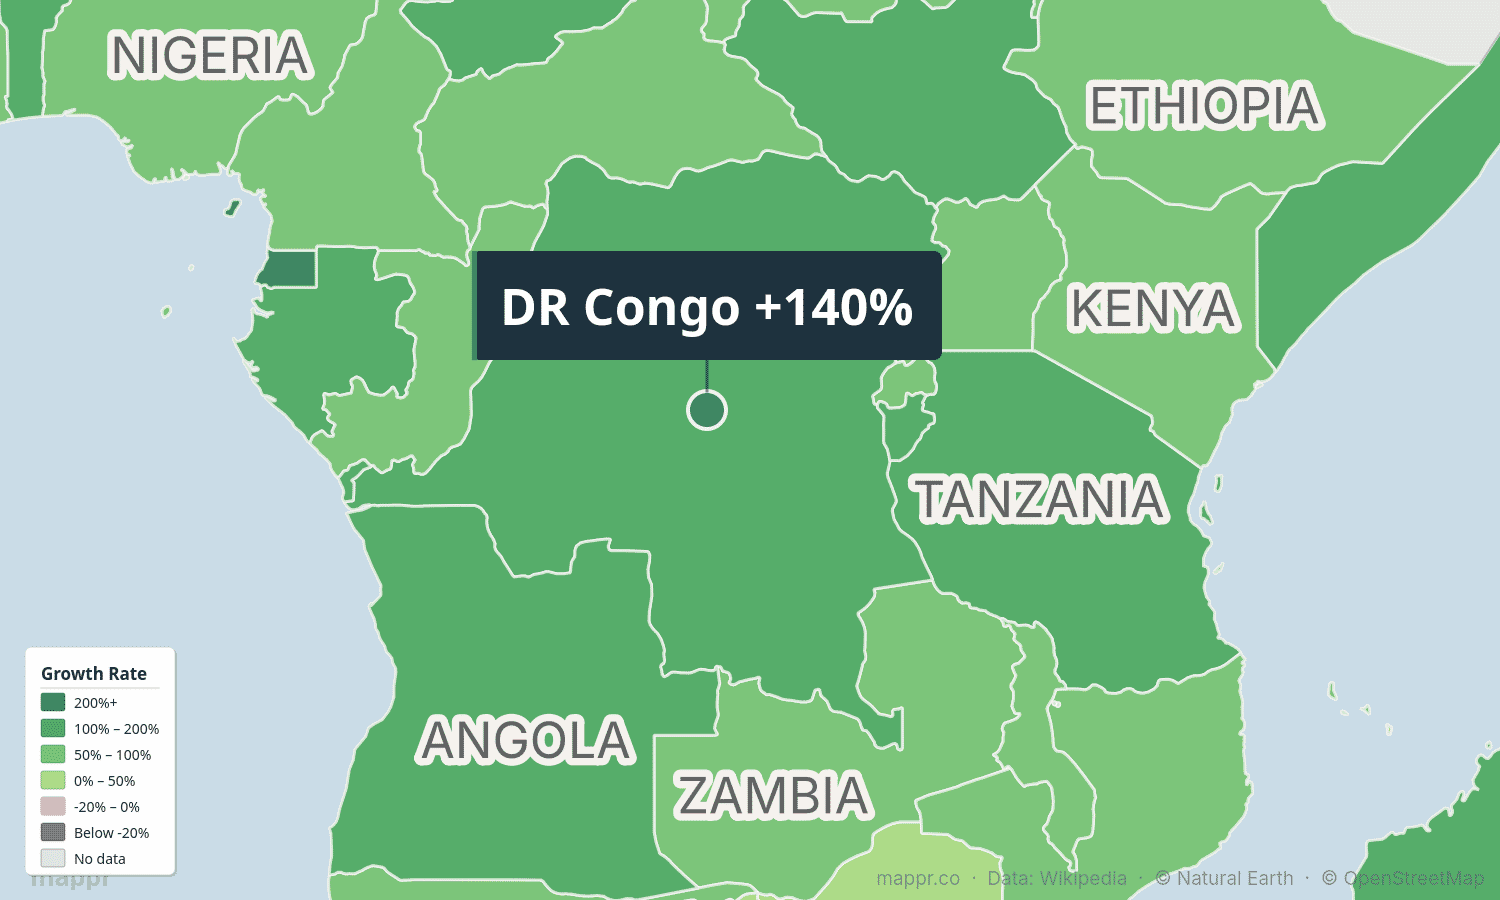
The Democratic Republic of the Congo added over 62 million people — more than the entire population of France — despite decades of conflict. DR Congo now has 113 million residents, making it the third most populous country in Africa after Nigeria and Ethiopia. Its fertility rate of approximately 6.1 children per woman, combined with a median age of 17, means growth will continue for decades.
🇸🇸 South Sudan — +162% (6M → 15.8 Million)
South Sudan — the world’s youngest country, having gained independence in 2011 — recorded enormous growth despite civil war, famine, and mass displacement. Much of the increase reflects improved census counting after independence, combined with a very high fertility rate of roughly 4.5 children per woman and returning diaspora populations.
🇳🇬 Nigeria — +77% (126.4M → 223.8 Million)
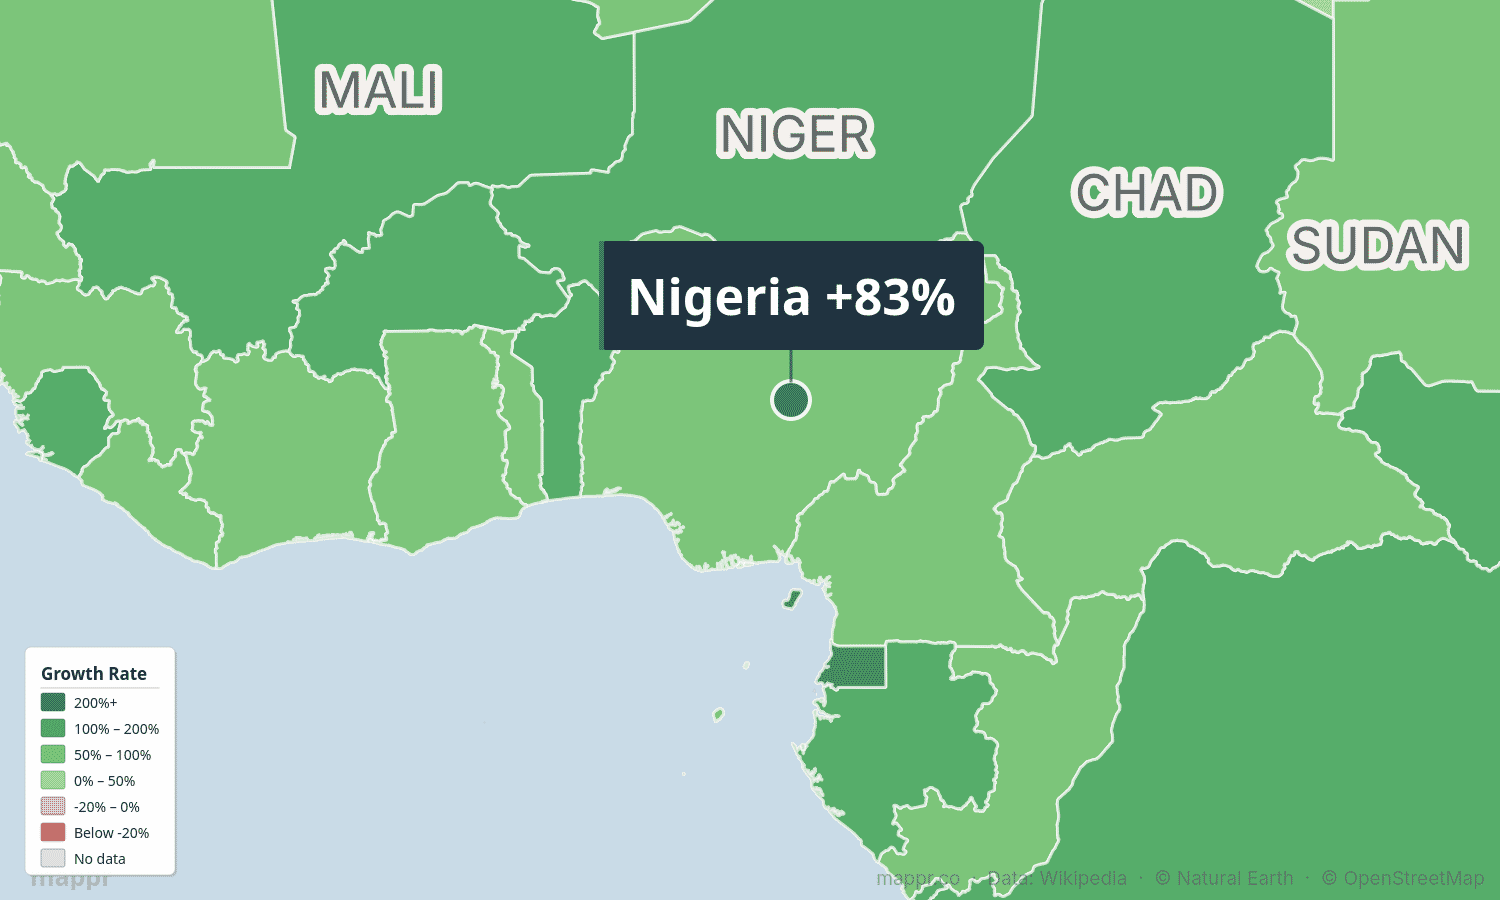
Nigeria added nearly 100 million people since 2000 — the third largest absolute gain after India and China. With 224 million residents, Nigeria is Africa’s most populous nation and the sixth most populous in the world. The UN projects Nigeria will surpass the United States to become the world’s third most populous country by the early 2050s.
Asia’s Dual Story: Booming and Shrinking
Asia contains both the world’s most rapidly growing countries (the Gulf states, Afghanistan) and some of the most notable slowdowns (China, Japan). The continent’s demographic trajectory is anything but uniform.
🇮🇳 India — +34% (1.06B → 1.42 Billion)
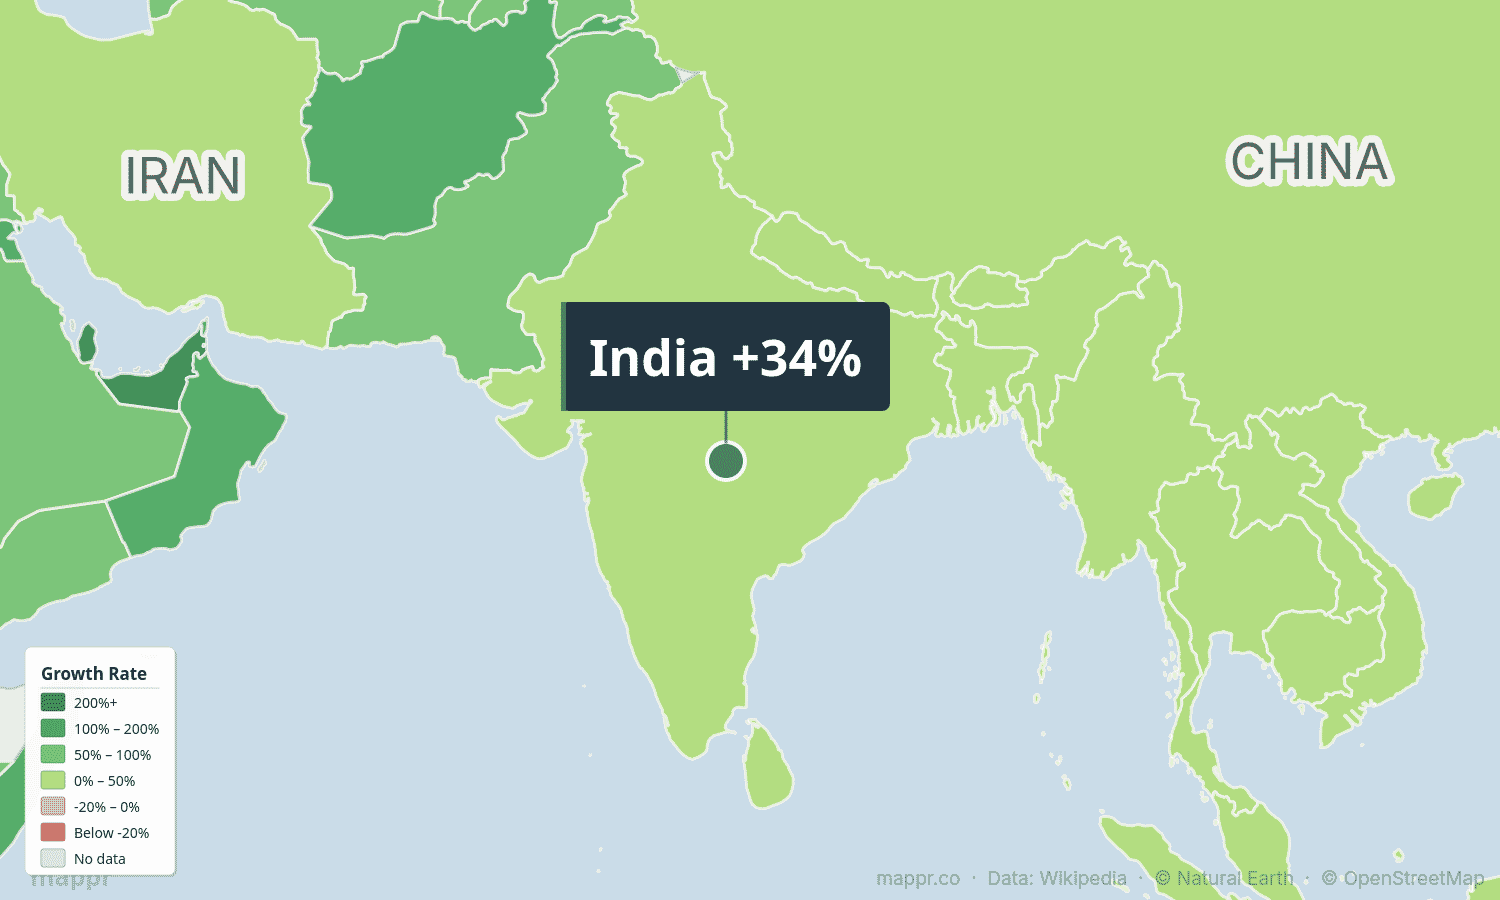
India added 360 million people since 2000 — the largest absolute gain of any country on Earth. In April 2023, India officially surpassed China as the world’s most populous nation. While India’s growth rate has slowed considerably (its fertility rate dropped below 2.0 in recent years), momentum from its enormous young population means India will keep growing until at least the 2060s.
🇵🇰 Pakistan — +56% (154.9M → 241.5 Million)
Pakistan added 87 million people — more than the entire population of Germany. With a fertility rate still above 3 children per woman, Pakistan is projected to surpass Indonesia and possibly Brazil to become the world’s fourth most populous country within the next decade.
🇦🇫 Afghanistan — +118% (20.1M → 43.8 Million)
Afghanistan’s population more than doubled despite two decades of war, a Taliban takeover, and massive emigration. A fertility rate above 4 children per woman and improving infant mortality (particularly from 2002 to 2020 under international aid programs) drove the surge. The return of millions of refugees from Pakistan and Iran after 2001 also contributed.
🇯🇴 Jordan — +118% (5.4M → 11.7 Million)
Jordan’s growth is unique: a significant share came from refugee inflows. The Iraq War (2003), the Syrian Civil War (from 2011), and regional instability pushed millions across Jordan’s borders. Today, registered refugees make up roughly 30% of Jordan’s population, making it one of the world’s largest host countries per capita.
🇨🇳 China — +12% (1.26B → 1.41 Billion)
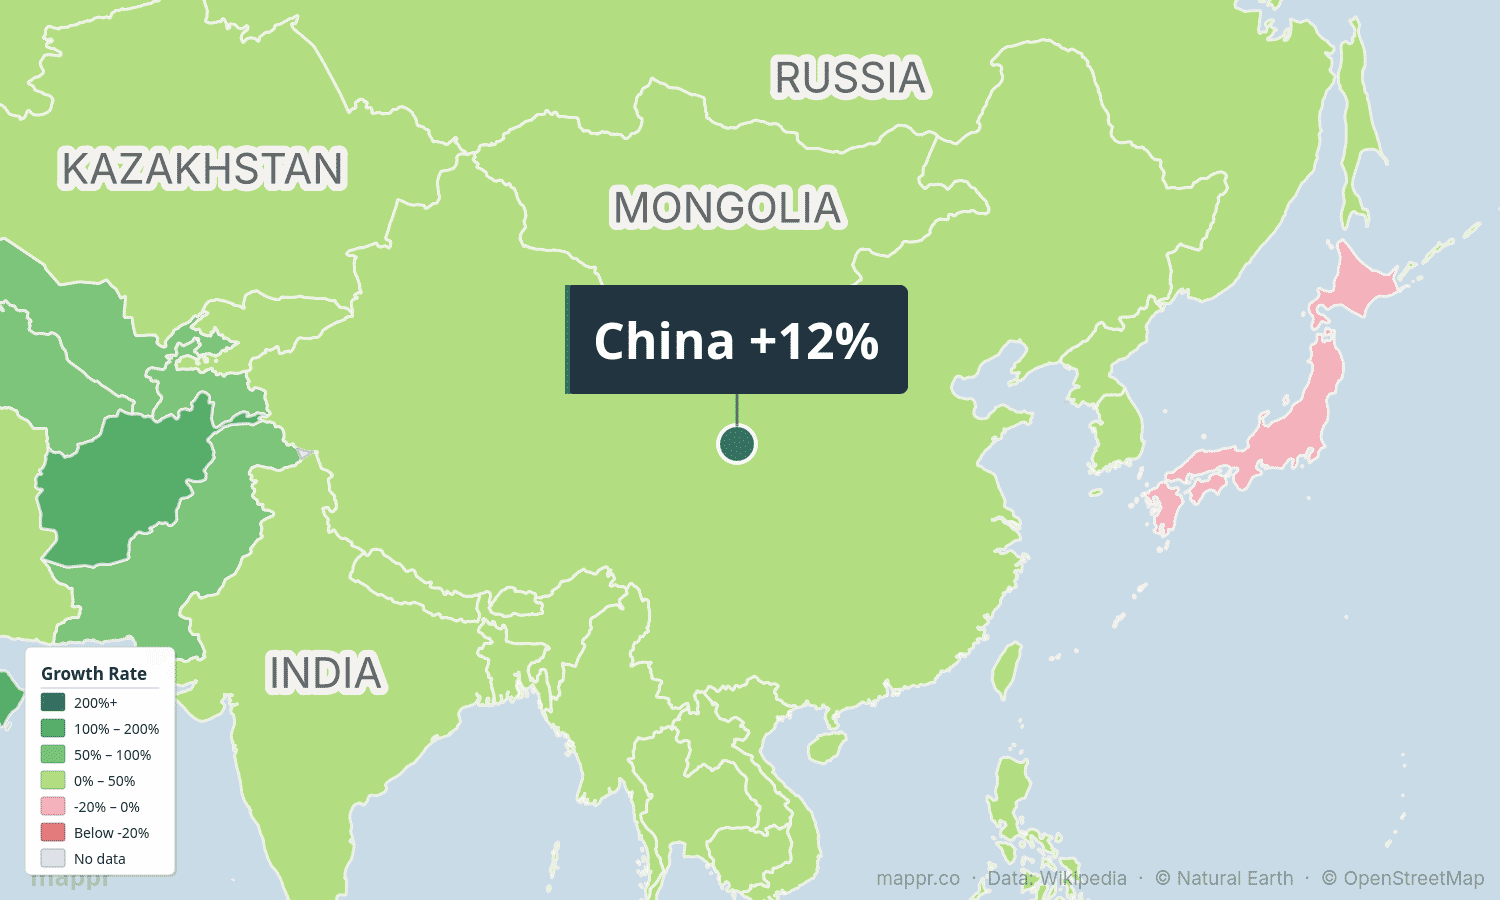
China grew just 12% — and its population actually started shrinking in 2022 for the first time in six decades. Decades of the one-child policy (1980–2015), rapidly rising living costs in cities, and changing social attitudes toward marriage and childbearing produced a fertility rate that has plummeted to around 1.0 — among the lowest in the world. China’s population is now projected to fall below 1 billion by 2080.
🇯🇵 Japan — -3% (126.8M → 123.2 Million)
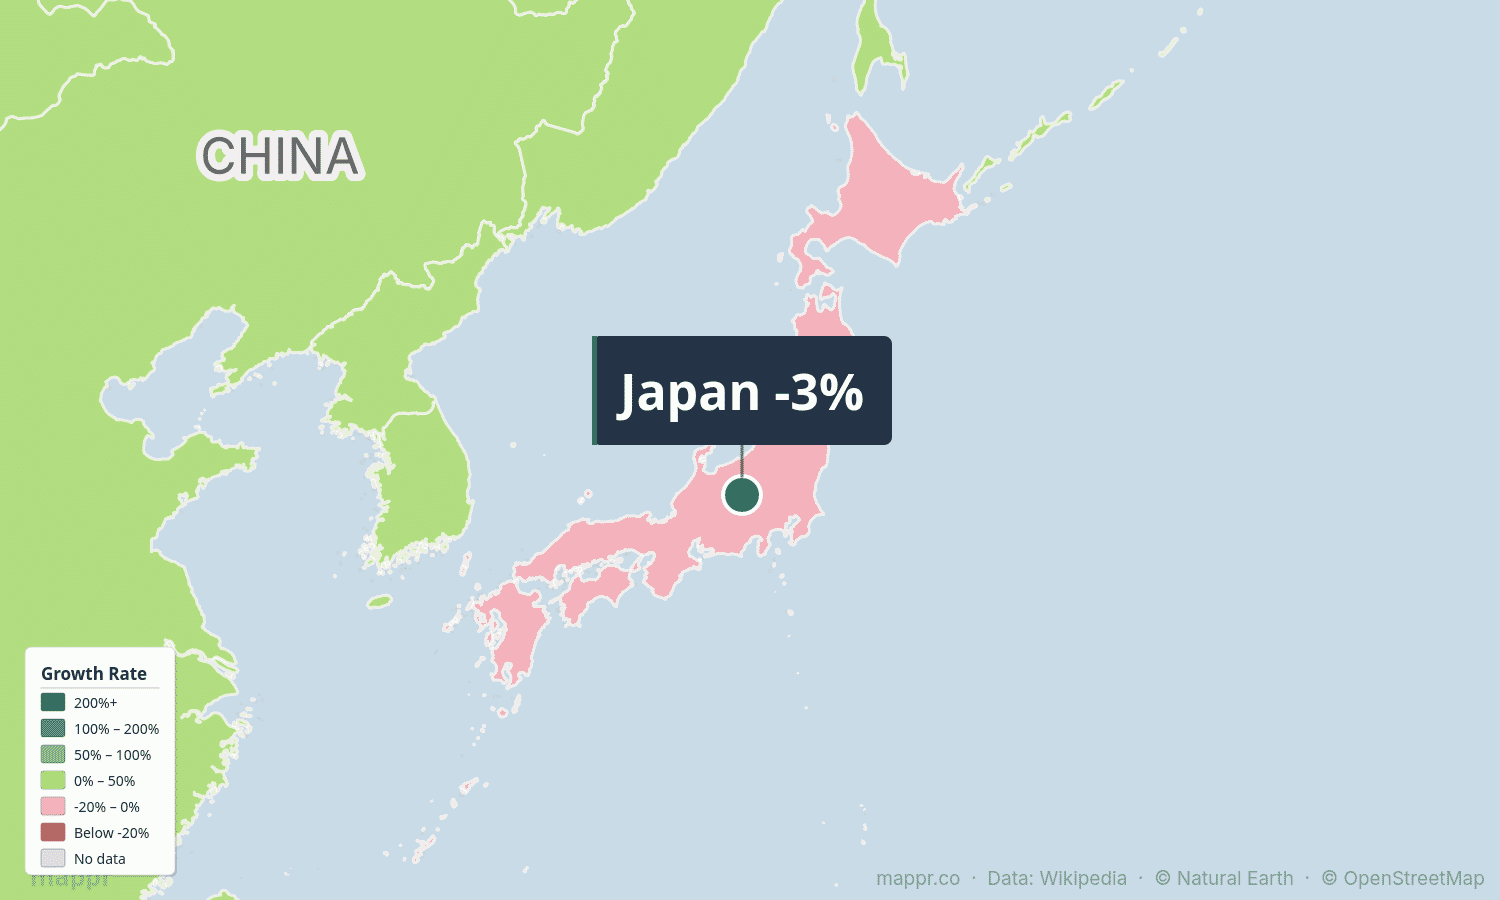
Japan has been shrinking since 2010 and lost about 3.6 million people since 2000. With the world’s oldest population (median age 49) and a fertility rate around 1.2, Japan’s decline is accelerating. The government has declared the demographic crisis a national emergency, but decades of incentive programs have failed to reverse the trend. Japan is projected to fall below 100 million by the early 2050s.
Eastern Europe: The Steepest Declines on Earth
No region lost population as dramatically as Eastern Europe. A toxic combination of low birth rates, aging populations, and massive emigration to Western Europe (accelerated by EU accession) has hollowed out entire communities. Of the 32 countries that shrank since 2000, the majority are in this region.
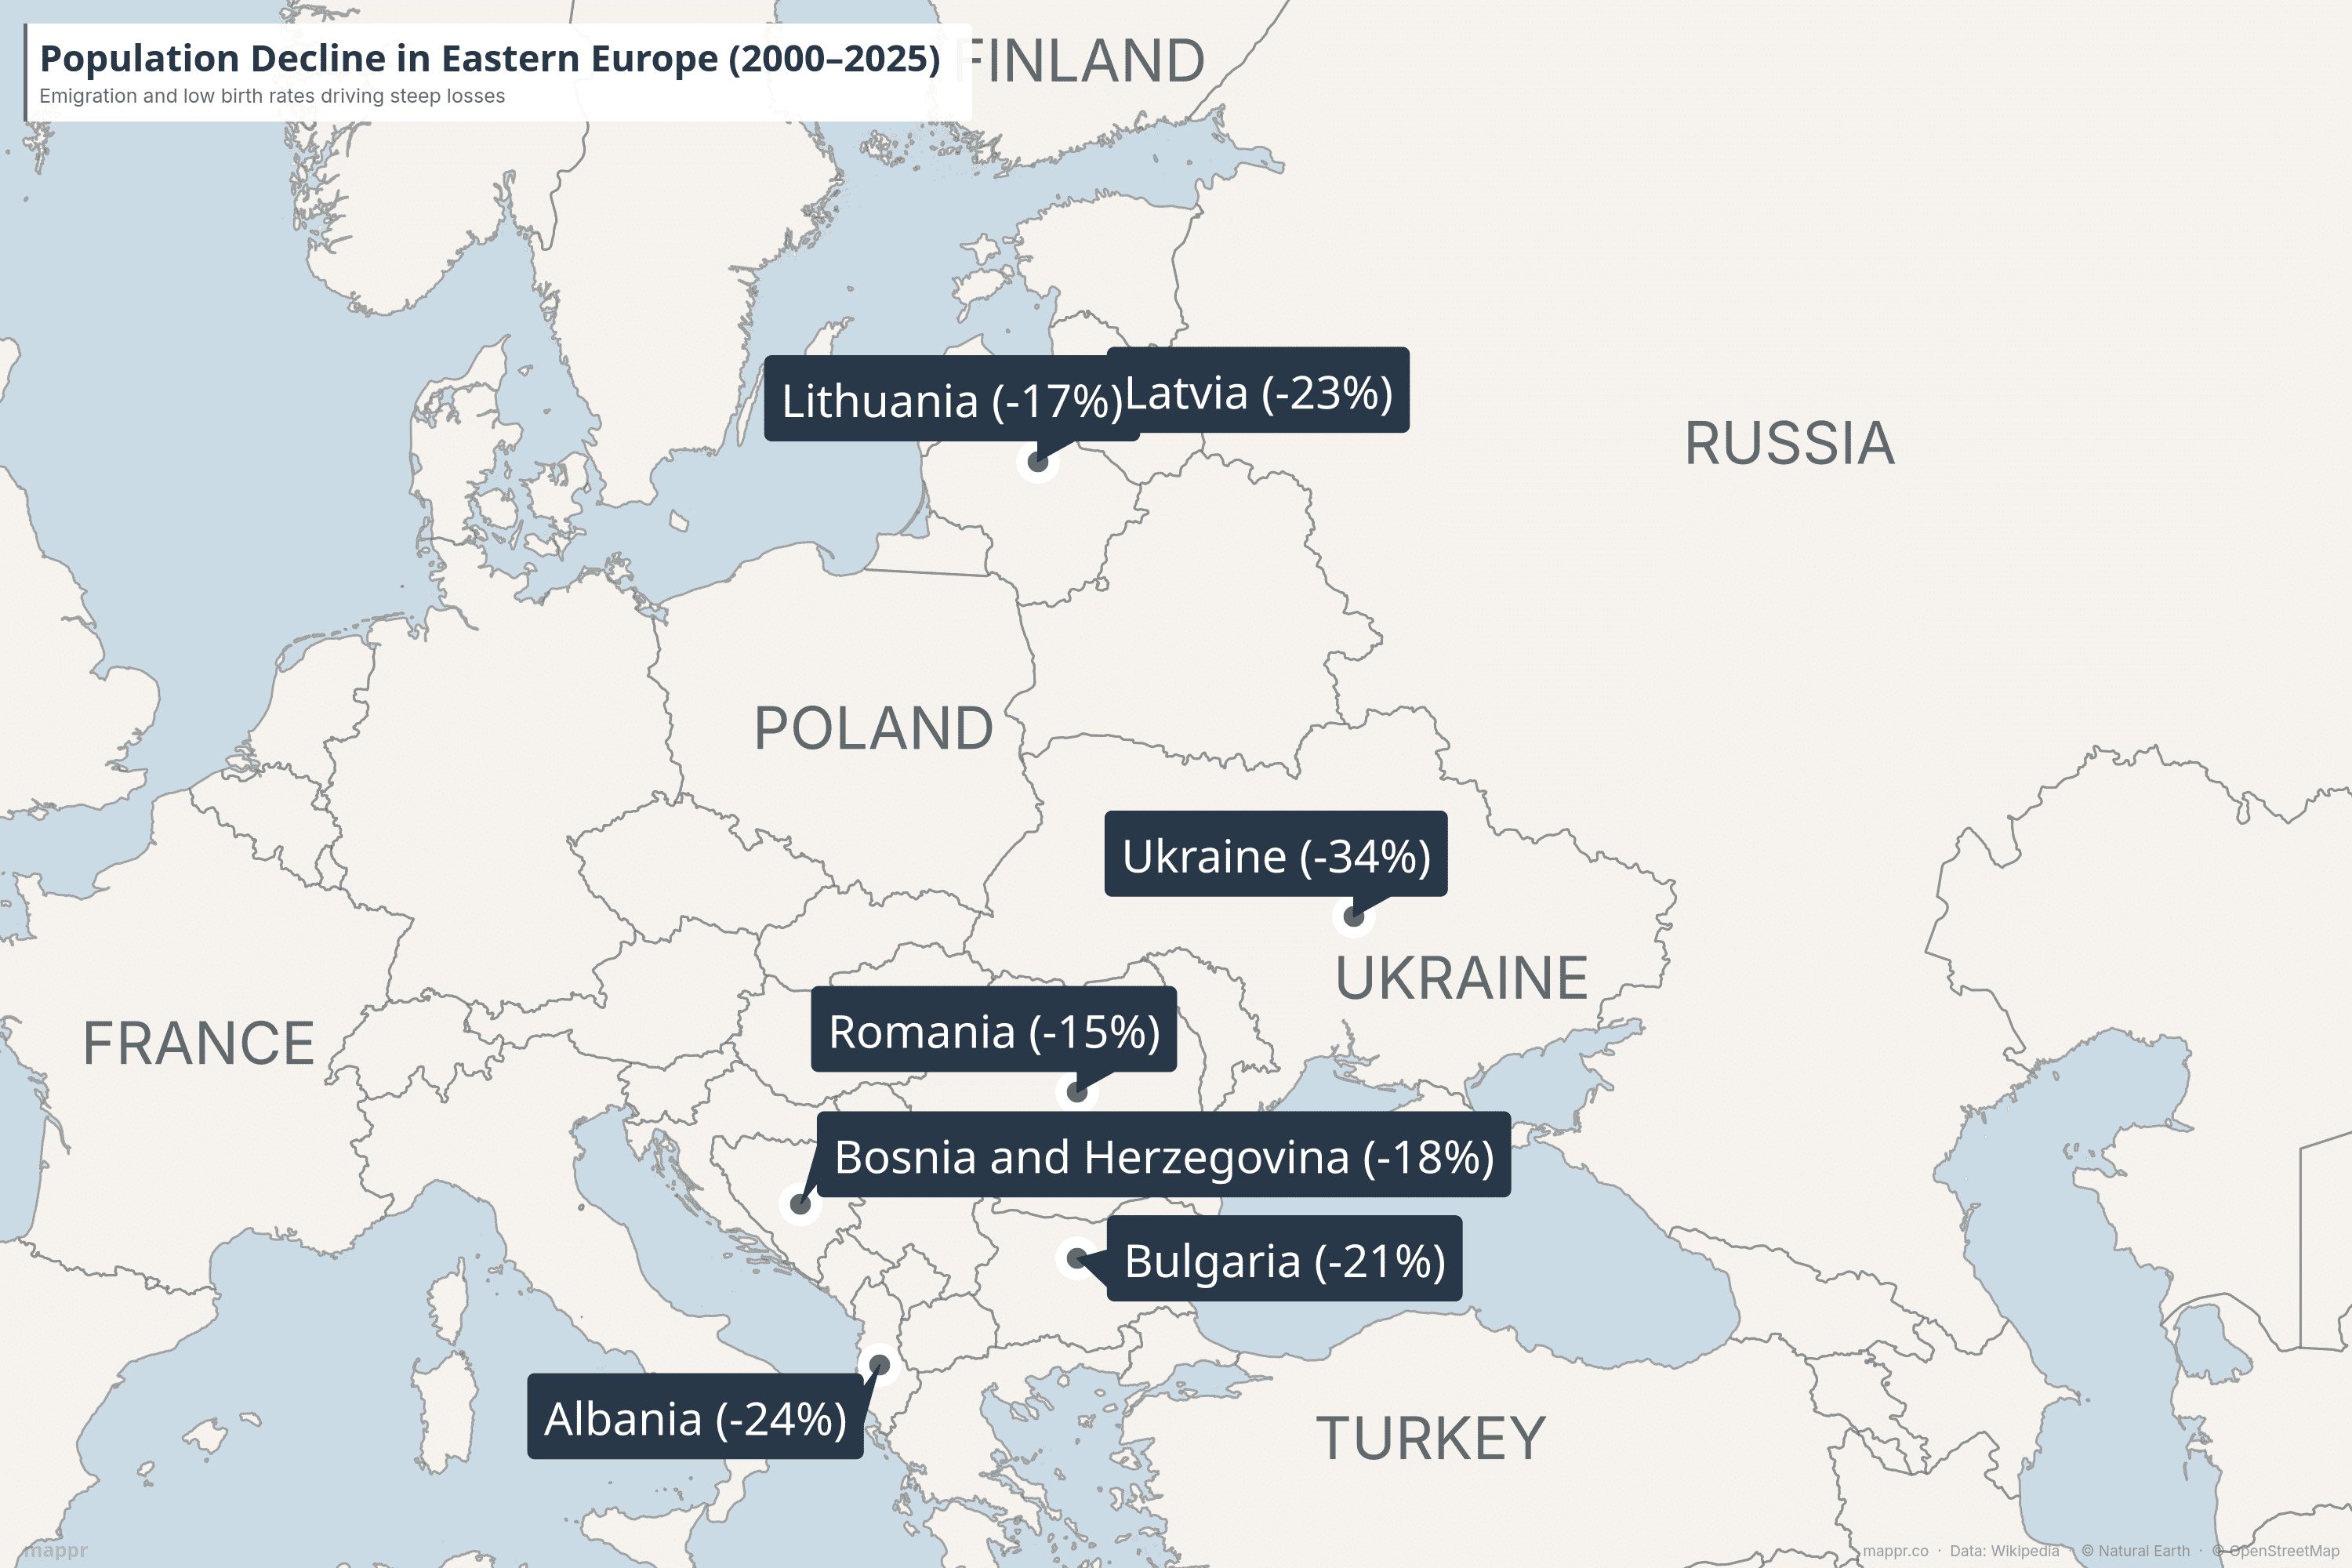
🇺🇦 Ukraine — -34% (49.6M → 32.9 Million)
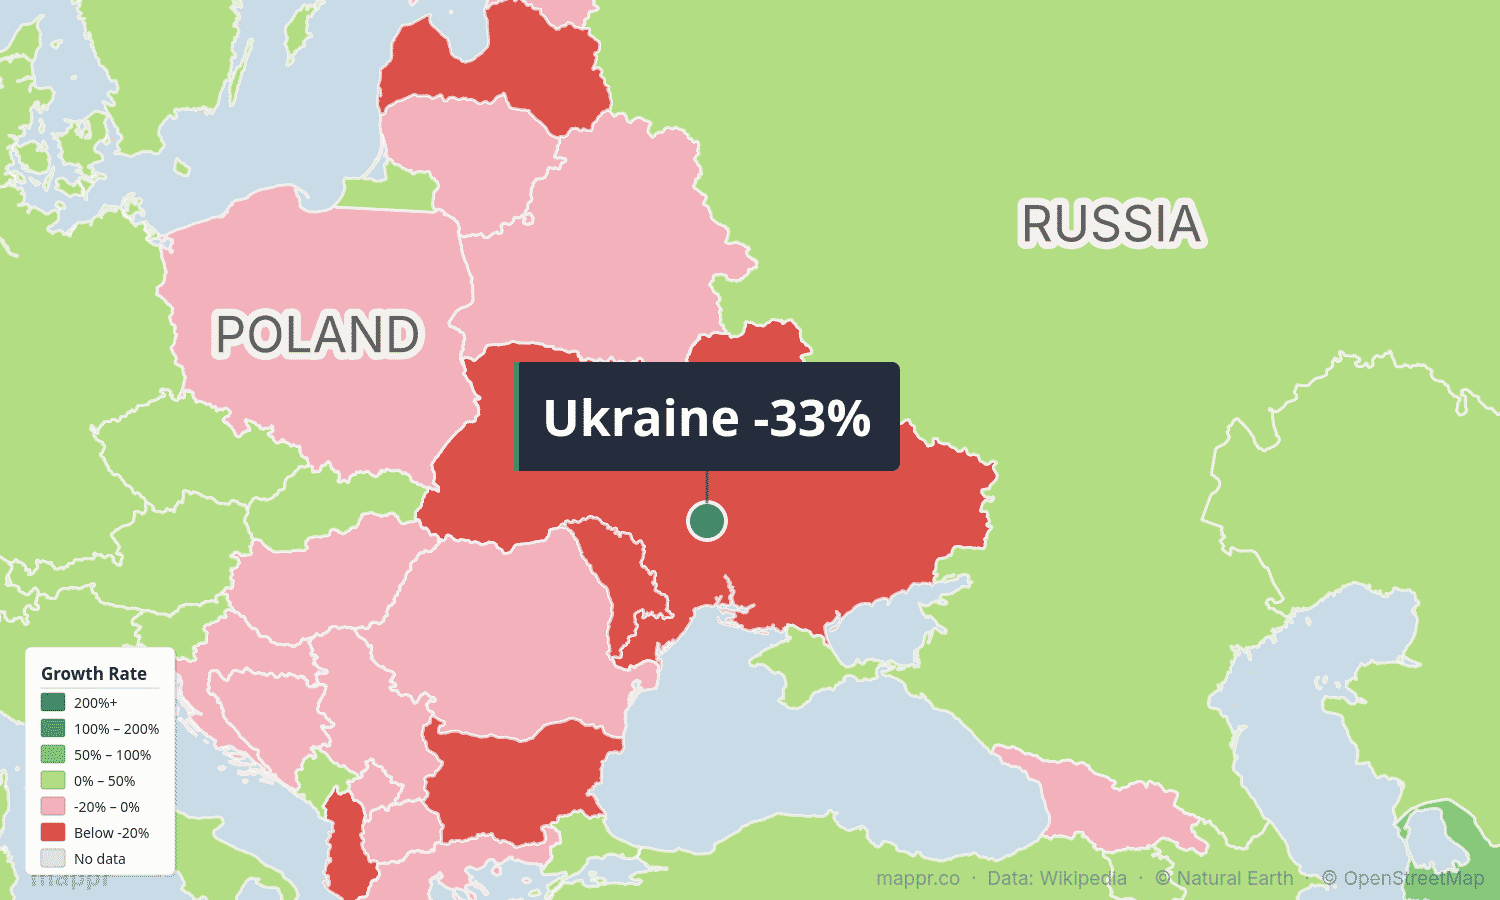
Ukraine experienced the most severe population loss of any major country — dropping from 49.6 million in 2000 to an estimated 32.9 million by 2025. The decline was already serious before 2022, driven by low birth rates and emigration. Russia’s full-scale invasion in February 2022 then triggered the largest refugee crisis in Europe since World War II, with over 6 million Ukrainians fleeing abroad. The war has also directly reduced population through casualties and displaced millions internally.
🇦🇱 Albania — -24% (3.1M → 2.4 Million)
Albania lost nearly a quarter of its population — one of the steepest proportional declines in Europe. After the fall of communism, hundreds of thousands of Albanians emigrated to Greece, Italy, and Western Europe in search of better opportunities. The exodus has continued steadily, particularly among young working-age adults.
🇱🇻 Latvia — -23% (2.4M → 1.8 Million)
Latvia’s population shrank by nearly a quarter since 2000. EU accession in 2004 opened the door to mass emigration, particularly to the UK, Ireland, and Germany. Combined with one of Europe’s lowest birth rates, Latvia faces a demographic spiral: fewer young people means fewer births, which means fewer workers, which drives further emigration.
🇧🇬 Bulgaria — -21% (8.2M → 6.4 Million)
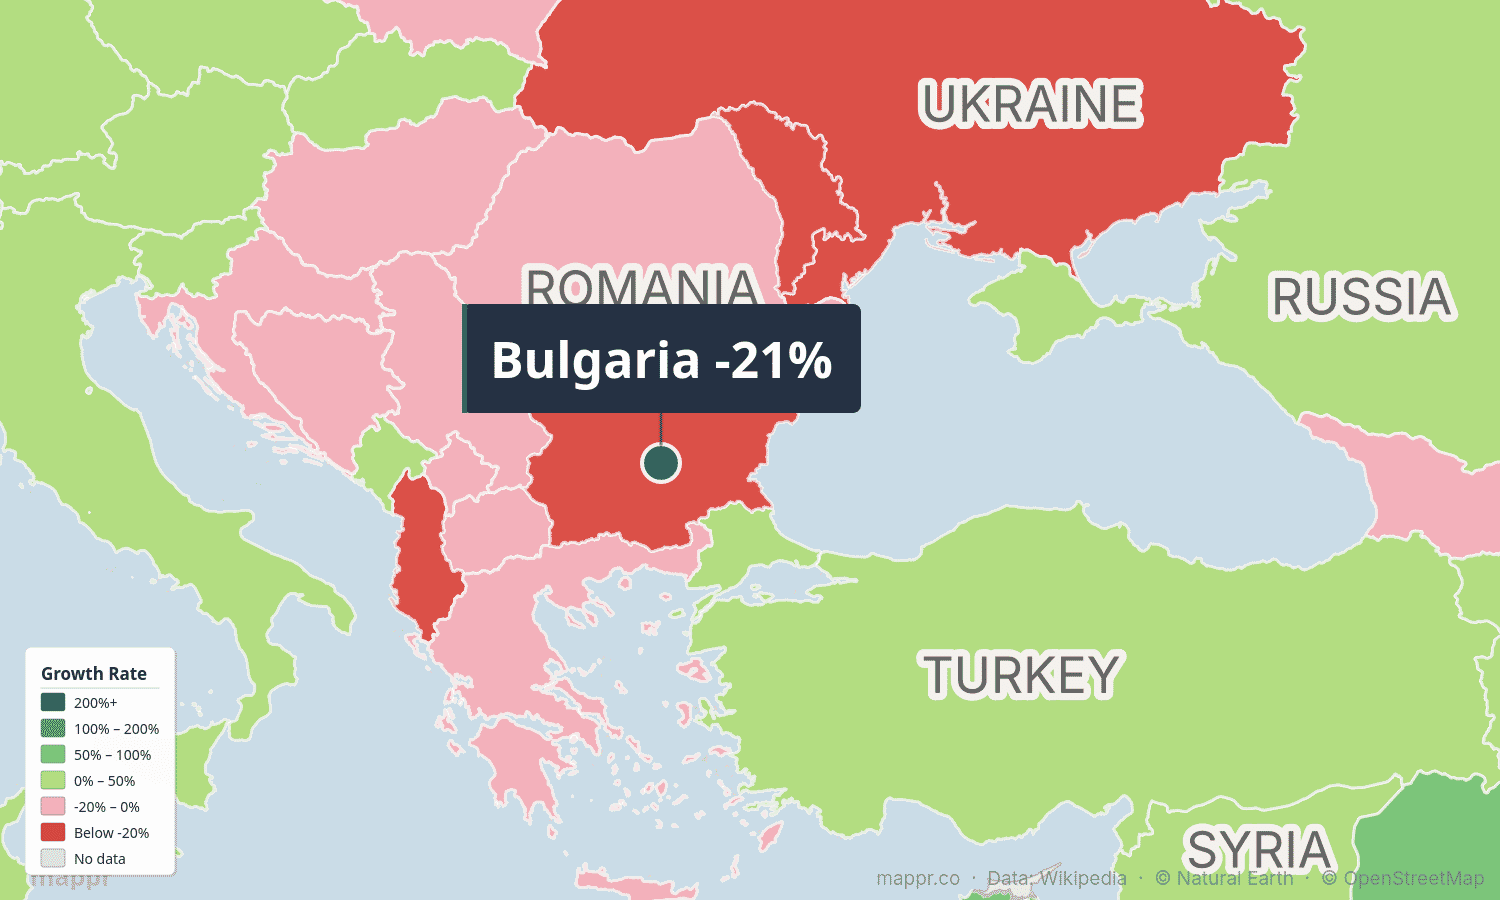
Bulgaria lost over 1.7 million people since 2000 — more than a fifth of its population. Rural villages across the country are emptying out, with some regions losing more than half their residents. Bulgaria’s combination of low wages, EU freedom of movement, and a birth rate hovering around 1.5 has created persistent outward migration.
🇧🇦 Bosnia and Herzegovina — -18% (4.2M → 3.4 Million)
Bosnia never fully recovered from the 1990s war that killed over 100,000 people and displaced half the population. Young Bosnians continue to leave for Germany, Austria, and Scandinavia at alarming rates, citing limited economic opportunities and political dysfunction.
🇱🇹 Lithuania — -17% (3.5M → 2.9 Million)
Lithuania experienced one of the EU’s sharpest emigration waves after joining the bloc in 2004. An estimated 800,000 Lithuanians — nearly one in four — now live abroad, predominantly in the UK, Ireland, and Norway. While recent economic growth has slowed the outflow, the demographic damage has been done.
🇷🇴 Romania — -15% (22.4M → 19 Million)
Romania lost 3.4 million people since 2000. The country’s accession to the EU in 2007 accelerated an already-significant outward flow to Italy, Spain, Germany, and the UK. Romania’s healthcare system, already under strain, faces a particular crisis: an estimated 50,000 Romanian doctors and nurses have emigrated since 2007.
The Americas and Western Europe: Moderate Growth
🇺🇸 United States — +21% (282.2M → 340.1 Million)
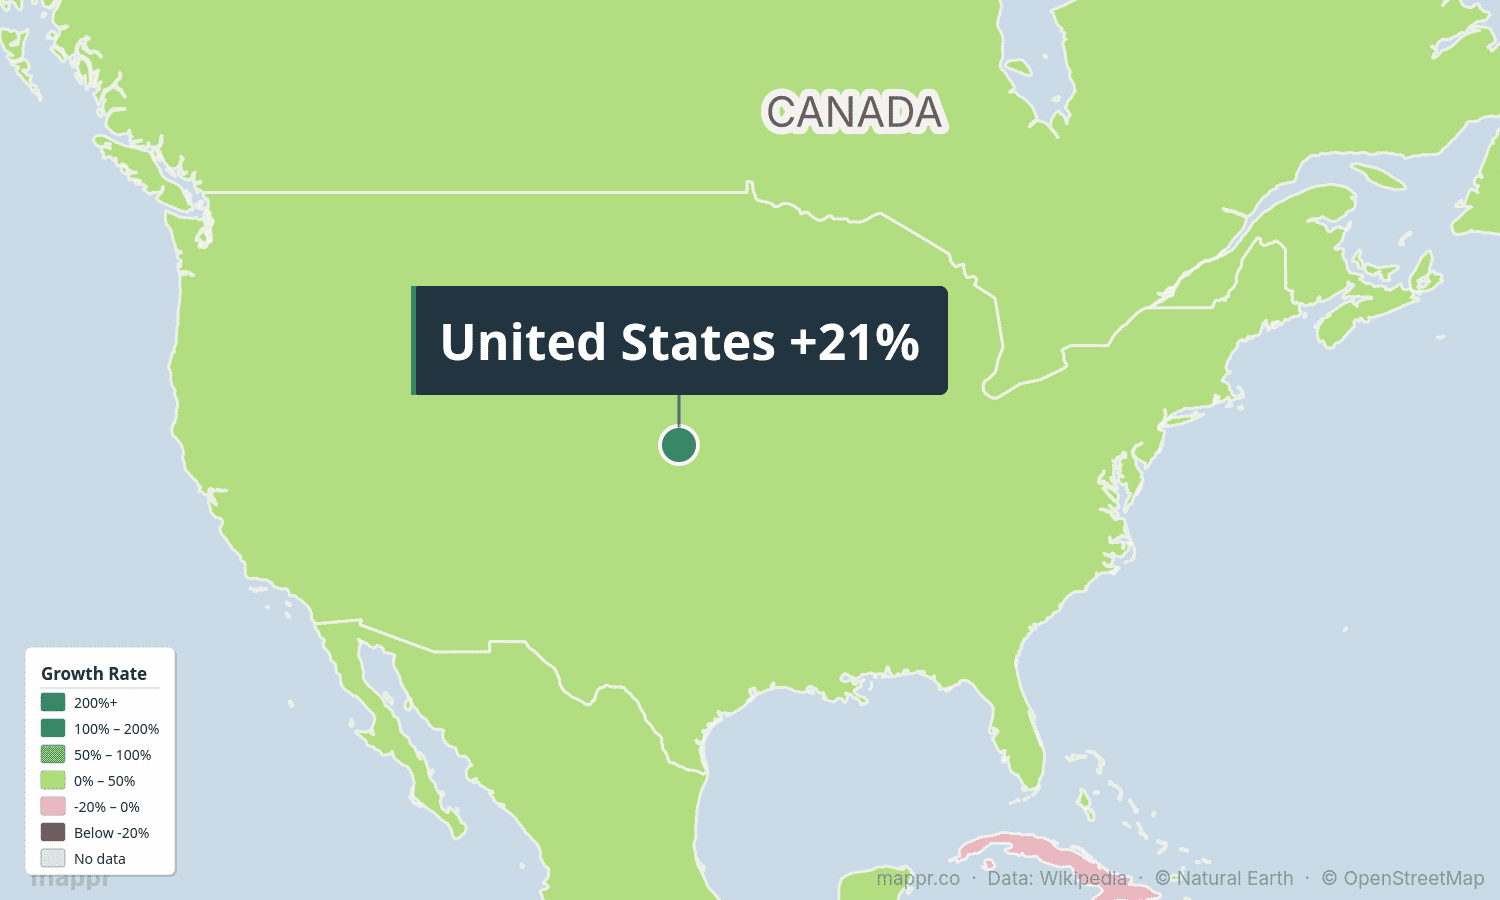
The United States added nearly 58 million people — the fifth largest absolute increase globally. Growth was driven primarily by immigration, which accounted for roughly half of all population gains. The U.S. birth rate has been declining steadily and hit a record low in 2023, meaning immigration is now the primary engine of American population growth.
🇩🇪 Germany — +2% (82.2M → 83.5 Million)
Germany barely grew despite having Europe’s largest economy. With a birth rate around 1.4 and one of Europe’s oldest populations, Germany’s slight growth is almost entirely attributable to immigration — including the surge during the 2015 refugee crisis and ongoing labor migration from Eastern Europe and beyond.
Global Population Growth: By the Numbers
Here’s how the world’s population shifted by region between 2000 and 2025:
- Africa: +76% (fastest-growing continent, 54 countries)
- Oceania: +54% (driven by Papua New Guinea and smaller Pacific nations)
- Asia: +27% (mixed — Gulf booms offset by Japan/China slowdowns)
- Americas: +25% (moderate, immigration-driven in North America)
- Europe: +2% (near-zero, severe declines in the East offset by modest Western gains)
The overall global population grew approximately 30% — from 6.1 billion to 8.0 billion. But growth rates have been slowing: the world added its sixth billion in 12 years (1987–1999), its seventh in 12 years (1999–2011), and its eighth in 11 years (2011–2022). The ninth billion is projected to take 14-15 years.
Why It Matters
Population growth isn’t just a number — it shapes economies, migration patterns, resource demand, geopolitical power, and climate change. Countries that doubled or tripled their populations face enormous pressure to build housing, schools, hospitals, and infrastructure. Meanwhile, shrinking nations face labor shortages, pension crises, and the slow erosion of rural communities.
The demographic divide between fast-growing Africa and shrinking Europe is likely to define 21st-century migration patterns, trade relationships, and geopolitical dynamics for decades to come. By 2050, one in four people on Earth will be African — up from about one in seven today.


Sources and data used in this article:
Data Sources:
- World Bank — Population, Total (SP.POP.TOTL) – Year 2000 and 2023-2024 population data for all countries
- UN Population Division — World Population Prospects 2024 – 2025 population estimates and projections by country
- REST Countries API – Current population figures, geographic coordinates, and country metadata
- The Peninsula Qatar — Qatar Population Increases by 2.3% in 2025 – Qatar end-of-year 2025 population figure of 3,214,609
Analysis and Context:
- Visual Capitalist — Mapped: Population Growth by Country (2000-2025) – Comparative analysis of population growth rates by country
- UN DESA — India Surpasses China as World's Most Populous Country – UN confirmation of India surpassing China in April 2023
- UNHCR — Ukraine Refugee Situation – Data on Ukrainian displacement since February 2022
Featured image generated with AI. Maps: mappr.co. All population figures are estimates based on the most recent available data from the World Bank and UN Population Division.
Image Sources and Copyright Information
- Population Growth By Country: Map: mappr.co | Data: World Bank, UN Population Division