Key Takeaways
- The global average hit a new low of 42. In the 2025 Corruption Perceptions Index, the world average slipped to 42 out of 100 — its lowest ever — with more than two-thirds of the 182 countries scoring below 50.
- A clean north, a struggling middle. Western Europe averages 64; Sub-Saharan Africa just 32. Denmark (89) is the world's cleanest country; Somalia and South Sudan (both 9) are the most corrupt.
- Leadership is faltering. Transparency International's headline finding is a long-term decline in the political leadership to fight corruption — even in established democracies. The number of countries scoring above 80 has fallen from 12 a decade ago to just five.
- Corruption tracks conflict and authoritarianism. The lowest scorers are war-torn or authoritarian states — Venezuela, Libya, Yemen, Sudan, North Korea. The cleanest are stable, high-trust democracies with strong institutions.
- 0 = highly corrupt, 100 = very clean. The CPI aggregates 13 expert assessments and business surveys of perceived public-sector corruption. It measures perceptions, not a direct count of bribes.
Transparency International released its 2025 Corruption Perceptions Index (CPI) in February 2026, and the headline is grim: the global average score fell to 42 out of 100 — a new low. More than two-thirds of the 182 countries and territories assessed score below 50, the threshold the organisation treats as a serious corruption problem.
Transparency International pins the slide on a long-term decline in leadership to tackle graft. “The absence of bold leadership is leading to weaker standards and enforcement,” the group warned — and the slippage now reaches even established democracies. We mapped every country’s score below.
The World’s Corruption Map in 2025
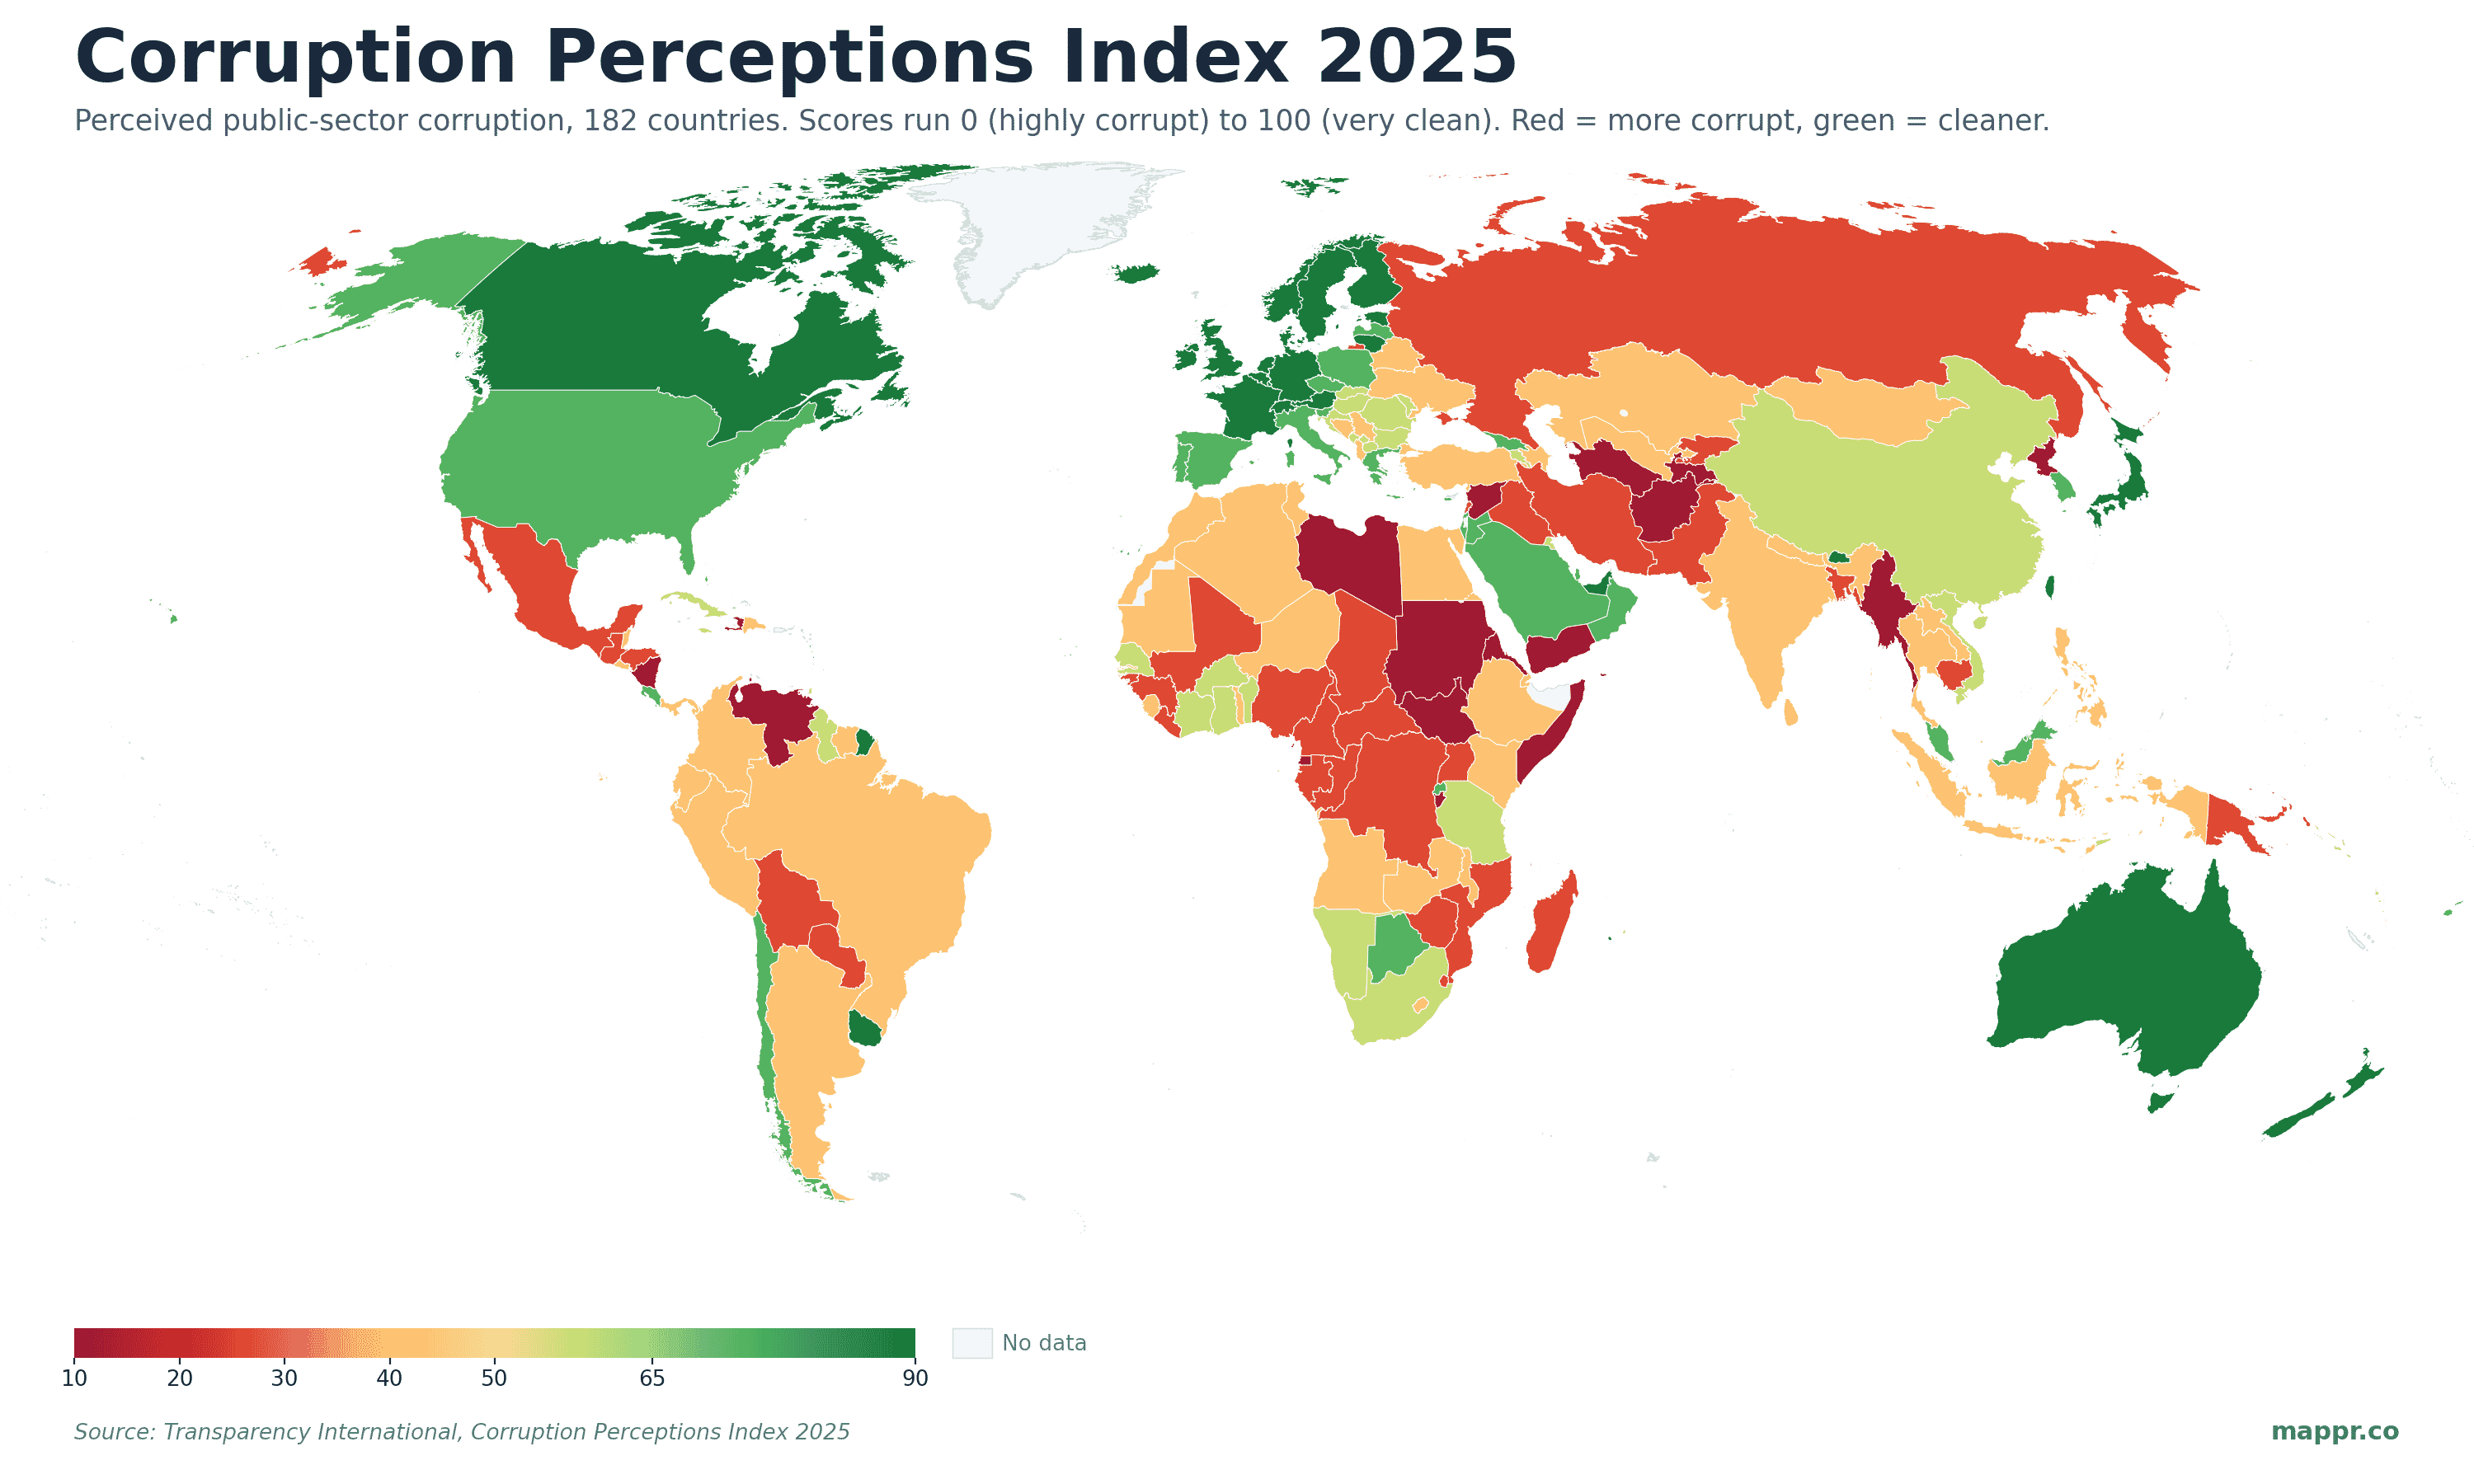
The pattern is stark. A band of deep green runs across Northern and Western Europe, Canada, Australia, New Zealand and Singapore — the world’s cleanest public sectors. Most of the map, though, is amber to red: large stretches of Sub-Saharan Africa, Central Asia, the Middle East and parts of Latin America score below 40.
What the Corruption Perceptions Index Actually Measures
The CPI scores each country from 0 (highly corrupt) to 100 (very clean) based on perceived public-sector corruption — bribery, diversion of public funds, officials using public office for private gain, and the strength of anti-corruption enforcement. Each score blends up to 13 independent data sources from institutions like the World Bank, the World Economic Forum and the Economist Intelligence Unit.
Two caveats matter. The index captures the public sector only, not private-sector fraud or the everyday bribery citizens experience. And because it measures perceptions by experts and business people, it moves slowly — a single year’s shift of a point or two is rarely decisive, but a sustained multi-year drift, like the one we are now seeing, is.
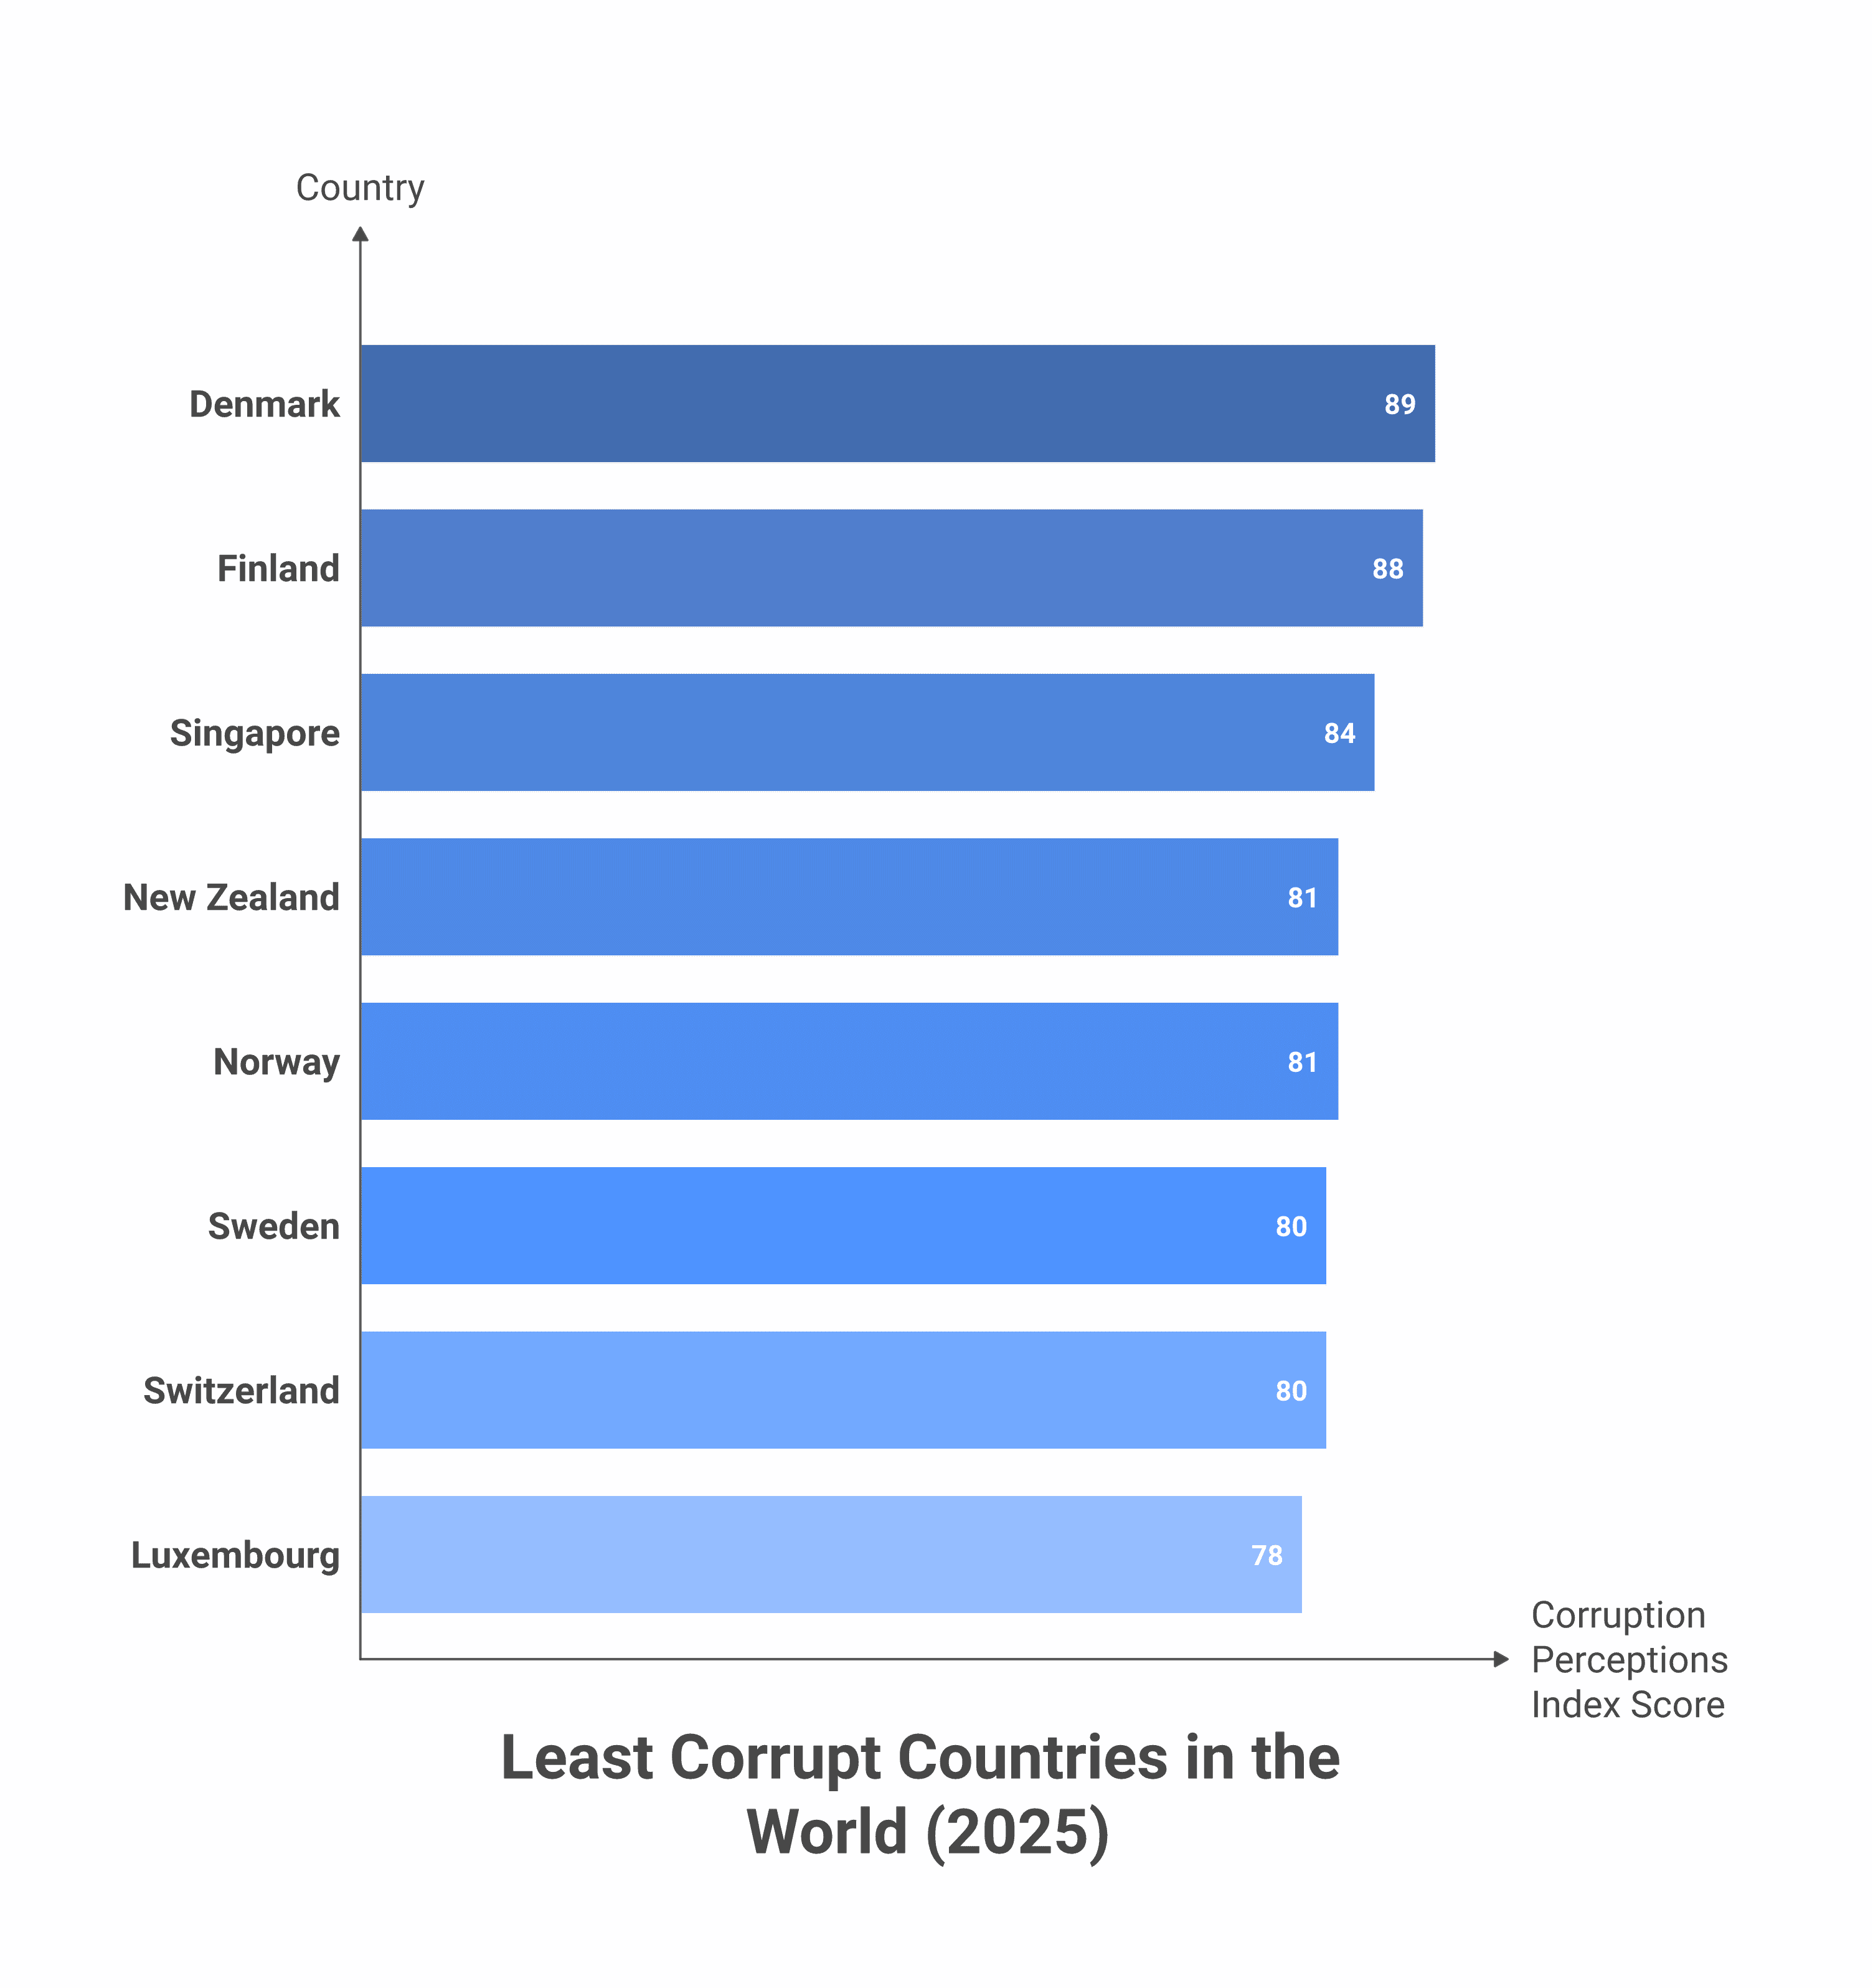
The Least Corrupt Countries
For yet another year, Denmark tops the index at 89, ahead of Finland (88) and Singapore (84). Western Europe dominates — eight of the ten cleanest countries are Western European, the exceptions being Singapore and New Zealand. These are stable, high-income democracies with strong courts, free media and robust anti-corruption institutions.
| Rank | Country | CPI 2025 score |
|---|---|---|
| 1 | 🇩🇰 Denmark | 89 |
| 2 | 🇫🇮 Finland | 88 |
| 3 | 🇸🇬 Singapore | 84 |
| 4 | 🇳🇿 New Zealand | 81 |
| 4 | 🇳🇴 Norway | 81 |
| 6 | 🇸🇪 Sweden | 80 |
| 6 | 🇨🇭 Switzerland | 80 |
| 8 | 🇱🇺 Luxembourg | 78 |
| 8 | 🇳🇱 Netherlands | 78 |
| 10 | 🇩🇪 Germany | 77 |
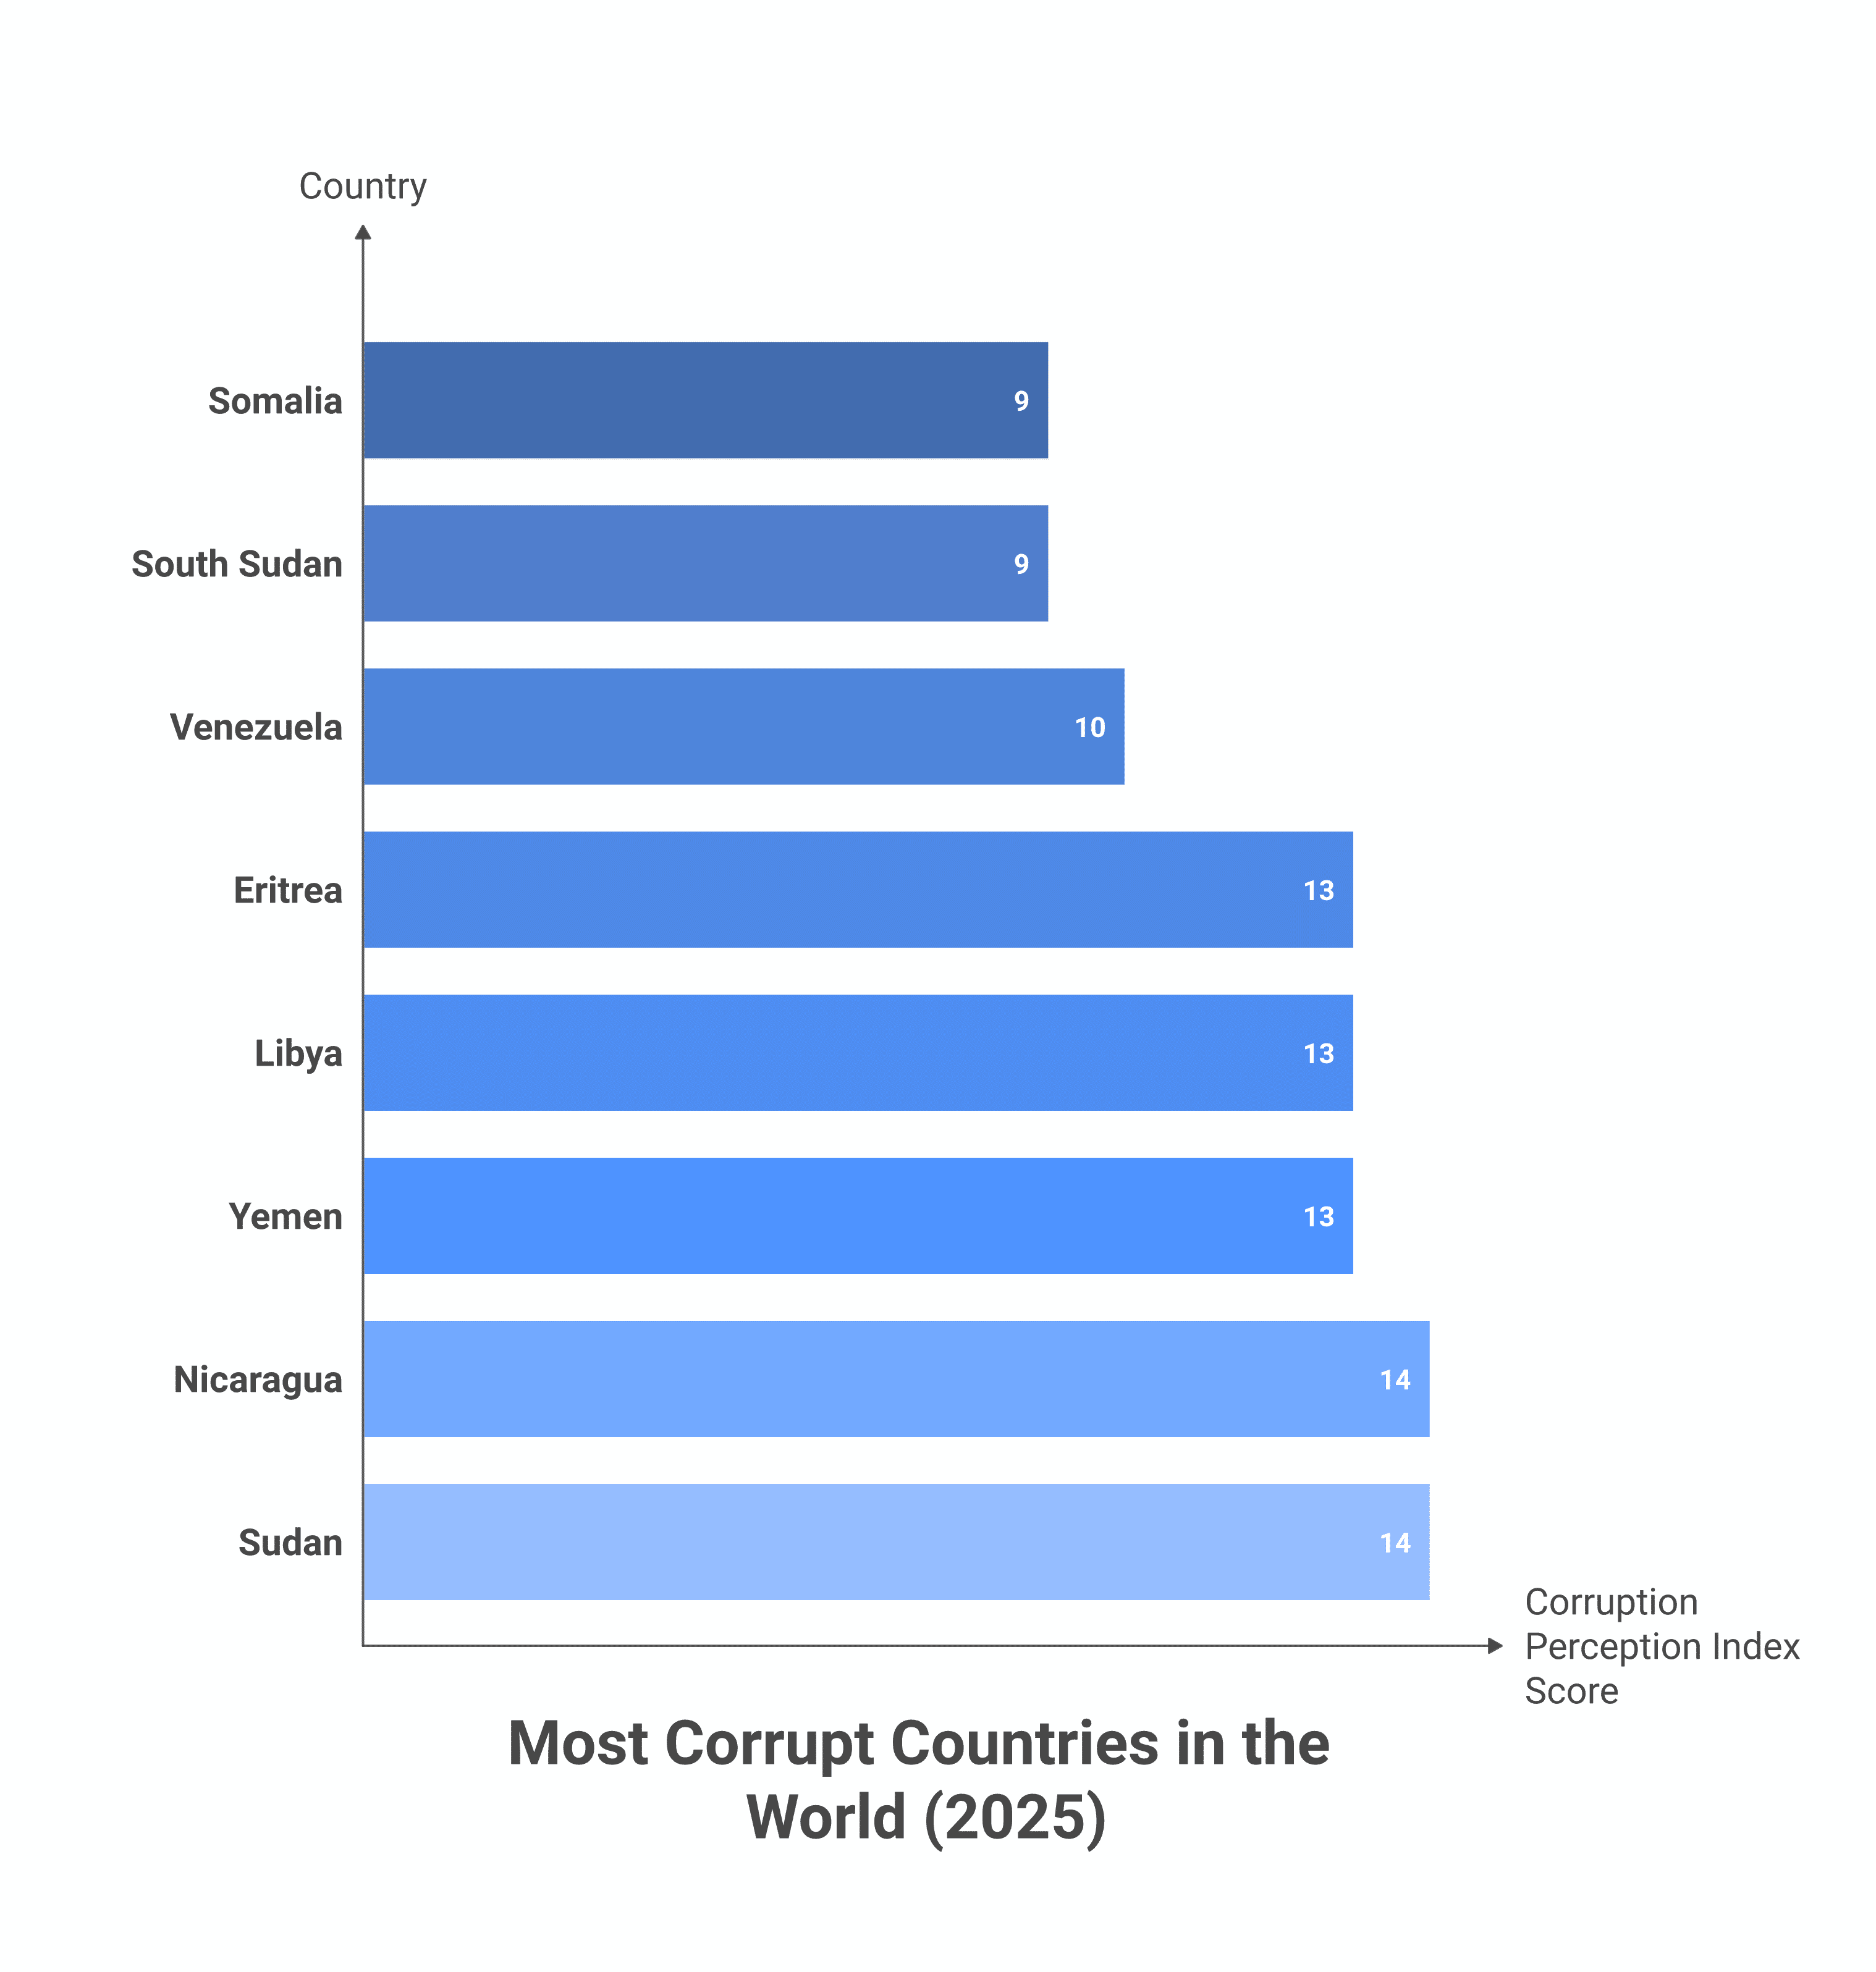
The Most Corrupt Countries
At the bottom sit states defined by conflict and authoritarian rule. Somalia and South Sudan are tied as the world’s most corrupt, each scoring just 9, followed by Venezuela at 10. Eritrea, Libya and Yemen share 13; Nicaragua and Sudan, 14. Where institutions have collapsed or power is unchecked, public-sector corruption runs nearly unchallenged.
| Rank | Country | CPI 2025 score |
|---|---|---|
| 181 | 🇸🇴 Somalia | 9 |
| 181 | 🇸🇸 South Sudan | 9 |
| 180 | 🇻🇪 Venezuela | 10 |
| 177 | 🇪🇷 Eritrea | 13 |
| 177 | 🇱🇾 Libya | 13 |
| 177 | 🇾🇪 Yemen | 13 |
| 175 | 🇳🇮 Nicaragua | 14 |
| 175 | 🇸🇩 Sudan | 14 |
| 172 | 🇬🇶 Equatorial Guinea | 15 |
| 172 | 🇰🇵 North Korea | 15 |
A Decade of Decline — and a Leadership Vacuum
The 2025 edition’s central message is not about any single country, but about momentum. The global average has now drifted down to 42 from 43 a year earlier, and the elite tier is thinning: the number of countries scoring above 80 has collapsed from 12 a decade ago to just five today.
Crucially, the decline has reached the established democracies that once set the standard. The United States scores just 64 and has fallen to 29th place; the United Kingdom (70) and even perennial top-five performer New Zealand (81) have slipped from their own past highs. Transparency International argues that as wealthy democracies weaken their own anti-corruption enforcement and pull back from global leadership, they lower the bar for everyone.
Corruption by Region
The regional averages tell the geography of the problem. Western Europe and the EU lead at 64, but it is also the region whose average has been slipping fastest as complacency sets in. At the other end, Sub-Saharan Africa (32) and Eastern Europe & Central Asia (34) — where weak institutions and entrenched power dominate — anchor the bottom of the table.
| Region | Avg CPI 2025 | Avg CPI 2024 |
|---|---|---|
| Western Europe & EU | 64 | 64 |
| Asia-Pacific | 45 | 44 |
| Americas | 42 | 42 |
| Middle East & North Africa | 39 | 39 |
| Eastern Europe & Central Asia | 34 | 35 |
| Sub-Saharan Africa | 32 | 33 |
| World | 42 | 43 |
Why It Matters
Corruption is rarely a standalone problem. It drains public budgets, deters investment, deepens inequality and erodes the trust that holds societies together — and it correlates tightly with weaker democracy and lower prosperity. Countries near the bottom of this map tend to score poorly on political freedom and prosperity too; the cleanest tend to be the most free and the most prosperous. As anti-corruption leadership fades, the worry is not just more graft, but the slow weakening of the institutions that keep it in check.
Data sources and image credits for this map.
Image Sources
- Featured photo (cash in an envelope) — Defrino Maasy via Unsplash – Symbolizing bribery and public-sector corruption.