Key Takeaways
- About 1.16 million people died on the world's roads in 2025. That is more than 3,000 deaths a day, according to WHO, and road crashes remain the leading cause of death for children and young people aged 5 to 29.
- Roads are slowly getting safer. The global death rate fell 21% between 2011 and 2025 even as more than a billion vehicles were added. In WHO's country estimates, 137 of 185 countries saw their rate fall between 2010 and 2023.
- Africa has the deadliest roads, Europe the safest. WHO's African Region averages 19.3 deaths per 100,000 people against 6.5 in Europe. Africa is the only region where the number of road deaths is still rising, up 17%, as fast population growth outpaces a falling death rate.
- From 54 per 100,000 to under 1. North Korea (54.0), Haiti (41.8) and Ghana (36.6) have the highest estimated rates. The Maldives (0.9), Singapore (1.4) and Norway (2.0) have the lowest.
Every year, roughly 1.16 million people are killed in road crashes, and somewhere between 20 and 50 million more are injured. On Sunday 15 November 2026, the World Day of Remembrance for Road Traffic Victims marks those losses, as it has on the third Sunday of November since the UN endorsed the day in 2005.
Where you live makes an enormous difference to your odds. We mapped WHO’s latest country estimates of the road traffic death rate per 100,000 people for 185 countries, and how that rate has changed since 2010.
The Map: Road Death Rates by Country
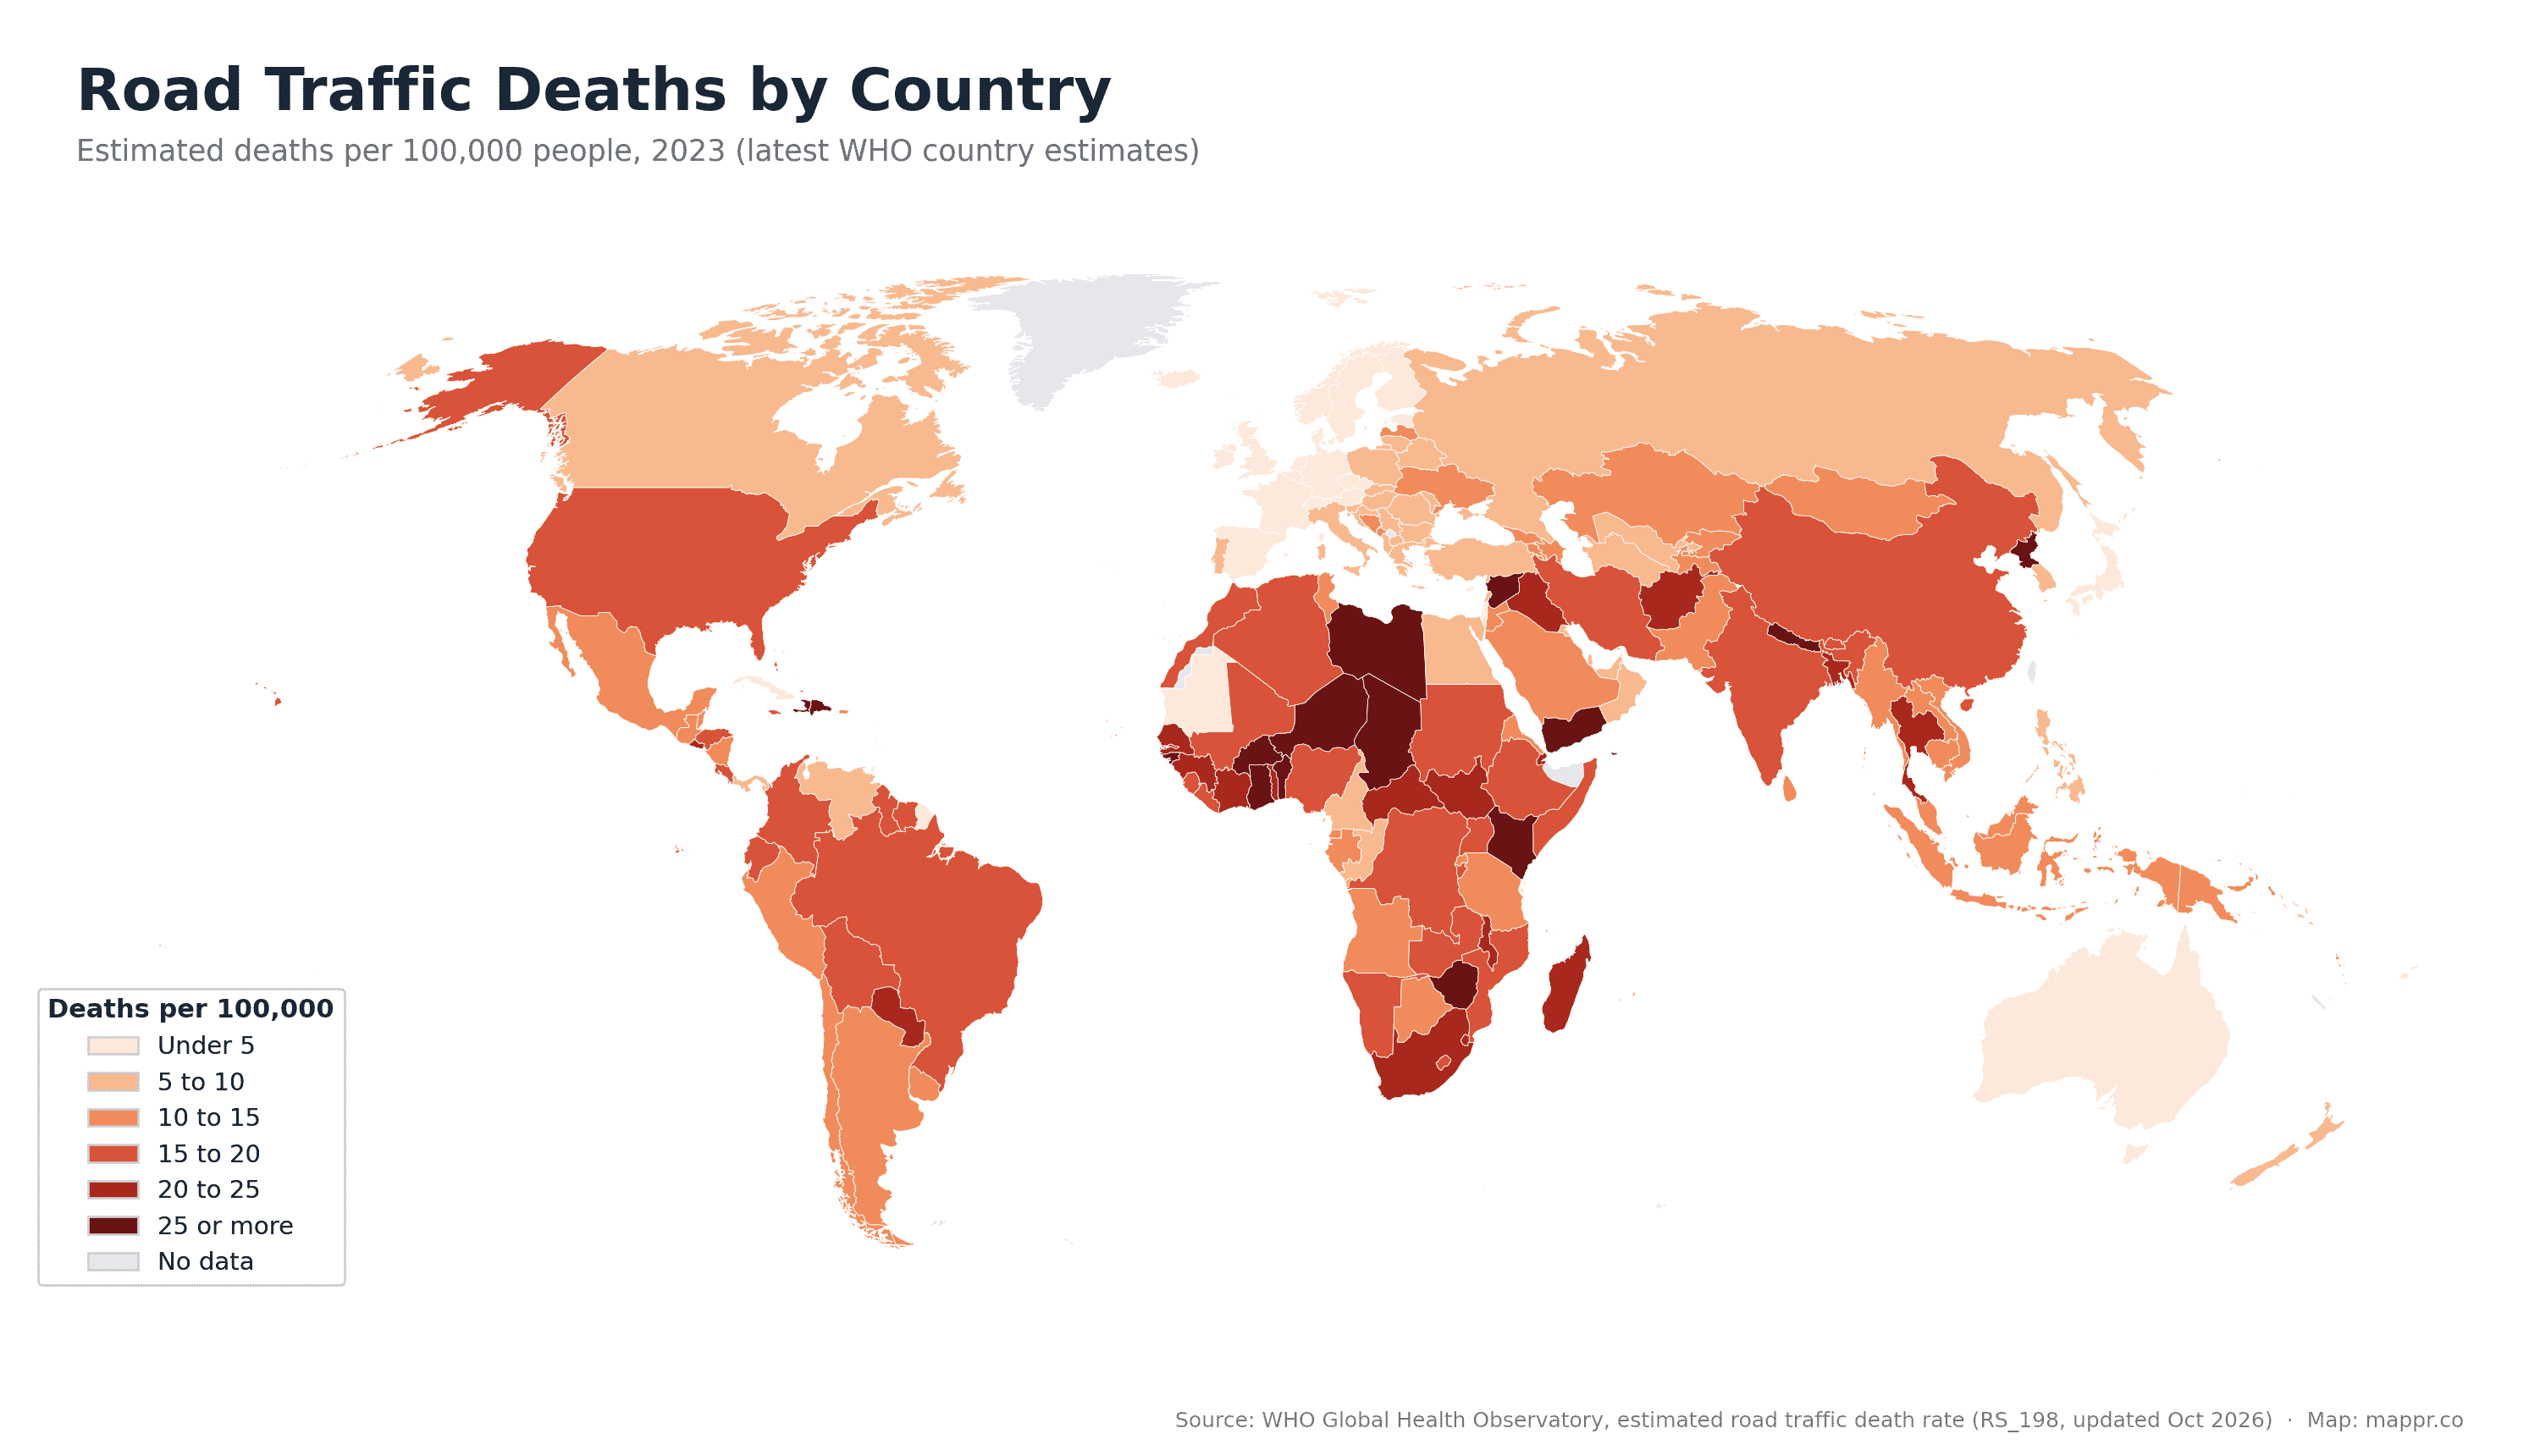
The pattern is stark. Sub-Saharan Africa forms an almost unbroken band of high rates, joined by North Korea, Haiti, Nepal, Yemen and Syria. At the other end, Western Europe, Japan, Singapore and Australia are in the lightest shades, most of them under 5 deaths per 100,000.
The global median is about 11.5 deaths per 100,000. A person in North Korea is roughly 27 times more likely to die on the road than someone in Norway.
The Deadliest Roads in the World
Highest rates
15 Countries With the Deadliest Roads
Estimated road traffic deaths per 100,000 people
| Country | Deaths per 100k (2023) | 2010 | Change since 2010 |
|---|---|---|---|
| 1. 🇰🇵 North Korea | 54.0 | 33.5 | ▲ 61% |
| 2. 🇭🇹 Haiti | 41.8 | 22.4 | ▲ 87% |
| 3. 🇬🇭 Ghana | 36.6 | 21.5 | ▲ 70% |
| 4. 🇳🇵 Nepal | 36.2 | 25.0 | ▲ 45% |
| 5. 🇫🇲 Micronesia | 36.0 | 3.1 | ▲ 1061% |
| 6. 🇰🇪 Kenya | 35.0 | 23.9 | ▲ 46% |
| 7. 🇱🇾 Libya | 33.3 | 39.7 | ▼ 16% |
| 8. 🇧🇫 Burkina Faso | 31.7 | 22.7 | ▲ 40% |
| 9. 🇸🇾 Syria | 31.7 | 17.4 | ▲ 82% |
| 10. 🇩🇴 Dominican Republic | 30.8 | 23.0 | ▲ 34% |
| 11. 🇾🇪 Yemen | 29.6 | 25.4 | ▲ 17% |
| 12. 🇿🇼 Zimbabwe | 29.5 | 25.9 | ▲ 14% |
| 13. 🇬🇼 Guinea-Bissau | 28.6 | 30.6 | ▼ 7% |
| 14. 🇳🇪 Niger | 27.9 | 23.4 | ▲ 19% |
| 15. 🇰🇲 Comoros | 27.8 | 21.0 | ▲ 32% |
North Korea tops the ranking at an estimated 54 deaths per 100,000, though WHO’s figure for the country is a modelled estimate with little underlying data. Among countries with fuller reporting, Haiti, Ghana, Nepal and Kenya stand out, all above 35.
Libya, often cited as the world’s deadliest road nation, sits at 33.3 in the latest estimates. That is still extreme, but well below the figures above 70 that circulate from older reports, and its rate has fallen since 2010.
A caveat on Micronesia: with a population of about 100,000, a handful of crashes can swing its rate dramatically. Its jump from 3.1 to 36.0 per 100,000 should be read with that in mind.
The Safest Roads in the World
Lowest rates
10 Countries With the Safest Roads
Estimated road traffic deaths per 100,000 people
| Country | Deaths per 100k (2023) | 2010 | Change since 2010 |
|---|---|---|---|
| 185. 🇲🇻 Maldives | 0.9 | 3.6 | ▼ 75% |
| 184. 🇸🇬 Singapore | 1.4 | 5.3 | ▼ 74% |
| 183. 🇳🇴 Norway | 2.0 | 4.4 | ▼ 55% |
| 182. 🇮🇸 Iceland | 2.2 | 2.5 | ▼ 12% |
| 181. 🇸🇪 Sweden | 2.2 | 3.0 | ▼ 27% |
| 180. 🇬🇧 United Kingdom | 2.5 | 3.7 | ▼ 32% |
| 179. 🇯🇵 Japan | 2.7 | 5.2 | ▼ 48% |
| 178. 🇨🇭 Switzerland | 2.7 | 4.3 | ▼ 37% |
| 177. 🇩🇰 Denmark | 2.8 | 4.9 | ▼ 43% |
| 176. 🇧🇳 Brunei | 2.9 | 8.9 | ▼ 67% |
The safest roads belong mostly to wealthy, compact or island nations. Singapore and Norway have both cut their rates by more than half since 2010. Sweden, the birthplace of the ‘Vision Zero’ approach, and the United Kingdom sit at around 2 to 2.5 deaths per 100,000.
Where Roads Got Safer, and Where They Didn’t
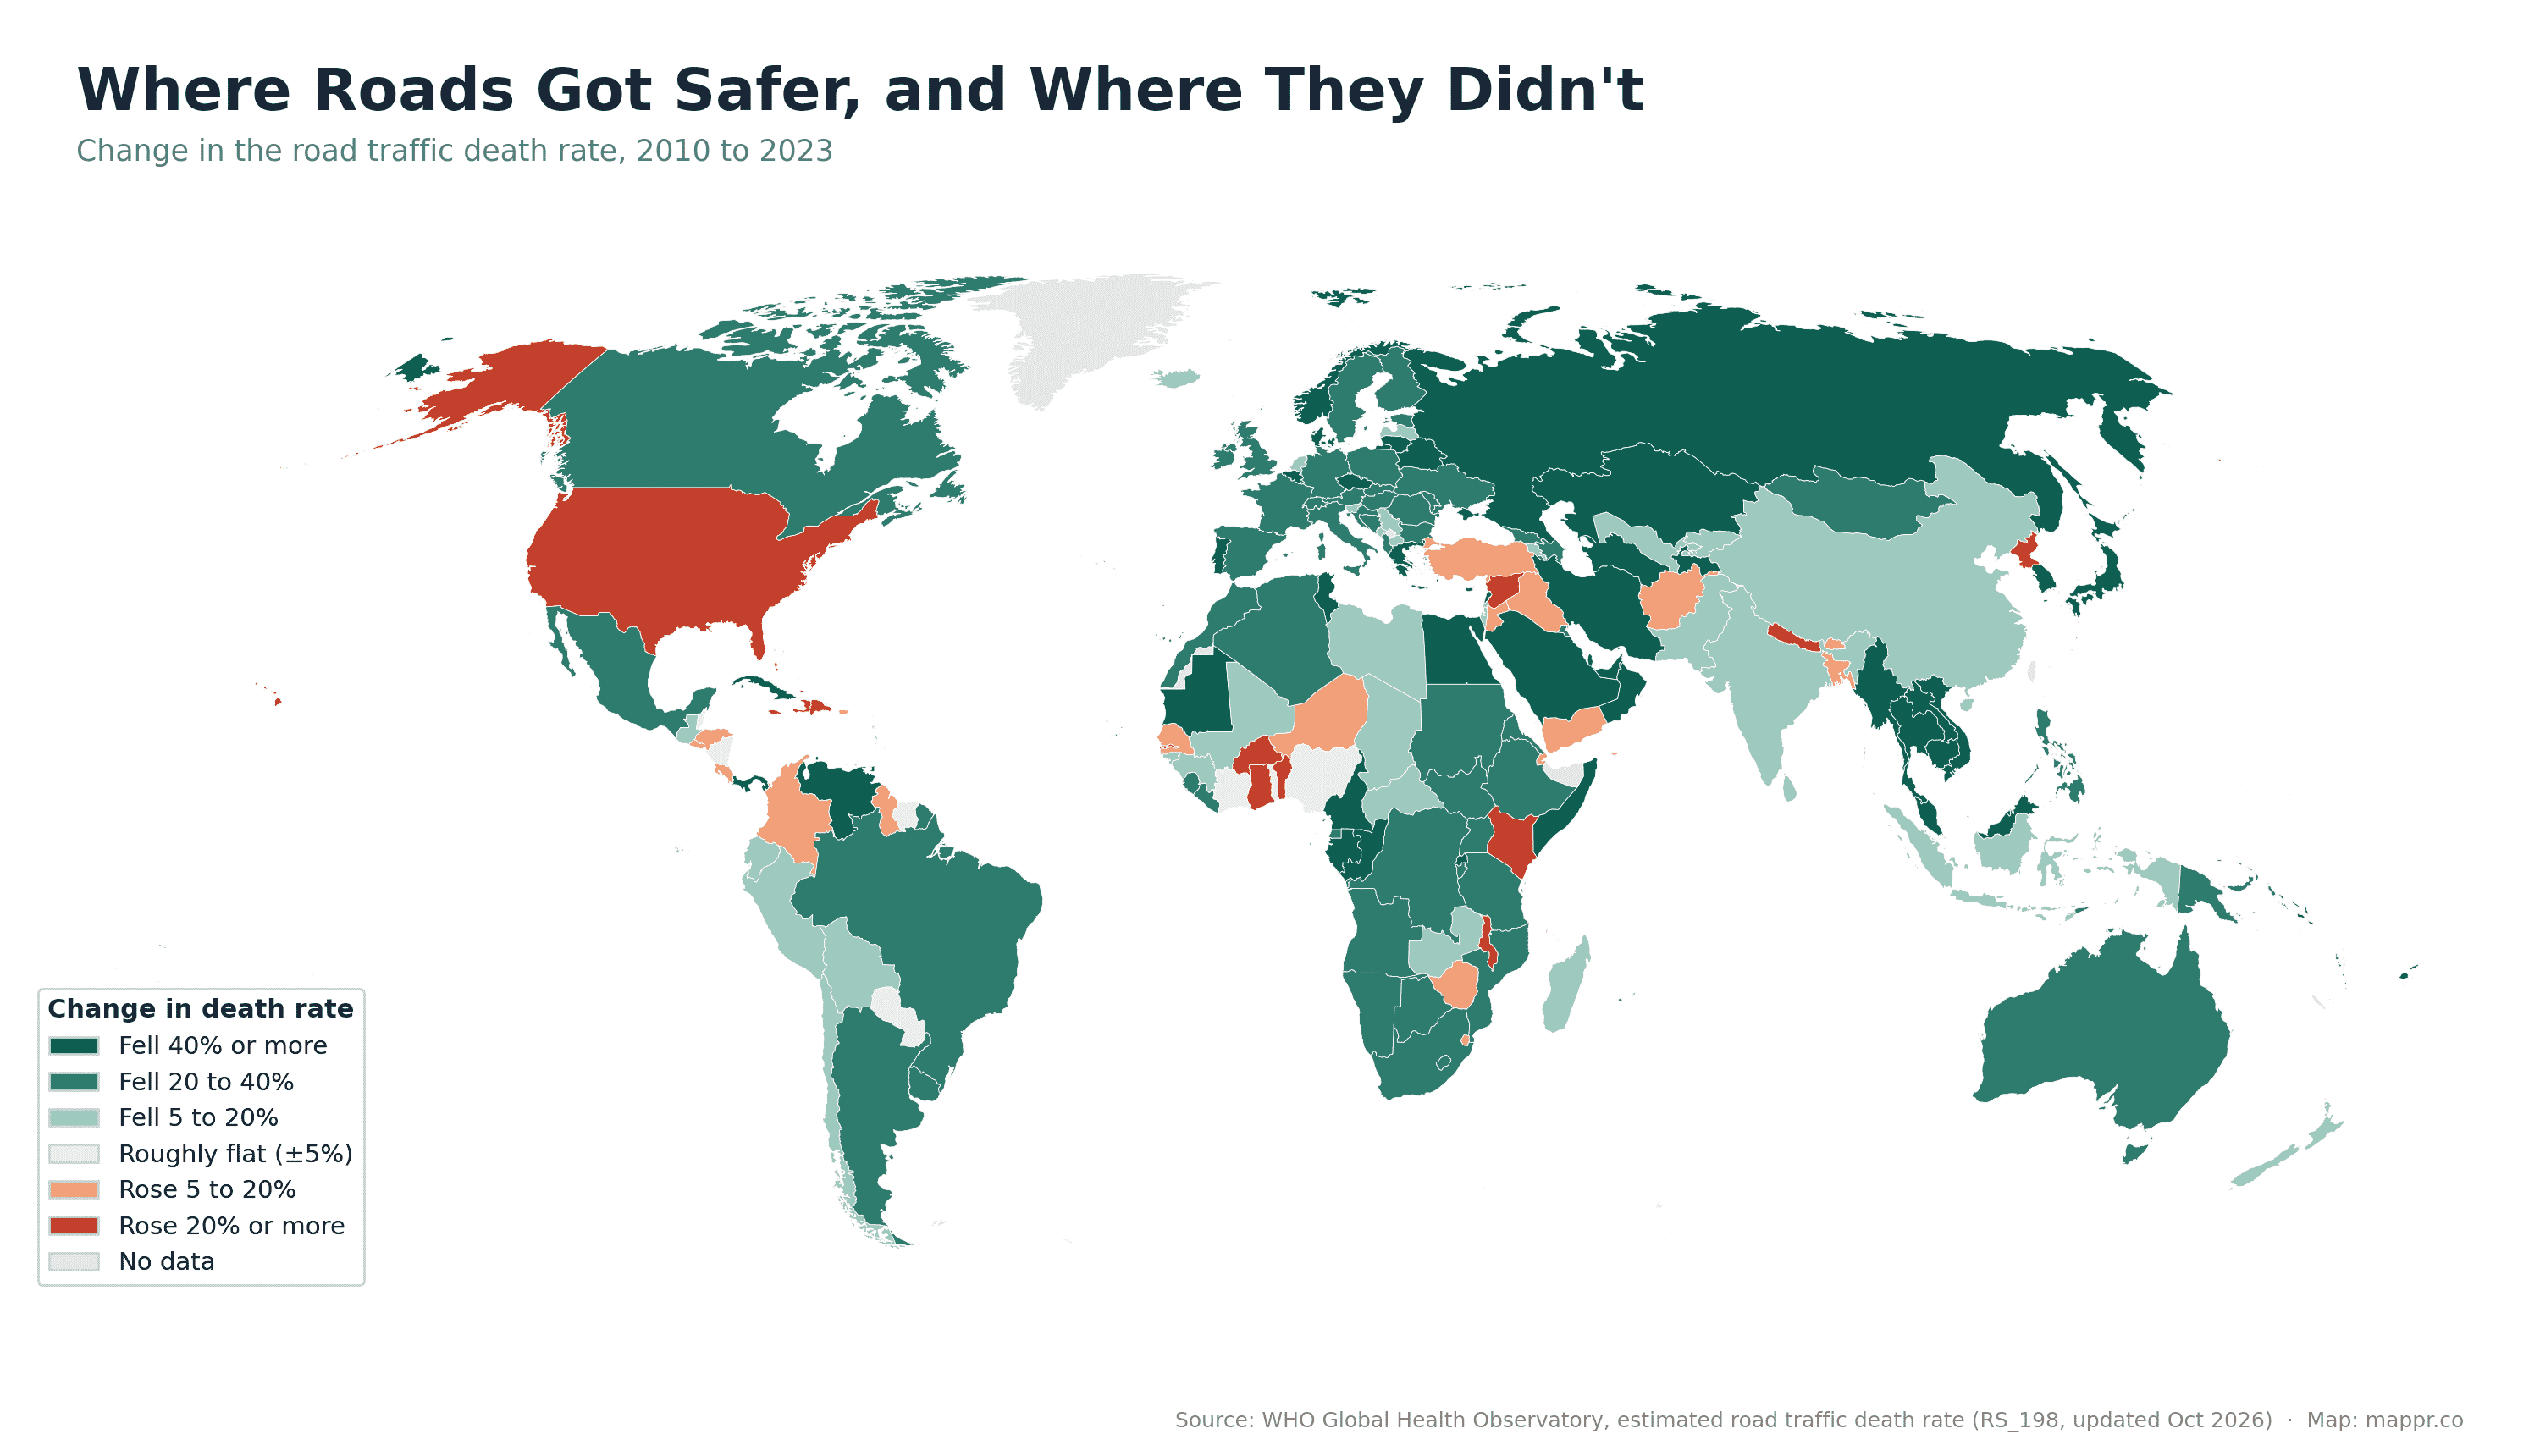
The second map is the hopeful one. Most of the world is green: 137 of 185 countries lowered their road death rate between 2010 and 2023, and WHO says 10 countries halved their road deaths in the decade to 2021.
Some of the biggest improvements came in fast-growing middle-income countries. Russia’s rate fell from 22.6 to 8.1, Vietnam’s from 33.4 to 12.9 and Thailand’s from 45.8 to 21.9. Saudi Arabia more than halved its rate, from 32.3 to 14.7.
The red patches tell a different story. Haiti, Ghana and Syria have all seen their rates climb sharply. So has the United States, one of very few rich countries going the wrong way: WHO estimates its rate at 18.4 in 2023, while the country’s own NHTSA data, based on police-reported deaths, puts it at about 12.2 (roughly 41,000 deaths). Both measures show the US doing worse than in 2010, while most other high-income countries improved.
The Regional Picture
By WHO region
Road Death Rates by Region
Estimated deaths per 100,000 people
| WHO region | 2023 | 2010 | Change |
|---|---|---|---|
| Africa | 19.3 | 22.2 | ▼ 13% |
| Eastern Mediterranean | 15.3 | 20.1 | ▼ 24% |
| South-East Asia | 17.6 | 19.2 | ▼ 8% |
| Americas | 15.3 | 15.6 | ■ -2% |
| Western Pacific | 14.4 | 18.6 | ▼ 23% |
| Europe | 6.5 | 10.9 | ▼ 40% |
| World | 15.2 | 17.9 | ▼ 15% |
Europe has made the most progress, cutting its rate by about 40% since 2010 to 6.5 per 100,000. Africa remains the deadliest region at 19.3.
Africa’s rate is actually falling. But its population is growing so fast that the number of people killed keeps rising, up 17% according to WHO, making it the only region where road deaths are increasing. The Americas have seen no improvement in their rate at all.
Who Dies on the World’s Roads
More than half of all road deaths are people outside cars: pedestrians, cyclists and motorcyclists. Motorcyclists alone account for nearly a third, and the number of motorcycles on the world’s roads more than tripled between 2011 and 2025.
Deaths are heavily concentrated in poorer countries. Low- and middle-income countries have around 60% of the world’s vehicles but 92% of its road deaths. China and India alone accounted for about 39% of all road deaths in 2021, with an estimated 248,000 and 206,000 deaths respectively.
Men are about three times as likely as women to be killed, and two-thirds of victims are of working age (18 to 59). WHO estimates that road crashes cost most countries about 3% of GDP.
Halving Road Deaths by 2030
The UN’s target is to halve road deaths and serious injuries by 2030, compared with 2021 levels. At the current pace the world will miss it by a wide margin, even though the tools are well known: lower urban speed limits, safe helmets (which cut a motorcyclist’s risk of death by more than six times), seat belts, drink-driving enforcement, and roads designed to protect pedestrians and cyclists.
As WHO Director-General Tedros Adhanom Ghebreyesus put it in July 2026: “All road deaths are preventable and none are acceptable.”
About the Data
The maps and tables use WHO’s estimated road traffic death rate (indicator RS_198), the latest country series updated in October 2026, with 2023 as the most recent year. WHO models these figures to correct for under-reporting, so they often differ from official national statistics, sometimes substantially. The global total for 2025 comes from WHO’s July 2026 road safety update.
Sources: