Key Takeaways
- One country dominates the all-time toll: Indonesia. NOAA's 4,100-year database records about 226,000 tsunami deaths in Indonesia, almost all from the 2004 Indian Ocean disaster. Japan is second with roughly 153,000 across many events over centuries.
- The deaths trace the Pacific Ring of Fire, plus one ocean. Japan, Indonesia, Chile, Russia's Kamchatka, Peru and the Philippines line the Ring of Fire. The 2004 event adds Sri Lanka, India and Thailand around the Indian Ocean.
- World Tsunami Awareness Day is 5 November. The UN created the day in 2015 to push early-warning systems and coastal preparedness. The date marks a 1854 Japanese tsunami and the 'inamura-no-hi' story of a villager who torched his rice harvest to warn others.
- History concentrates the risk, but it is not fixed. More than 600,000 recorded deaths cluster on a handful of coasts, yet every one of them was a quiet coast until the wave arrived. That is the whole case for warning systems.
Thursday, 5 November, is World Tsunami Awareness Day. It is a good moment to step back from any single disaster and ask the structural question: across all of recorded history, where have tsunamis actually killed people?
We pulled NOAA’s Global Historical Tsunami Database, which runs from 2100 BC to the present, and mapped it two ways: total deaths by country, and the sheer number of times a tsunami wave has been documented hitting each coast. The two maps tell slightly different stories.
The Map: Where Tsunamis Have Killed
The hero map counts tsunami-specific deaths, the lives taken by the wave itself, not by the earthquake that triggered it. Across the full record, that is more than 600,000 people in 63 countries.
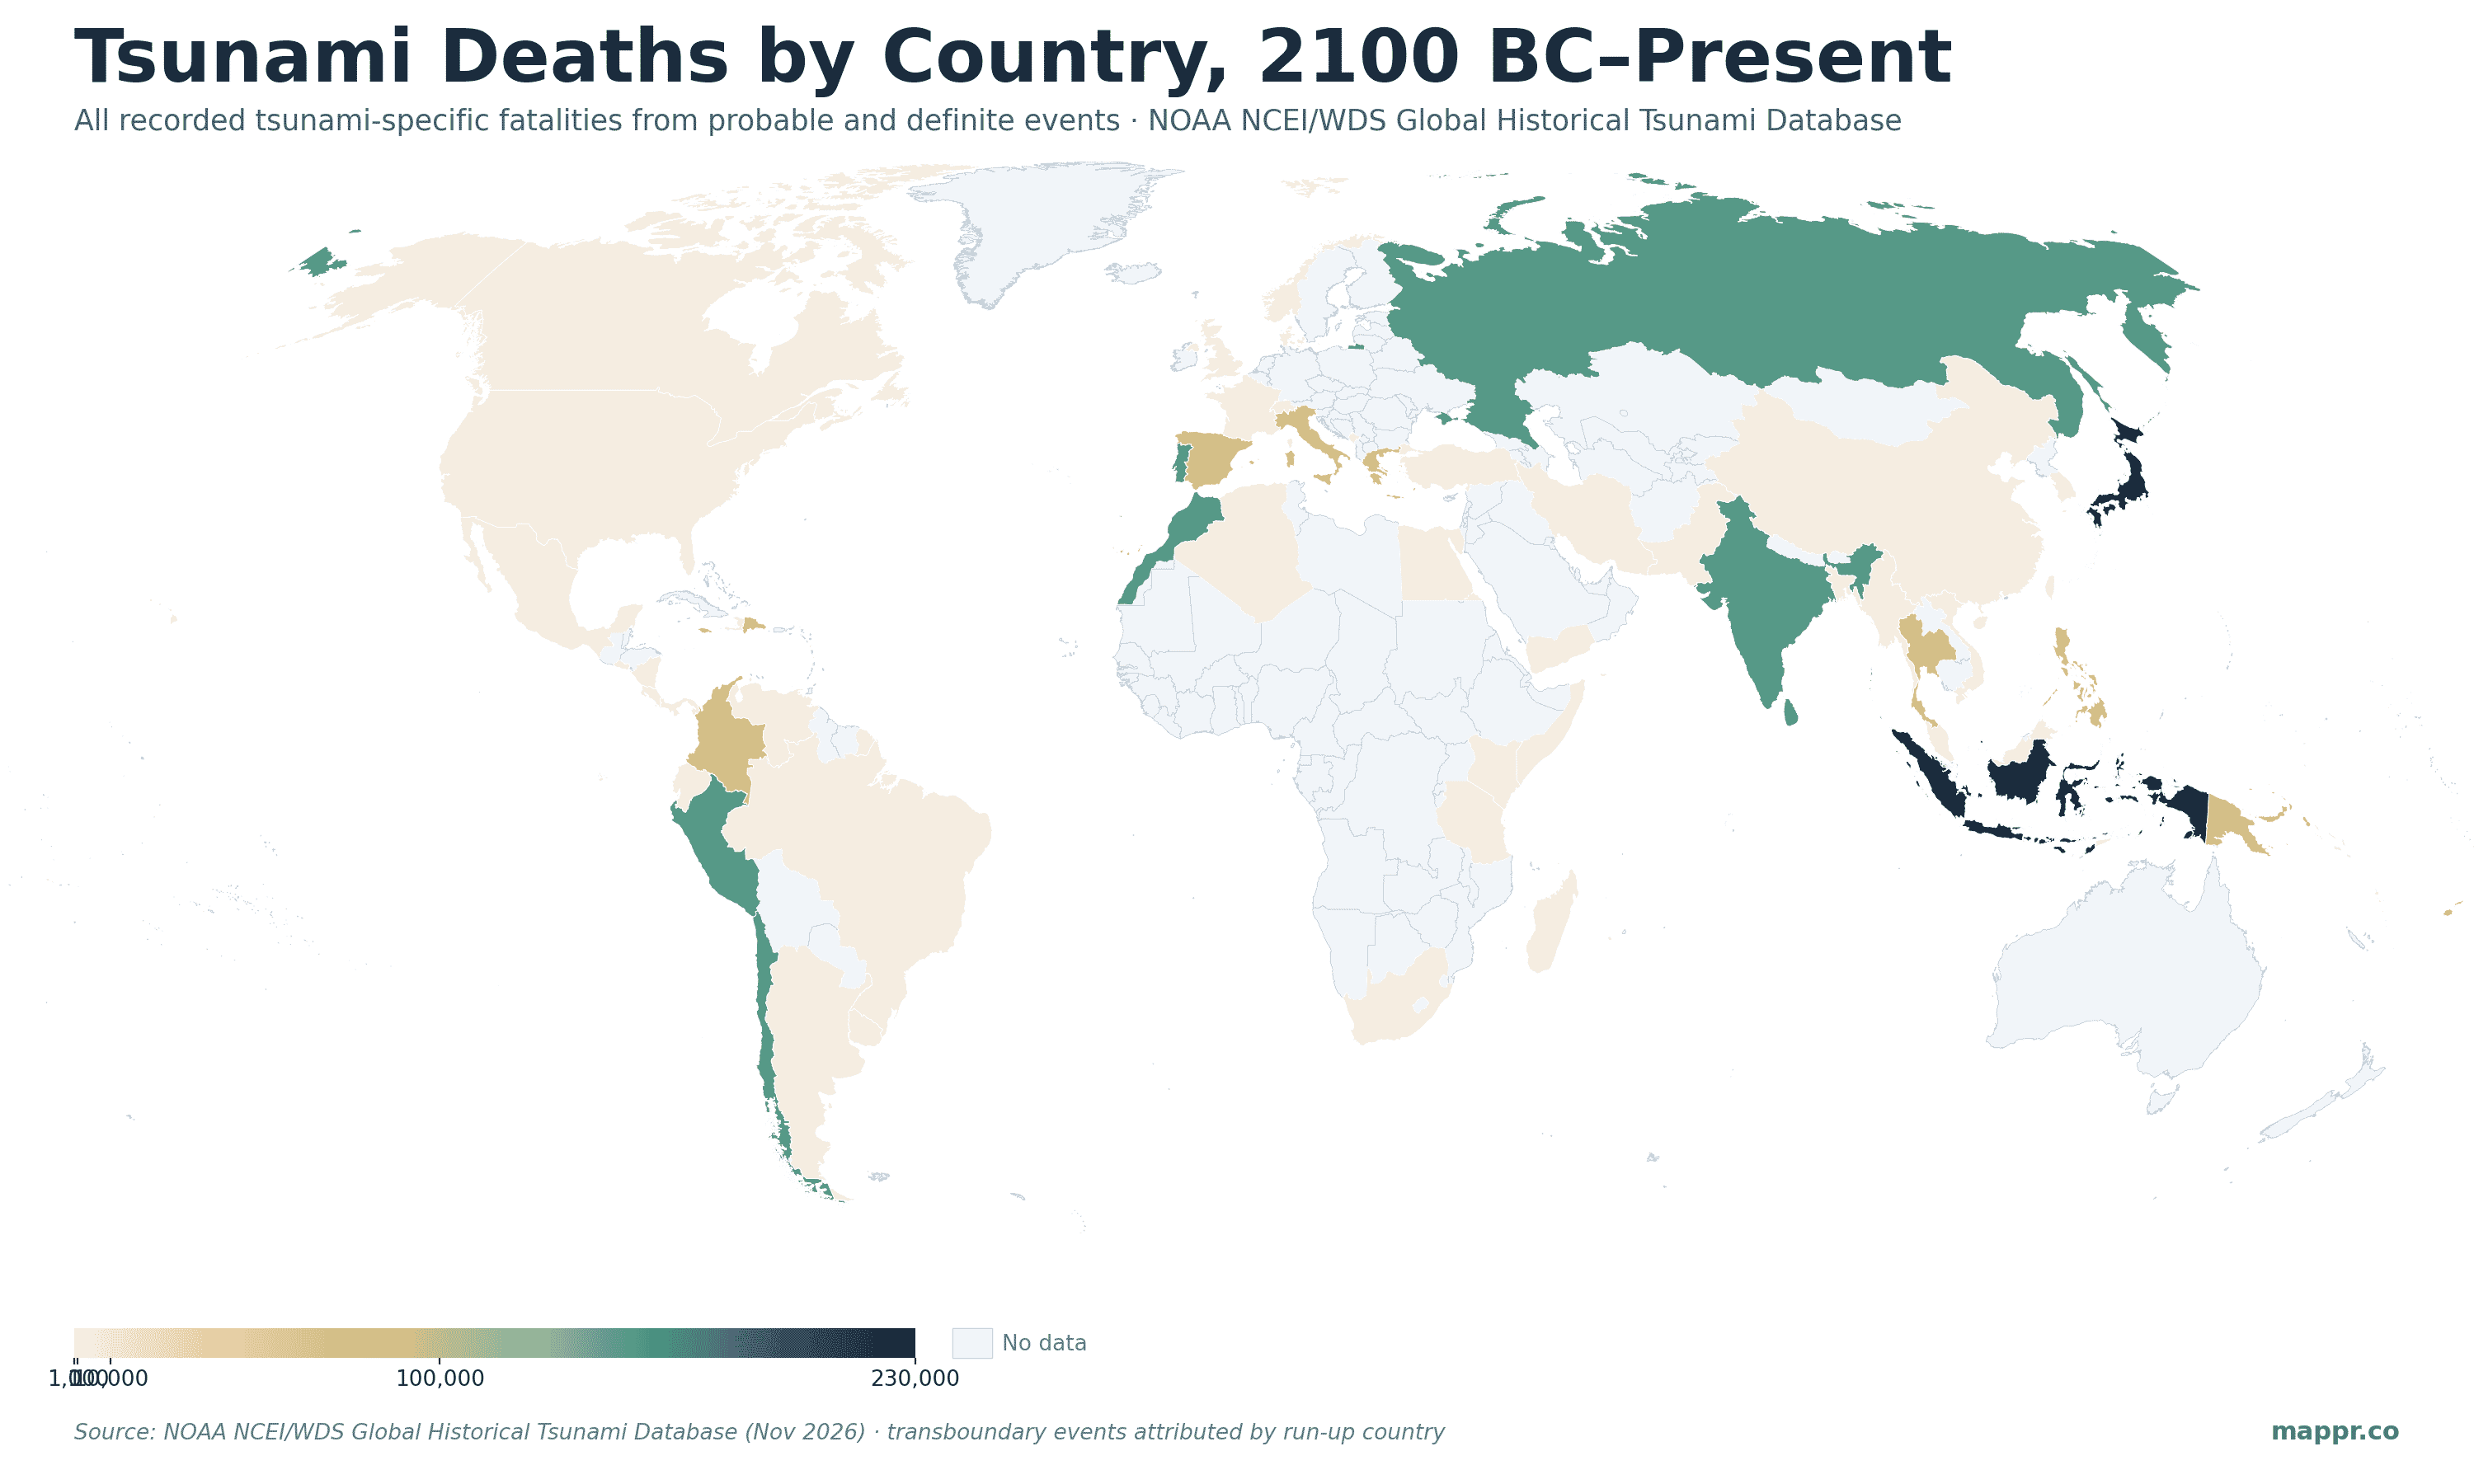
The pattern is the one every geography class draws: the Pacific Ring of Fire, the horseshoe of subduction zones where the deadliest tsunamis are born. Japan, Indonesia, Chile, Kamchatka, Peru and the Philippines all sit on it. The one break from the pattern is the dark band around the Indian Ocean, which was quiet for centuries until a single morning in December 2004.
The Second Layer: How Often Waves Arrive
Deaths are spiky: one catastrophe can define a country’s entire total. A better measure of chronic exposure is how many times a tsunami wave has actually been recorded reaching a country’s shore. In the database each such arrival is a run-up.
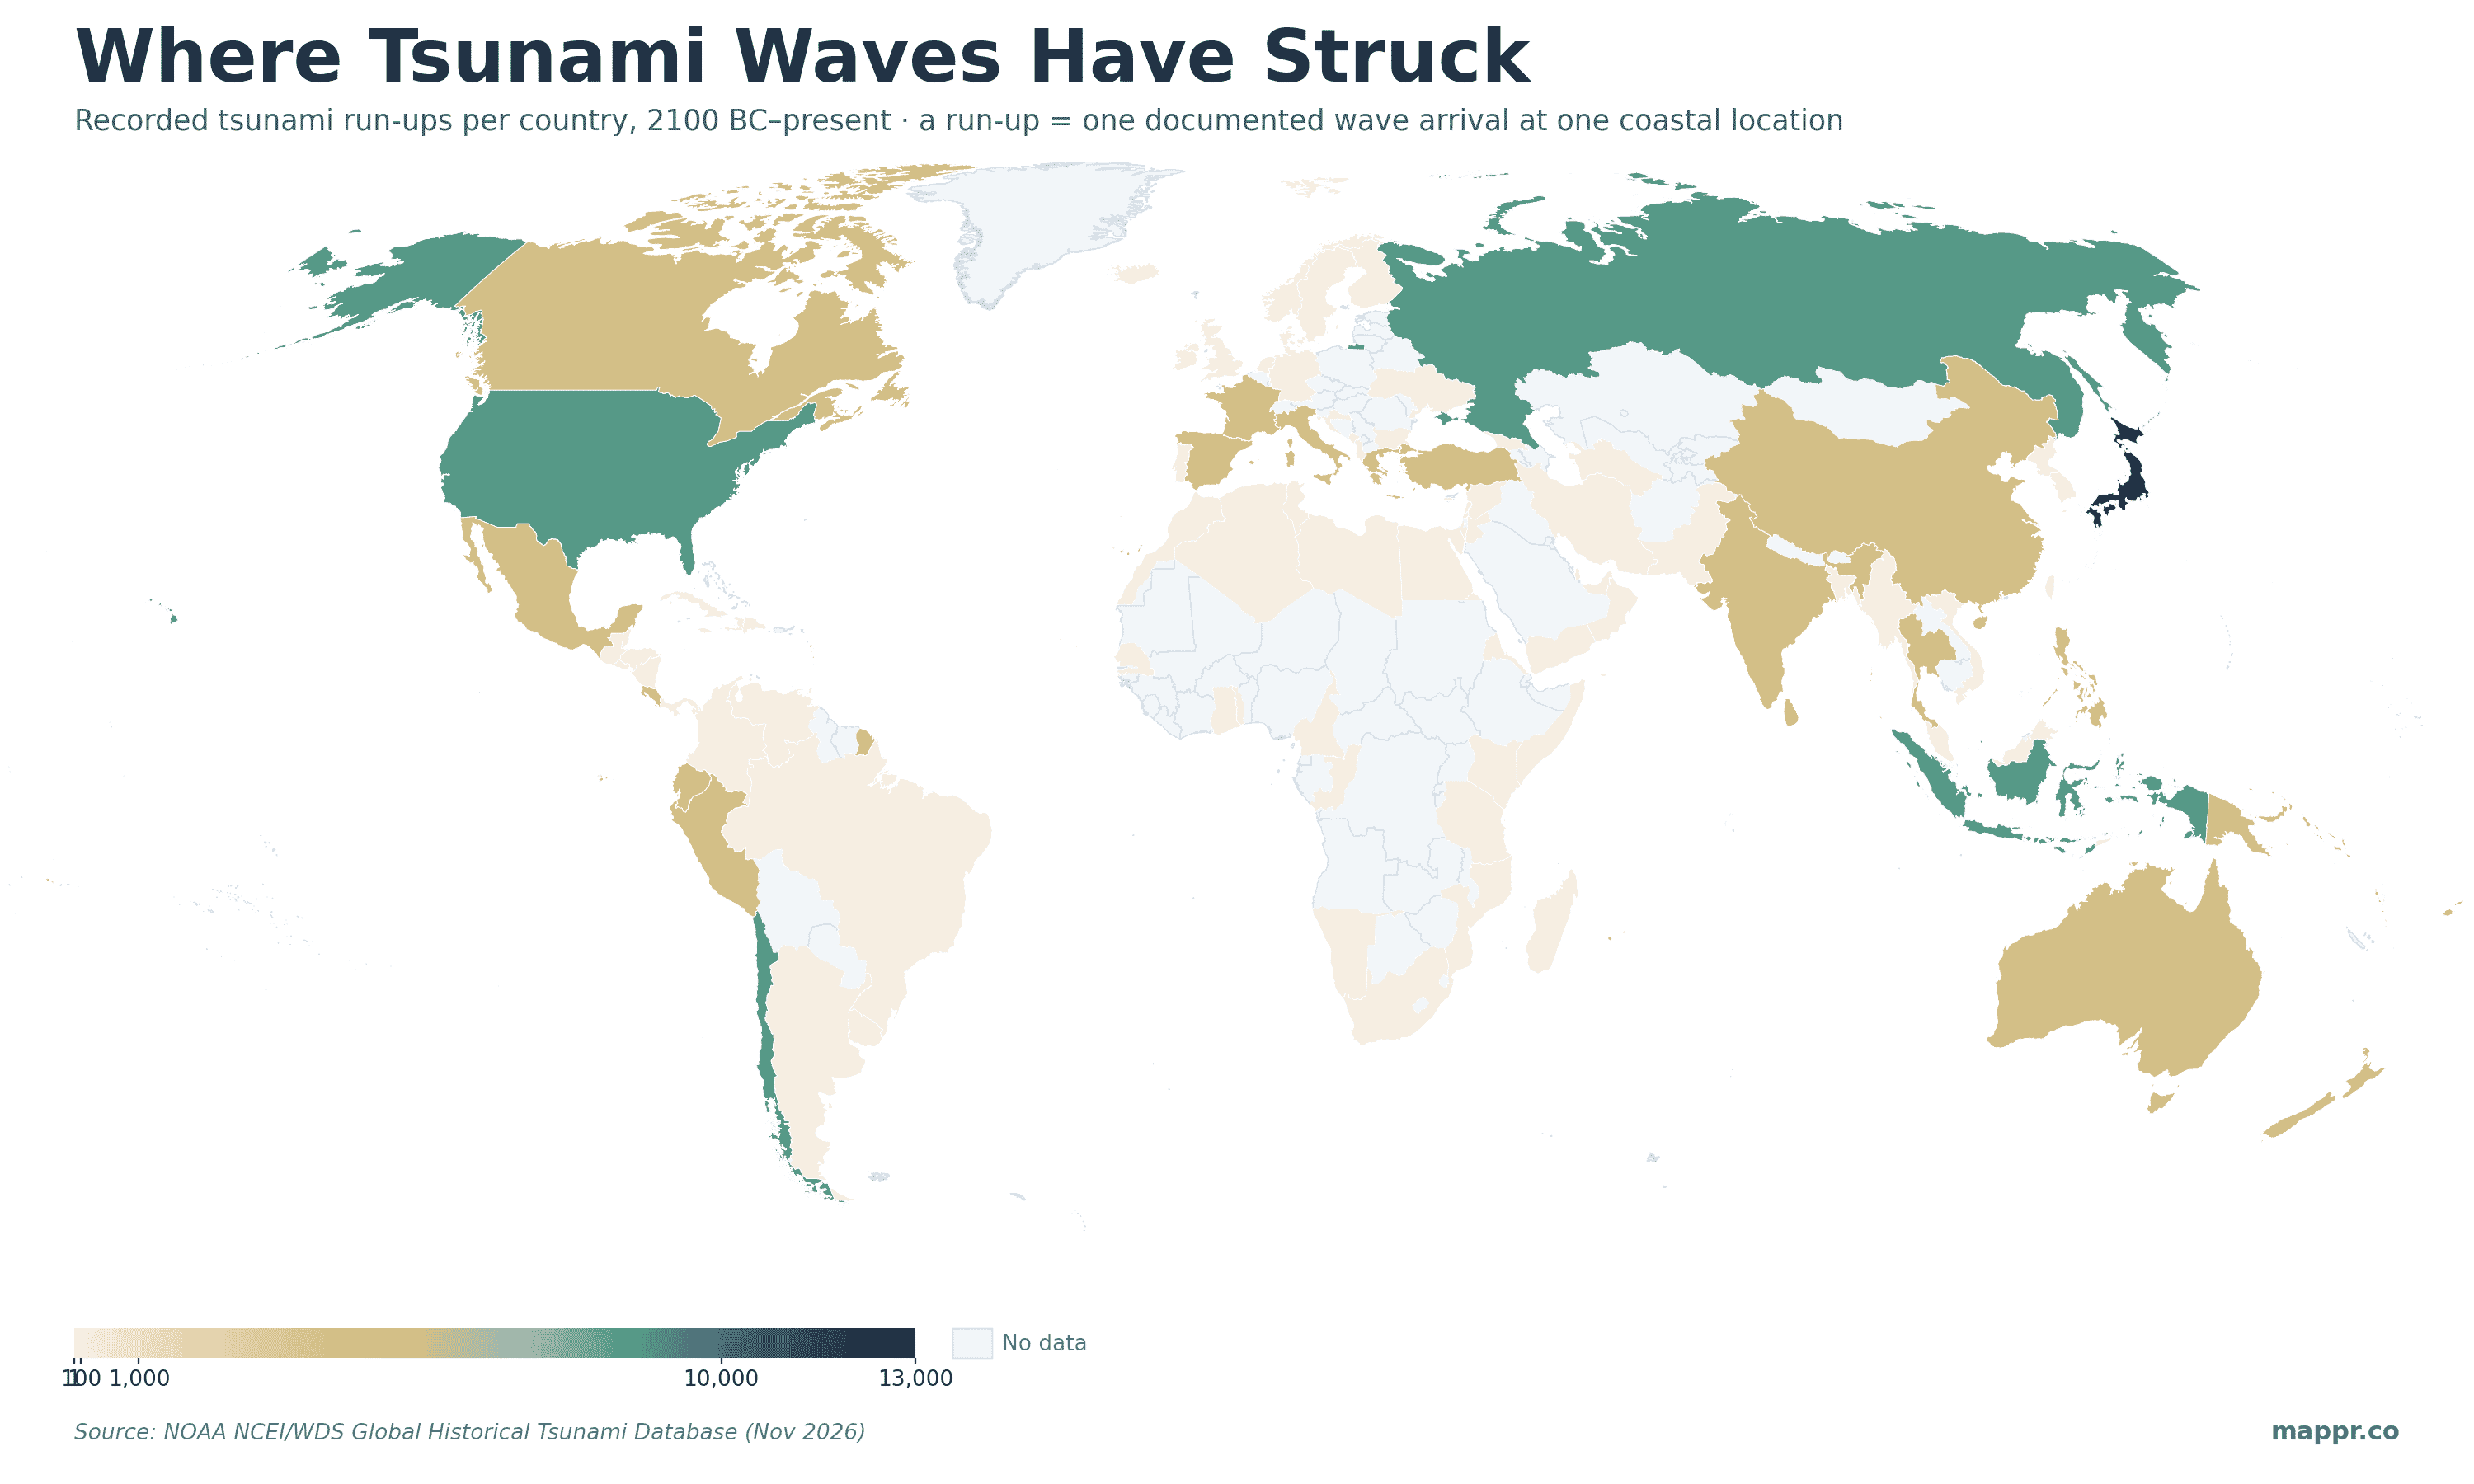
Here Japan runs away with it: nearly 12,800 recorded run-ups, by far the most on Earth, the product of a long coastline, intense seismicity, and centuries of careful record-keeping. The United States (about 5,200, including Alaska, Hawaii and the Pacific territories), Indonesia, Chile and Russia follow. Note how exposure and death count diverge: the US records thousands of waves but relatively few deaths, because most arrived small or on sparsely populated coasts.
The Deadliest Tsunamis in History
A handful of events account for most of the toll on the map. These are the ten deadliest individual tsunamis in the record, by tsunami-specific deaths.
NOAA NCEI/WDS · 2100 BC–present
The 10 Deadliest Tsunamis on Record
By tsunami-specific deaths. Most were triggered by earthquakes; Krakatoa (1883) by a volcanic eruption, Shimabara (1792) by a volcanic landslide.
| Year & place | Tsunami deaths | Trigger |
|---|---|---|
| 2004 · Indian Ocean (Sumatra) | 227,899 | Earthquake |
| 1755 · Lisbon | 50,000 | Earthquake |
| 1883 · Krakatoa | 34,417 | Volcano |
| 1896 · Sanriku, Japan | 27,122 | Earthquake |
| 1868 · Northern Chile (Arica) | 25,000 | Earthquake |
| 2011 · Tōhoku, Japan | 18,423 | Earthquake |
| 1792 · Shimabara, Japan | 15,000 | Volcano |
| 1771 · Ryukyu Islands, Japan | 13,486 | Earthquake |
| 1952 · Kamchatka, Russia | 10,000 | Earthquake |
| 1976 · Moro Gulf, Philippines | 6,800 | Earthquake |
The 2004 Indian Ocean tsunami alone killed about 228,000 people across more than a dozen countries, roughly 167,000 of them in Indonesia, which is why Indonesia tops the all-time map almost single-handedly. The 1755 Lisbon tsunami devastated Portugal, Spain and Morocco and helped reshape European thinking about natural disaster; 2011 Tōhoku is the modern benchmark, and the event that drove Japan’s warning systems to where they are today.
Why the Awareness Day Exists
Look again at the deaths map and one thing stands out: the dark countries were not on anyone’s daily risk radar the week before their worst day. The Indian Ocean had no warning system at all in 2004; the waves took hours to cross the basin, long enough that a functioning alert could have saved tens of thousands, and that absence is precisely what the UN set out to fix.
The 5 November date is itself a lesson in preparedness. It honours the Japanese story of inamura-no-hi, ‘the burning of the rice sheaves’: in 1854 a village headman set fire to his own harvest on a hilltop to lure neighbours to high ground ahead of an incoming tsunami, saving the village. The modern equivalent is a seismograph, a buoy and a siren, and the point of the day is to make sure every exposed coast has all three.
A Note on the Data
The map counts deaths attributed specifically to the tsunami wave, which is why some famous earthquakes look smaller here than in general memory: the 1908 Messina disaster killed around 80,000 people, but only a couple of thousand are attributed to its tsunami rather than the quake itself. For events that crossed borders, like 2004, we assigned deaths to the country where each wave actually came ashore, using the database’s run-up records, rather than lumping the whole toll under the earthquake’s origin country. Only ‘probable’ and ‘definite’ events are included.