
Which US states have the highest violent-crime rates in 2026? Using the latest FBI Uniform Crime Reporting data (2024, the most recent release with final state-by-state figures), the same handful of states appear at the top that have led this list for most of the past decade. Poverty, urban concentration and, in Alaska's case, remoteness are the recurring drivers. Here is the current ranking and the map.
The Map: Violent Crime Rate by State
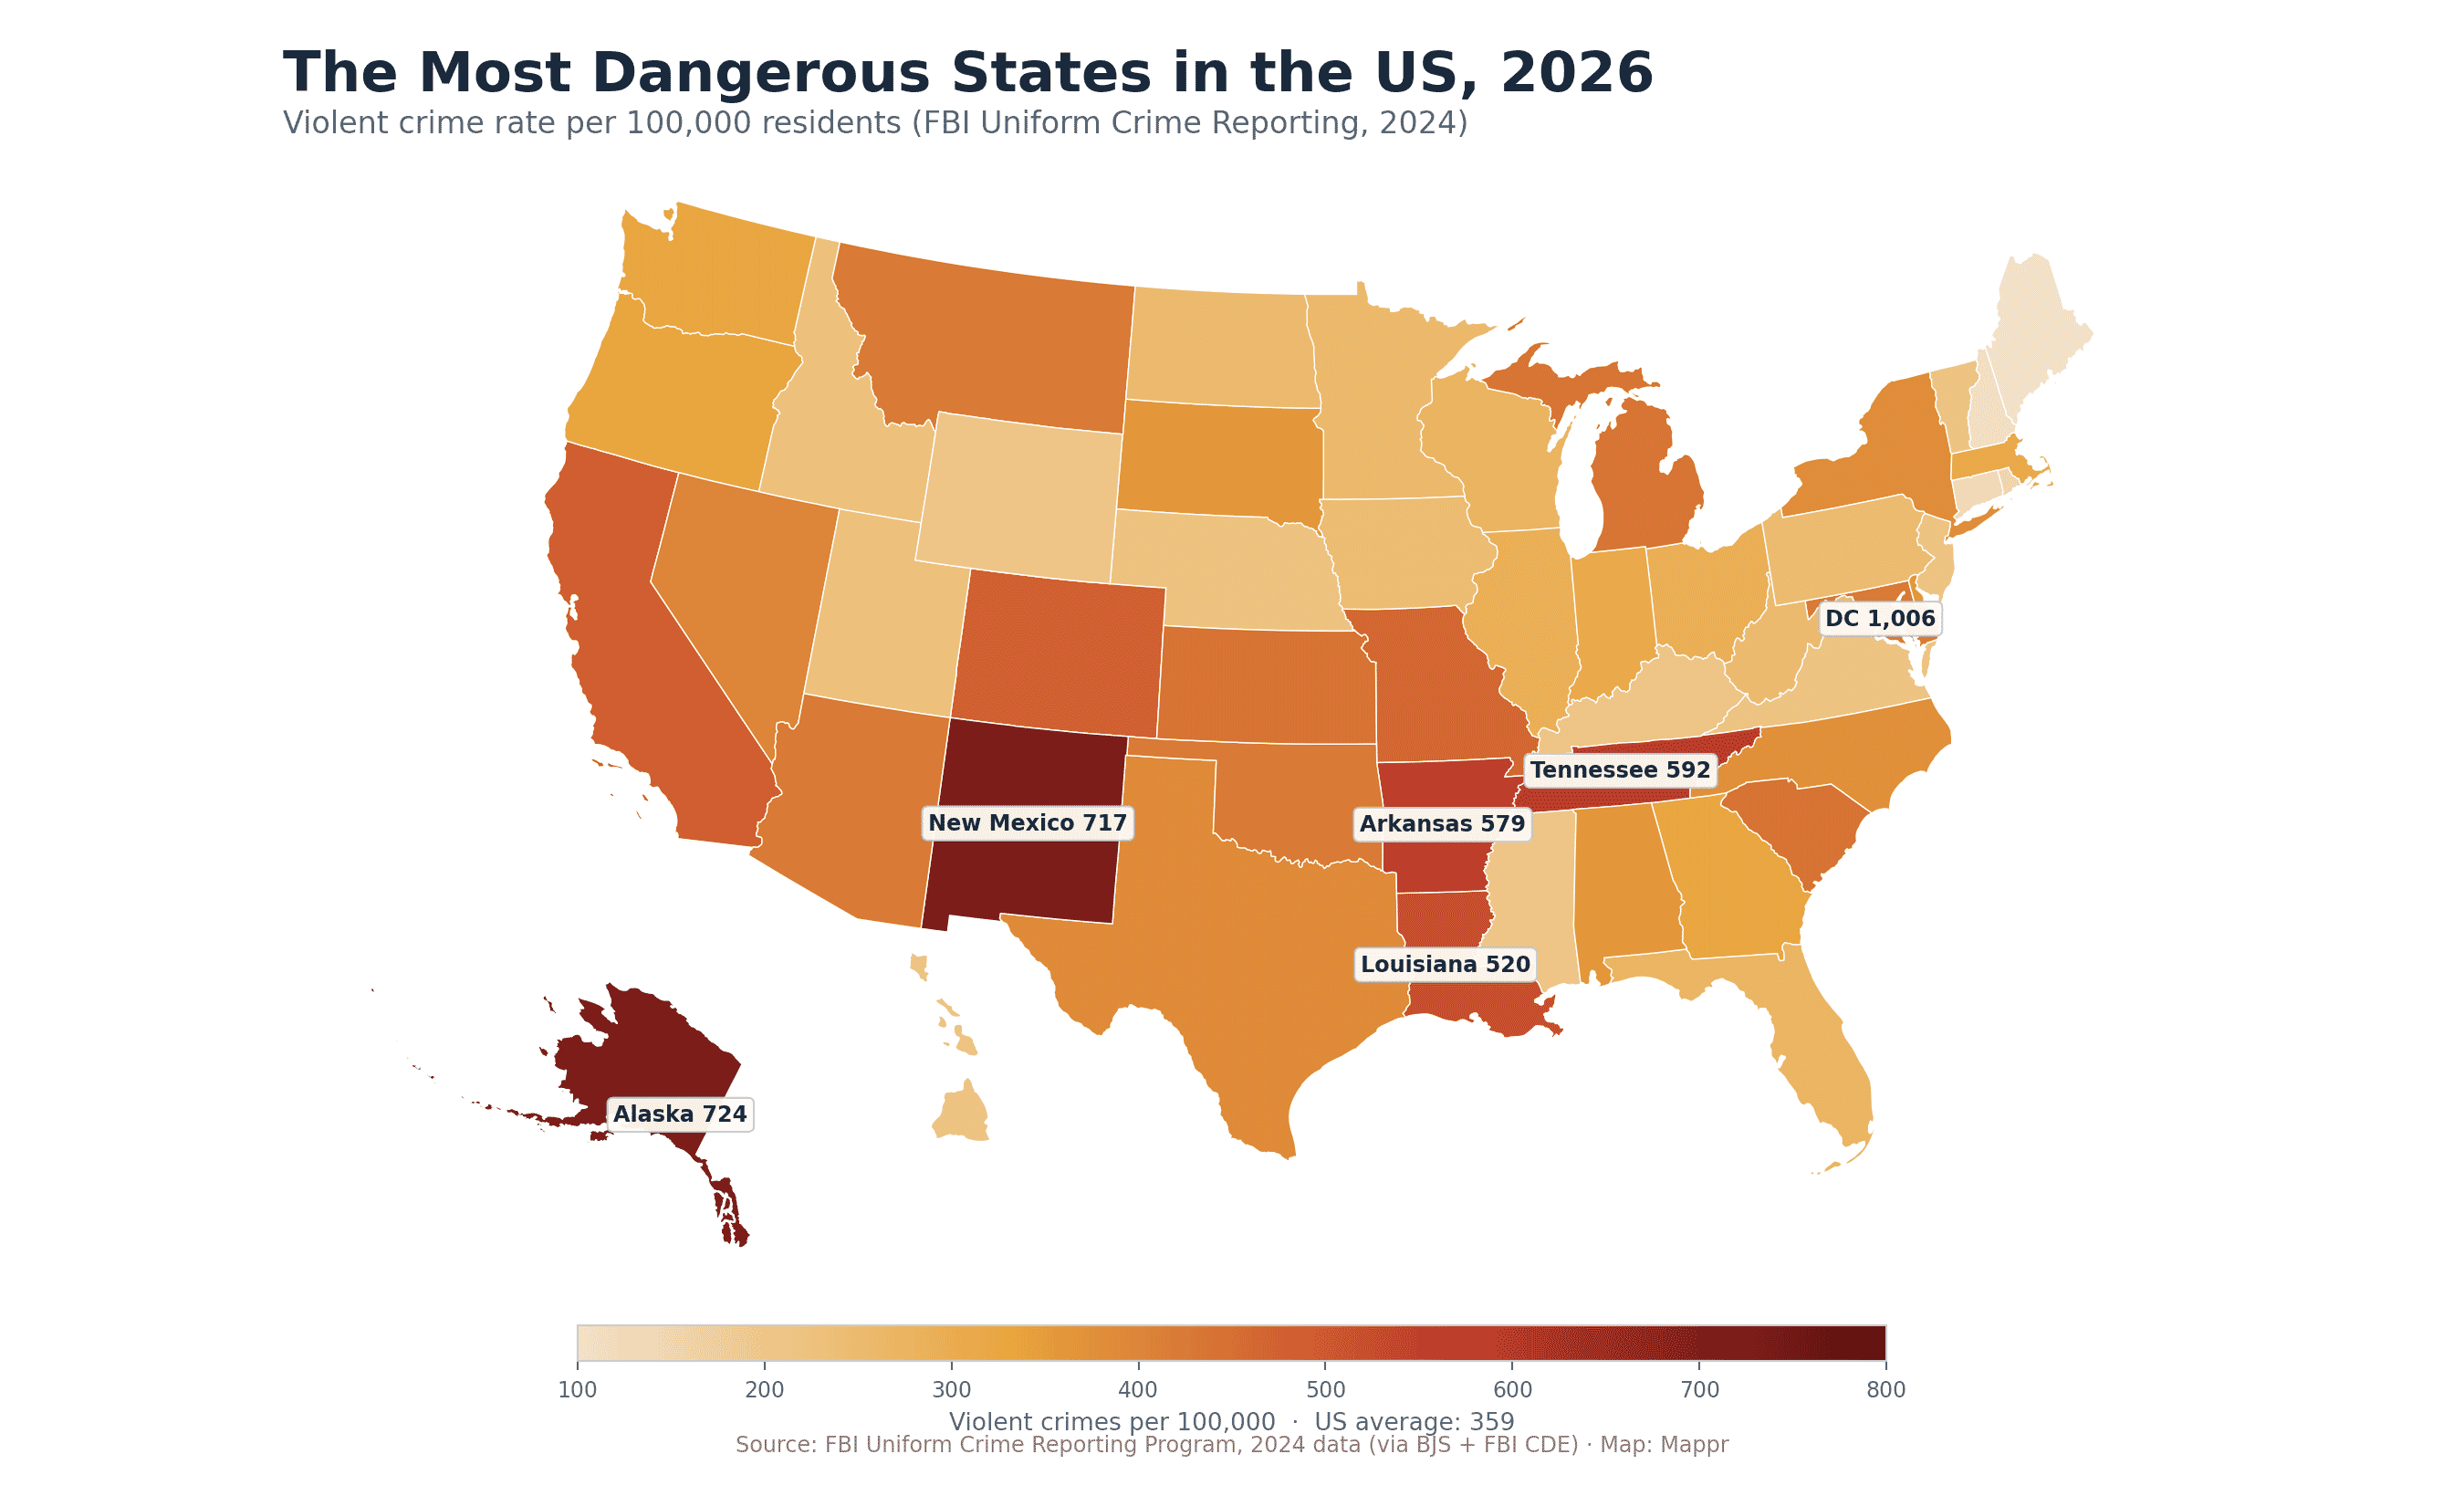
The national violent-crime rate in 2024 was 359.1 offenses per 100,000 residents (FBI UCR). Rates above 500 mark the top five states; rates below 250 mark the safest quarter. Alaska (724) and New Mexico (717) lead by a large margin. Two clusters stand out: the Mountain West and Alaska on one side, and a Deep South band running from Louisiana through Arkansas and Tennessee on the other.
The District of Columbia is not a state, but for context its rate is 1,006, higher than any state in the ranking. Because it is a single city, direct comparison to state-wide numbers overstates the gap.
The 10 Most Dangerous States in 2026
| Rank | State | Violent crime rate (per 100k) | Homicide rate |
|---|---|---|---|
| 1 | Alaska | 724.1 | 6.9 |
| 2 | New Mexico | 717.1 | 10.5 |
| 3 | Tennessee | 592.3 | 7.9 |
| 4 | Arkansas | 579.4 | 7.3 |
| 5 | Louisiana | 519.8 | 10.8 |
| 6 | California | 486.0 | 4.5 |
| 7 | Colorado | 476.3 | 4.5 |
| 8 | Missouri | 462.0 | 7.8 |
| 9 | Kansas | 438.7 | 3.8 |
| 10 | South Carolina | 436.7 | 7.5 |
Full 50-state table further down. First, the top five in more detail.
1. Alaska (724.1 per 100,000)
Rural remoteness, long-standing challenges around domestic and sexual violence in Native communities, and a chronically small law-enforcement footprint keep Alaska's aggravated-assault rate the highest of any state. Anchorage and Fairbanks concentrate reported cases, but the highest rates on a per-capita basis sit in the state's remote western and northern boroughs.
2. New Mexico (717.1 per 100,000)
A combination of persistent poverty, the fentanyl crisis, and property-crime pressure in Albuquerque and Bernalillo County drives New Mexico's numbers. Its homicide rate (10.5) is more than double the US average. Rural counties in the northern and southern parts of the state have grown much faster than Albuquerque itself in the past two years.
3. Tennessee (592.3 per 100,000)
Memphis and Nashville drive Tennessee's rate; the state ranks in the top 5 for both violent crime and aggravated assault. Tennessee's homicide rate (7.9) sits well above the national average.
4. Arkansas (579.4 per 100,000)
High rural poverty and Little Rock's crime pressure combine to give Arkansas the highest rape rate on the list (70.0 per 100k). Homicide is elevated at 7.3.
5. Louisiana (519.8 per 100,000)
Chronically ranks in the top three on homicide (10.8 per 100k, higher than any state on this list). New Orleans and Baton Rouge account for a disproportionate share.
The Full 50-State Table
All 50 states, sortable and searchable. Includes violent, homicide, robbery and aggravated-assault rates per 100,000 residents. Click any column header to re-sort.
| Rank | State | Violent crime rate (per 100k) | Homicide | Robbery | Aggravated assault |
|---|---|---|---|---|---|
| 1 | Alaska | 724.1 | 6.9 | 82.0 | 513.0 |
| 2 | New Mexico | 717.1 | 10.5 | 65.3 | 587.5 |
| 3 | Tennessee | 592.3 | 7.9 | 58.4 | 488.6 |
| 4 | Arkansas | 579.4 | 7.3 | 38.6 | 463.5 |
| 5 | Louisiana | 519.8 | 10.8 | 39.4 | 436.0 |
| 6 | California | 486.0 | 4.5 | 119.1 | 325.8 |
| 7 | Colorado | 476.3 | 4.5 | 63.0 | 350.5 |
| 8 | Missouri | 462.0 | 7.8 | 51.5 | 357.5 |
| 9 | Kansas | 438.7 | 3.8 | 30.9 | 359.9 |
| 10 | South Carolina | 436.7 | 7.5 | 35.1 | 357.1 |
| 11 | Michigan | 434.3 | 5.2 | 31.3 | 341.3 |
| 12 | Montana | 423.5 | 2.7 | 19.1 | 342.5 |
| 13 | Oklahoma | 422.8 | 6.3 | 38.2 | 318.7 |
| 14 | Arizona | 421.9 | 4.9 | 64.6 | 312.4 |
| 15 | Maryland | 420.4 | 7.2 | 123.2 | 257.0 |
| 16 | Nevada | 402.0 | 6.1 | 63.1 | 281.0 |
| 17 | Texas | 389.4 | 5.2 | 63.5 | 270.7 |
| 18 | New York | 380.2 | 2.7 | 96.1 | 259.6 |
| 19 | North Carolina | 375.8 | 7.5 | 50.2 | 290.1 |
| 20 | South Dakota | 362.3 | 4.7 | 22.6 | 283.6 |
| 21 | Delaware | 360.8 | 5.7 | 47.0 | 292.4 |
| 22 | Alabama | 359.9 | 8.7 | 34.0 | 291.4 |
| 23 | Oregon | 331.0 | 3.7 | 57.0 | 229.1 |
| 24 | Washington | 326.1 | 3.8 | 67.5 | 217.0 |
| 25 | Georgia | 325.7 | 6.9 | 40.8 | 245.9 |
| 26 | Massachusetts | 314.7 | 1.8 | 36.0 | 249.3 |
| 27 | Indiana | 312.9 | 5.5 | 34.5 | 239.4 |
| 28 | Ohio | 293.7 | 5.0 | 45.5 | 197.4 |
| 29 | Illinois | 289.2 | 5.8 | 90.2 | 146.3 |
| 30 | Wisconsin | 278.5 | 4.2 | 39.4 | 200.1 |
| 31 | Florida | 267.1 | 3.9 | 38.2 | 197.1 |
| 32 | Minnesota | 256.6 | 2.9 | 48.9 | 168.0 |
| 33 | North Dakota | 254.3 | 2.6 | 27.4 | 174.5 |
| 34 | West Virginia | 248.8 | 5.3 | 9.7 | 185.8 |
| 35 | Pennsylvania | 245.6 | 5.0 | 51.4 | 161.4 |
| 36 | Iowa | 243.3 | 2.1 | 18.7 | 187.2 |
| 37 | Idaho | 230.6 | 1.6 | 7.0 | 177.3 |
| 38 | Utah | 229.6 | 2.6 | 27.3 | 141.7 |
| 39 | Nebraska | 220.5 | 2.1 | 20.5 | 154.5 |
| 40 | Vermont | 219.1 | 3.4 | 14.2 | 166.8 |
| 41 | Virginia | 217.9 | 4.8 | 33.1 | 152.2 |
| 42 | New Jersey | 217.7 | 2.3 | 49.3 | 148.8 |
| 43 | Hawaii | 217.7 | 1.6 | 41.3 | 136.0 |
| 44 | Kentucky | 213.1 | 6.1 | 35.1 | 139.5 |
| 45 | Mississippi | 210.5 | 7.4 | 18.5 | 155.4 |
| 46 | Wyoming | 203.4 | 2.4 | 7.1 | 135.8 |
| 47 | Rhode Island | 153.6 | 2.1 | 22.2 | 99.8 |
| 48 | Connecticut | 136.0 | 2.5 | 38.1 | 77.6 |
| 49 | New Hampshire | 110.1 | 1.0 | 12.6 | 62.8 |
| 50 | Maine | 100.1 | 2.3 | 11.0 | 55.0 |
Two Important Caveats
Reporting matters. The FBI UCR is a voluntary reporting program. In 2024 nearly all US agencies reported, but historical comparisons are complicated by earlier gaps and by a 2021 switch to the NIBRS incident-based system that changed how some offenses are counted. Preliminary FBI estimates for 2025, released in May 2026, point to a further 9.3% national drop in violent crime; final state-level 2025 figures are expected in late 2026, and this ranking will be updated when they land.
Rates hide geography. A single state can contain both the safest and the most dangerous places on this map. New Mexico's rate is driven substantially by Albuquerque; Louisiana's by New Orleans and Baton Rouge; Tennessee's by Memphis. Rural areas in the same states often have rates below the national average.
For a city-level view, see FBI CDE's crime dashboard, or the Security.org most-dangerous-cities ranking, both linked in the sources below.
Sources:


