Key Takeaways
- Gold became America's top export. In early 2026, gold topped the US monthly export table for three months running. February 2026 alone saw a record $17.88 billion of gold leave the country, helping push total US exports to an all-time high, with more than 85% of it departing through New York's JFK Airport.
- 2025 exports nearly tripled. Full-year 2025 gold exports hit $80.6 billion, up from $29.7 billion in 2024. Switzerland took $45.3 billion (56%) and the United Kingdom $19.6 billion (24%): the gold was flowing back to the London-Zurich bullion hub it had come from.
- It started with a tariff that never happened. After the 2024 US election, banks feared gold might be caught in new tariffs. That fear blew the New York-London price gap (the EFP) from about $10 to over $60 an ounce, and roughly $135 billion of physical gold was flown into US vaults in months. COMEX inventories jumped 153%.
- It broke the Fed's GDP model. The gold pouring in registered as imports and dragged the Atlanta Fed's GDPNow forecast to -2.8%, a false recession signal. Actual Q1 2025 GDP came in at about -0.5%, and the Fed rewrote the model in April 2025 to exclude gold flows.
- The reversal is the record. When gold was explicitly exempted from tariffs on April 2, 2025, the arbitrage died overnight and the metal started flowing back out, which is exactly what today's record exports are. By 2026, a second force emerged: Asian buyers, with Hong Kong overtaking the UK as the #2 destination.
Scan the list of America’s biggest exports in early 2026 and the top item is not aircraft, semiconductors, oil or soybeans. It is gold. In February 2026, $17.88 billion of it left the country in a single month, a record, and gold topped the US export table for three consecutive months. More than 85% of it departed from one place: the cargo terminals around New York’s JFK Airport.
That is deeply strange for a country that mines only modest amounts of the metal. The explanation is one of the oddest stories in modern trade data: a tariff that never happened, a price signal almost nobody watches, a false recession alarm, and hundreds of tonnes of bullion making an unplanned round trip across the Atlantic. Here is the whole story, mapped.
The Map: Where America’s Gold Went in 2025
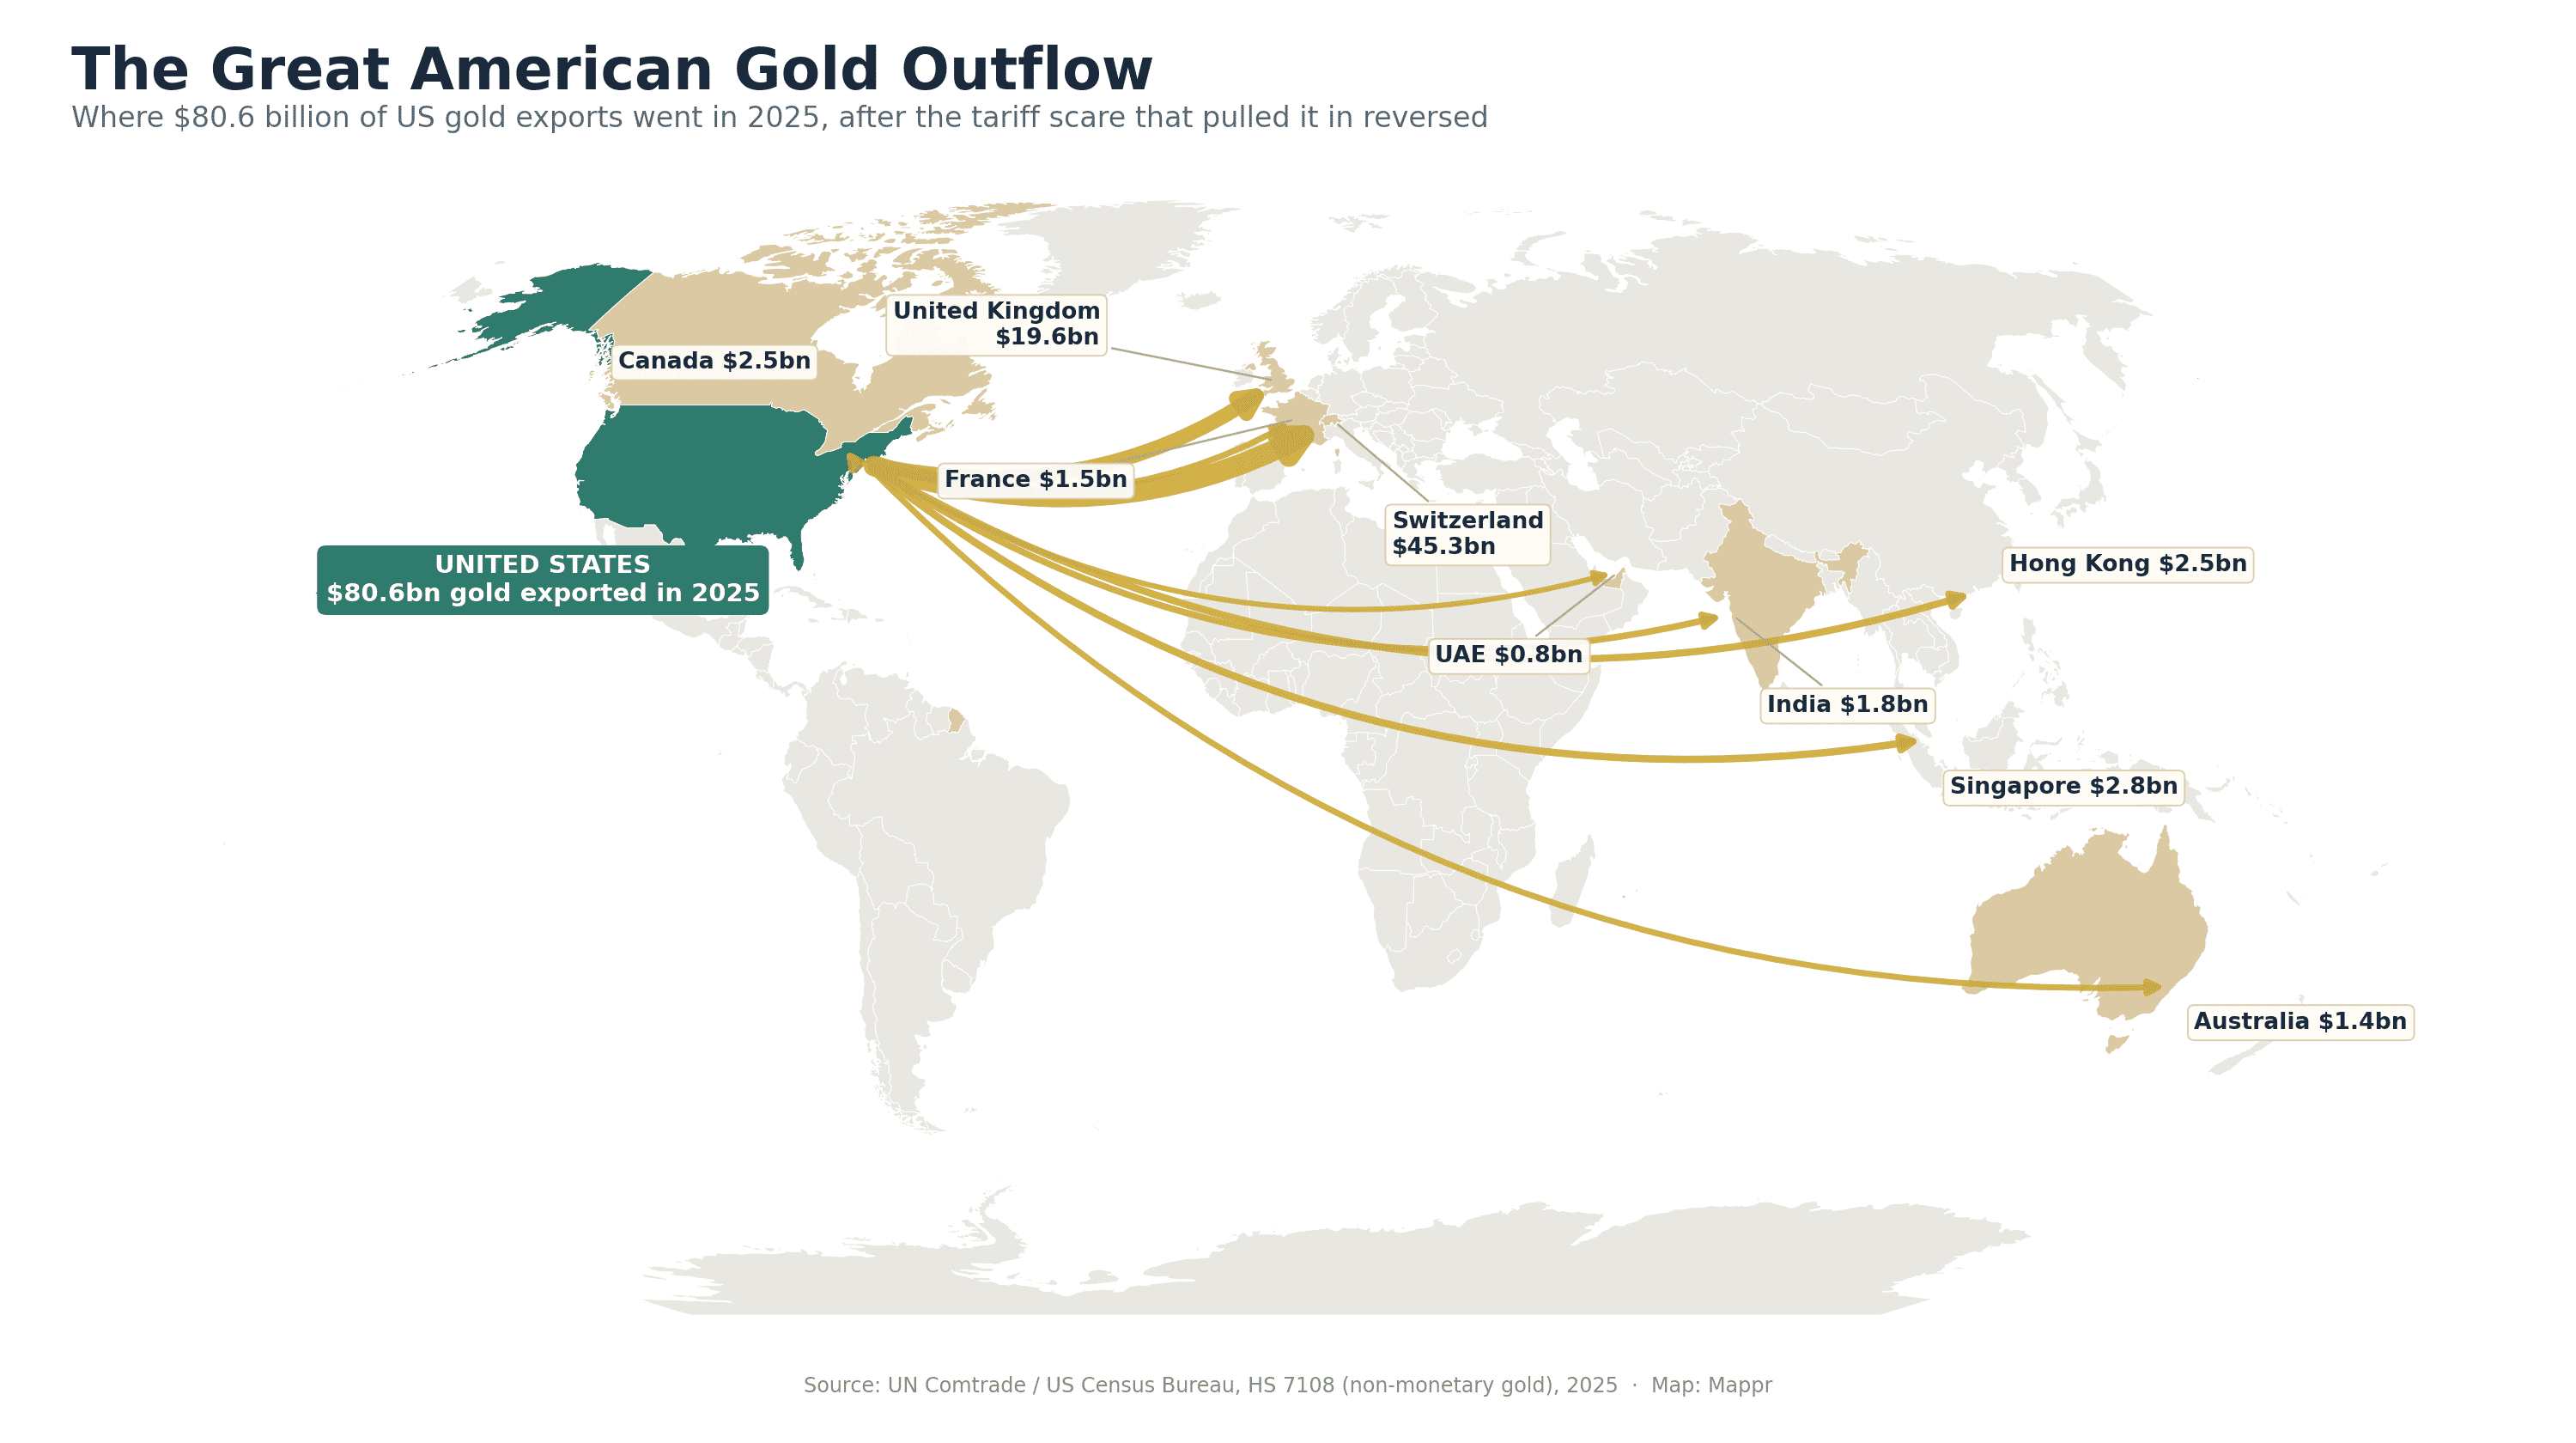
In 2025 the United States exported $80.6 billion of non-monetary gold, nearly triple the $29.7 billion of 2024. The destinations tell you immediately what kind of flow this was: Switzerland ($45.3 billion) and the United Kingdom ($19.6 billion) took four-fifths of it. Those are not jewelry markets; they are the two poles of the global bullion system, Zurich’s refineries and London’s vaults. This was gold going home.
| Destination | 2025 exports | 2024 exports | Share of 2025 total |
|---|---|---|---|
| Switzerland | $45.31bn | $9.41bn | 56.2% |
| United Kingdom | $19.64bn | $10.80bn | 24.4% |
| Singapore | $2.79bn | $2.99bn | 3.5% |
| Canada | $2.53bn | $0.64bn | 3.1% |
| Hong Kong | $2.52bn | $0.56bn | 3.1% |
| India | $1.82bn | $2.05bn | 2.3% |
| France | $1.52bn | $0.01bn | 1.9% |
| Australia | $1.37bn | $1.06bn | 1.7% |
| UAE | $0.83bn | $0.94bn | 1.0% |
| Italy | $0.50bn | $0.30bn | 0.6% |
From Trickle to Torrent
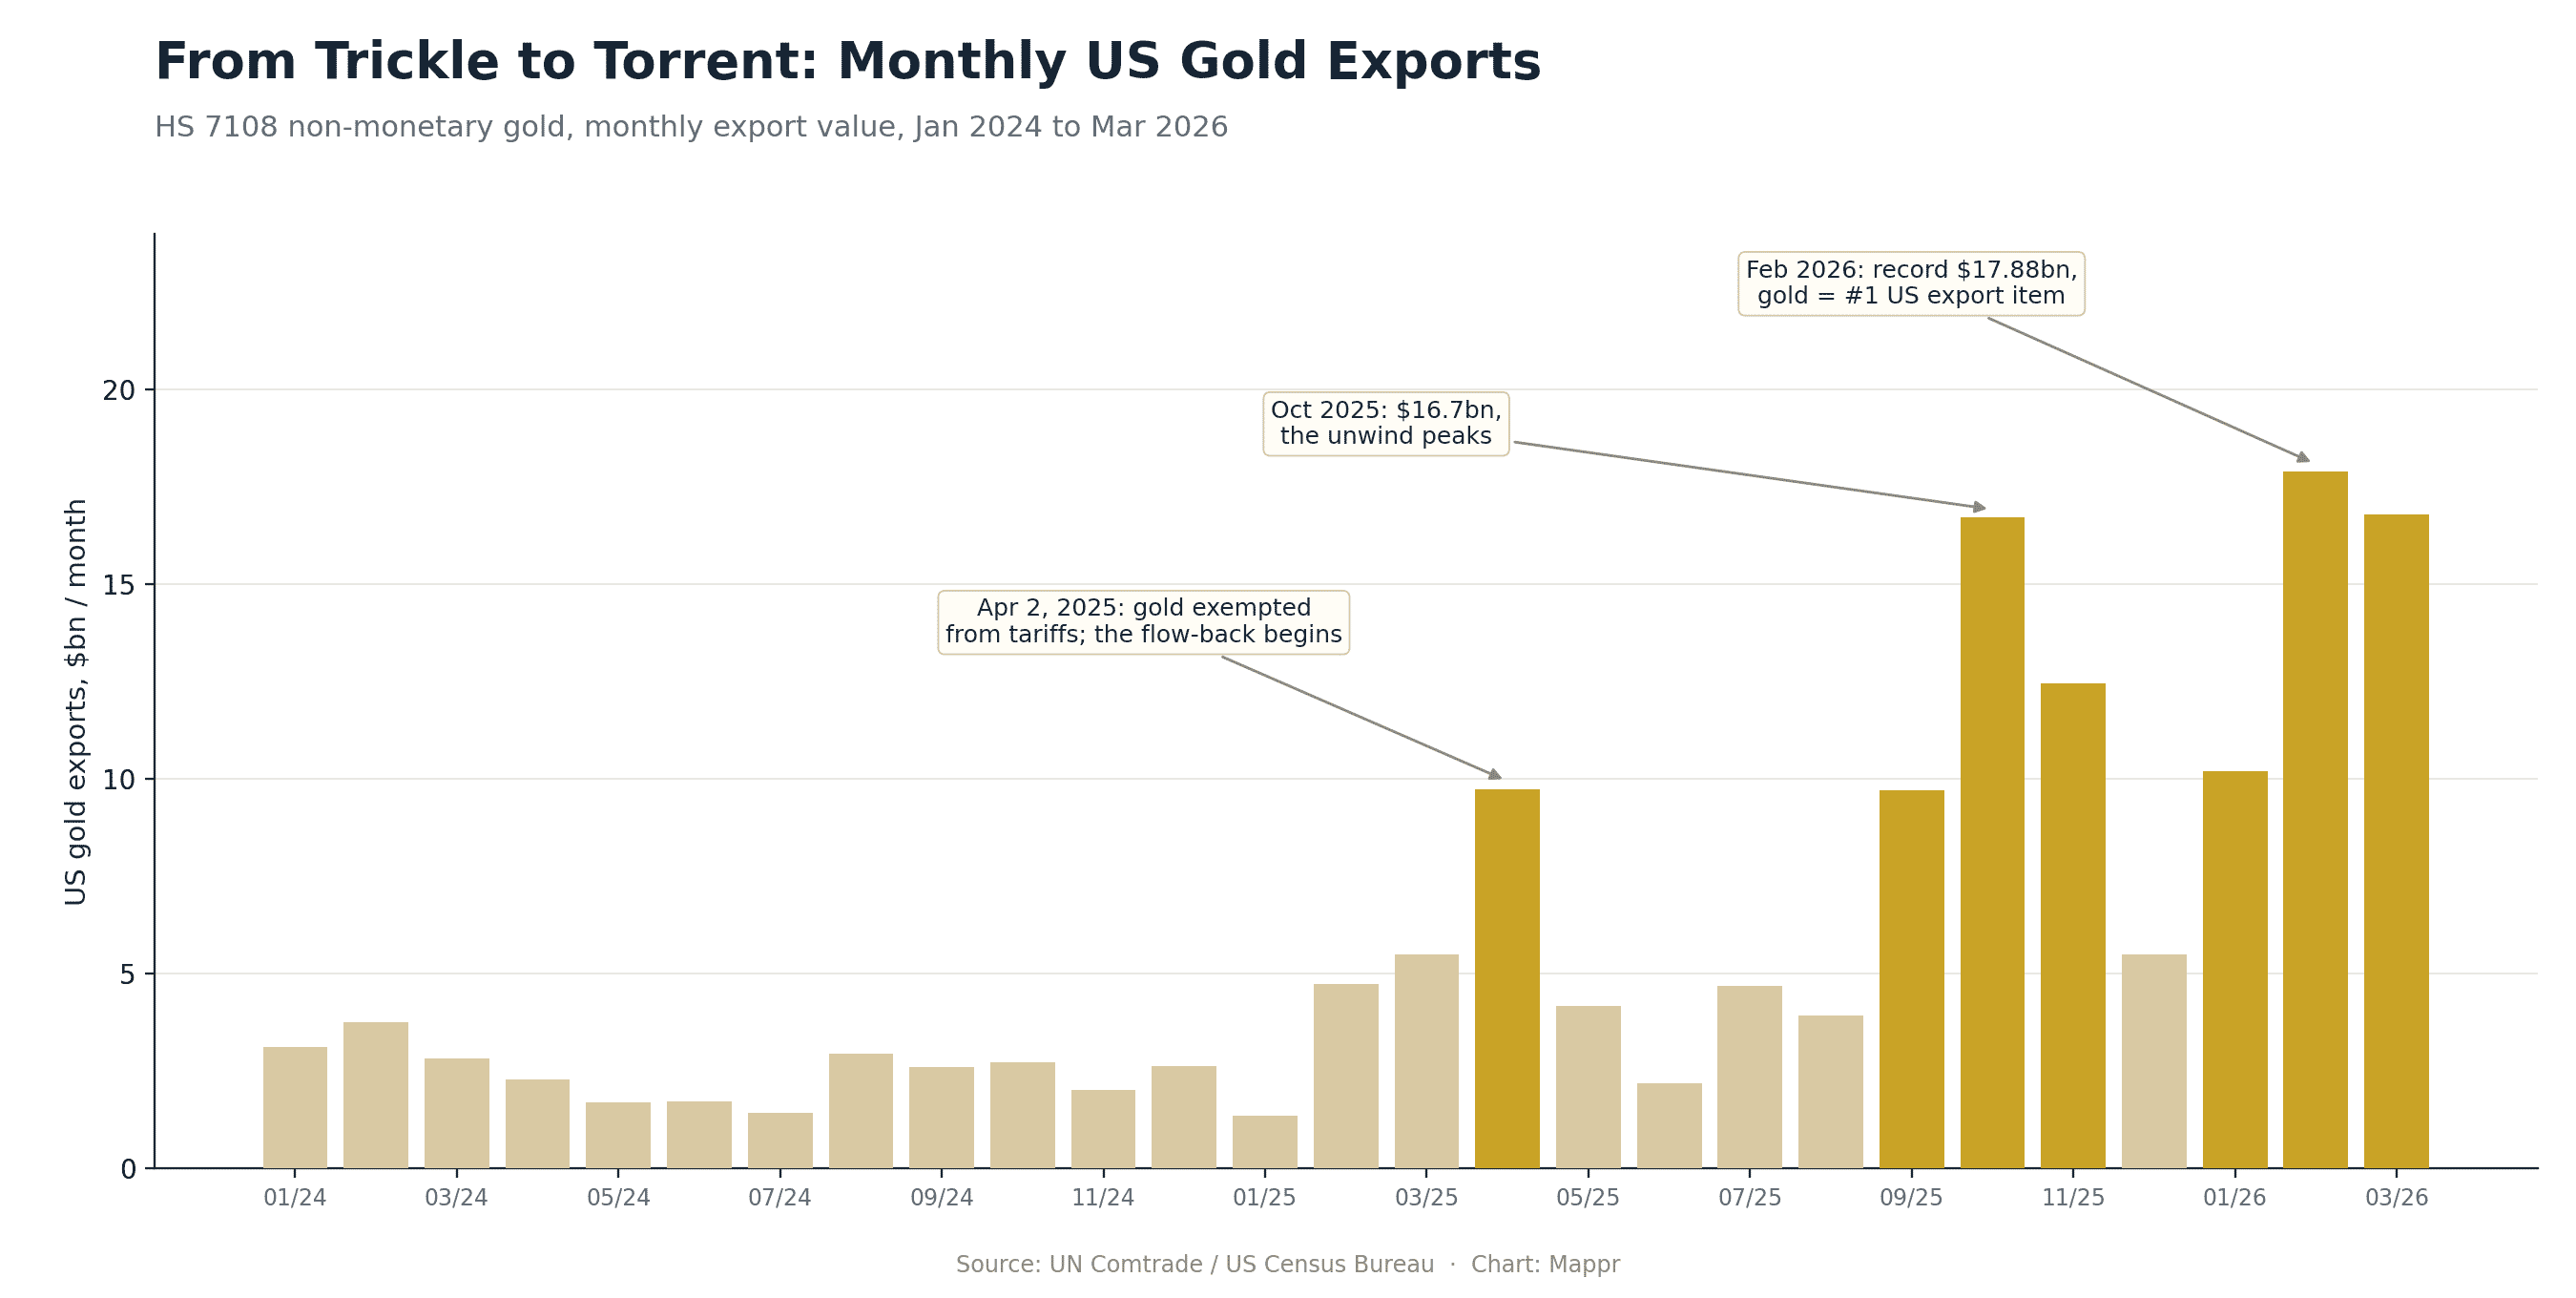
Through 2024, US gold exports ran at a sleepy $1.5 to 3.7 billion a month. The torrent began in the second half of 2025 and has not stopped: $16.7 billion in October 2025, $17.88 billion in February 2026, $16.8 billion in March 2026.
Why: The Tariff Scare That Started Everything
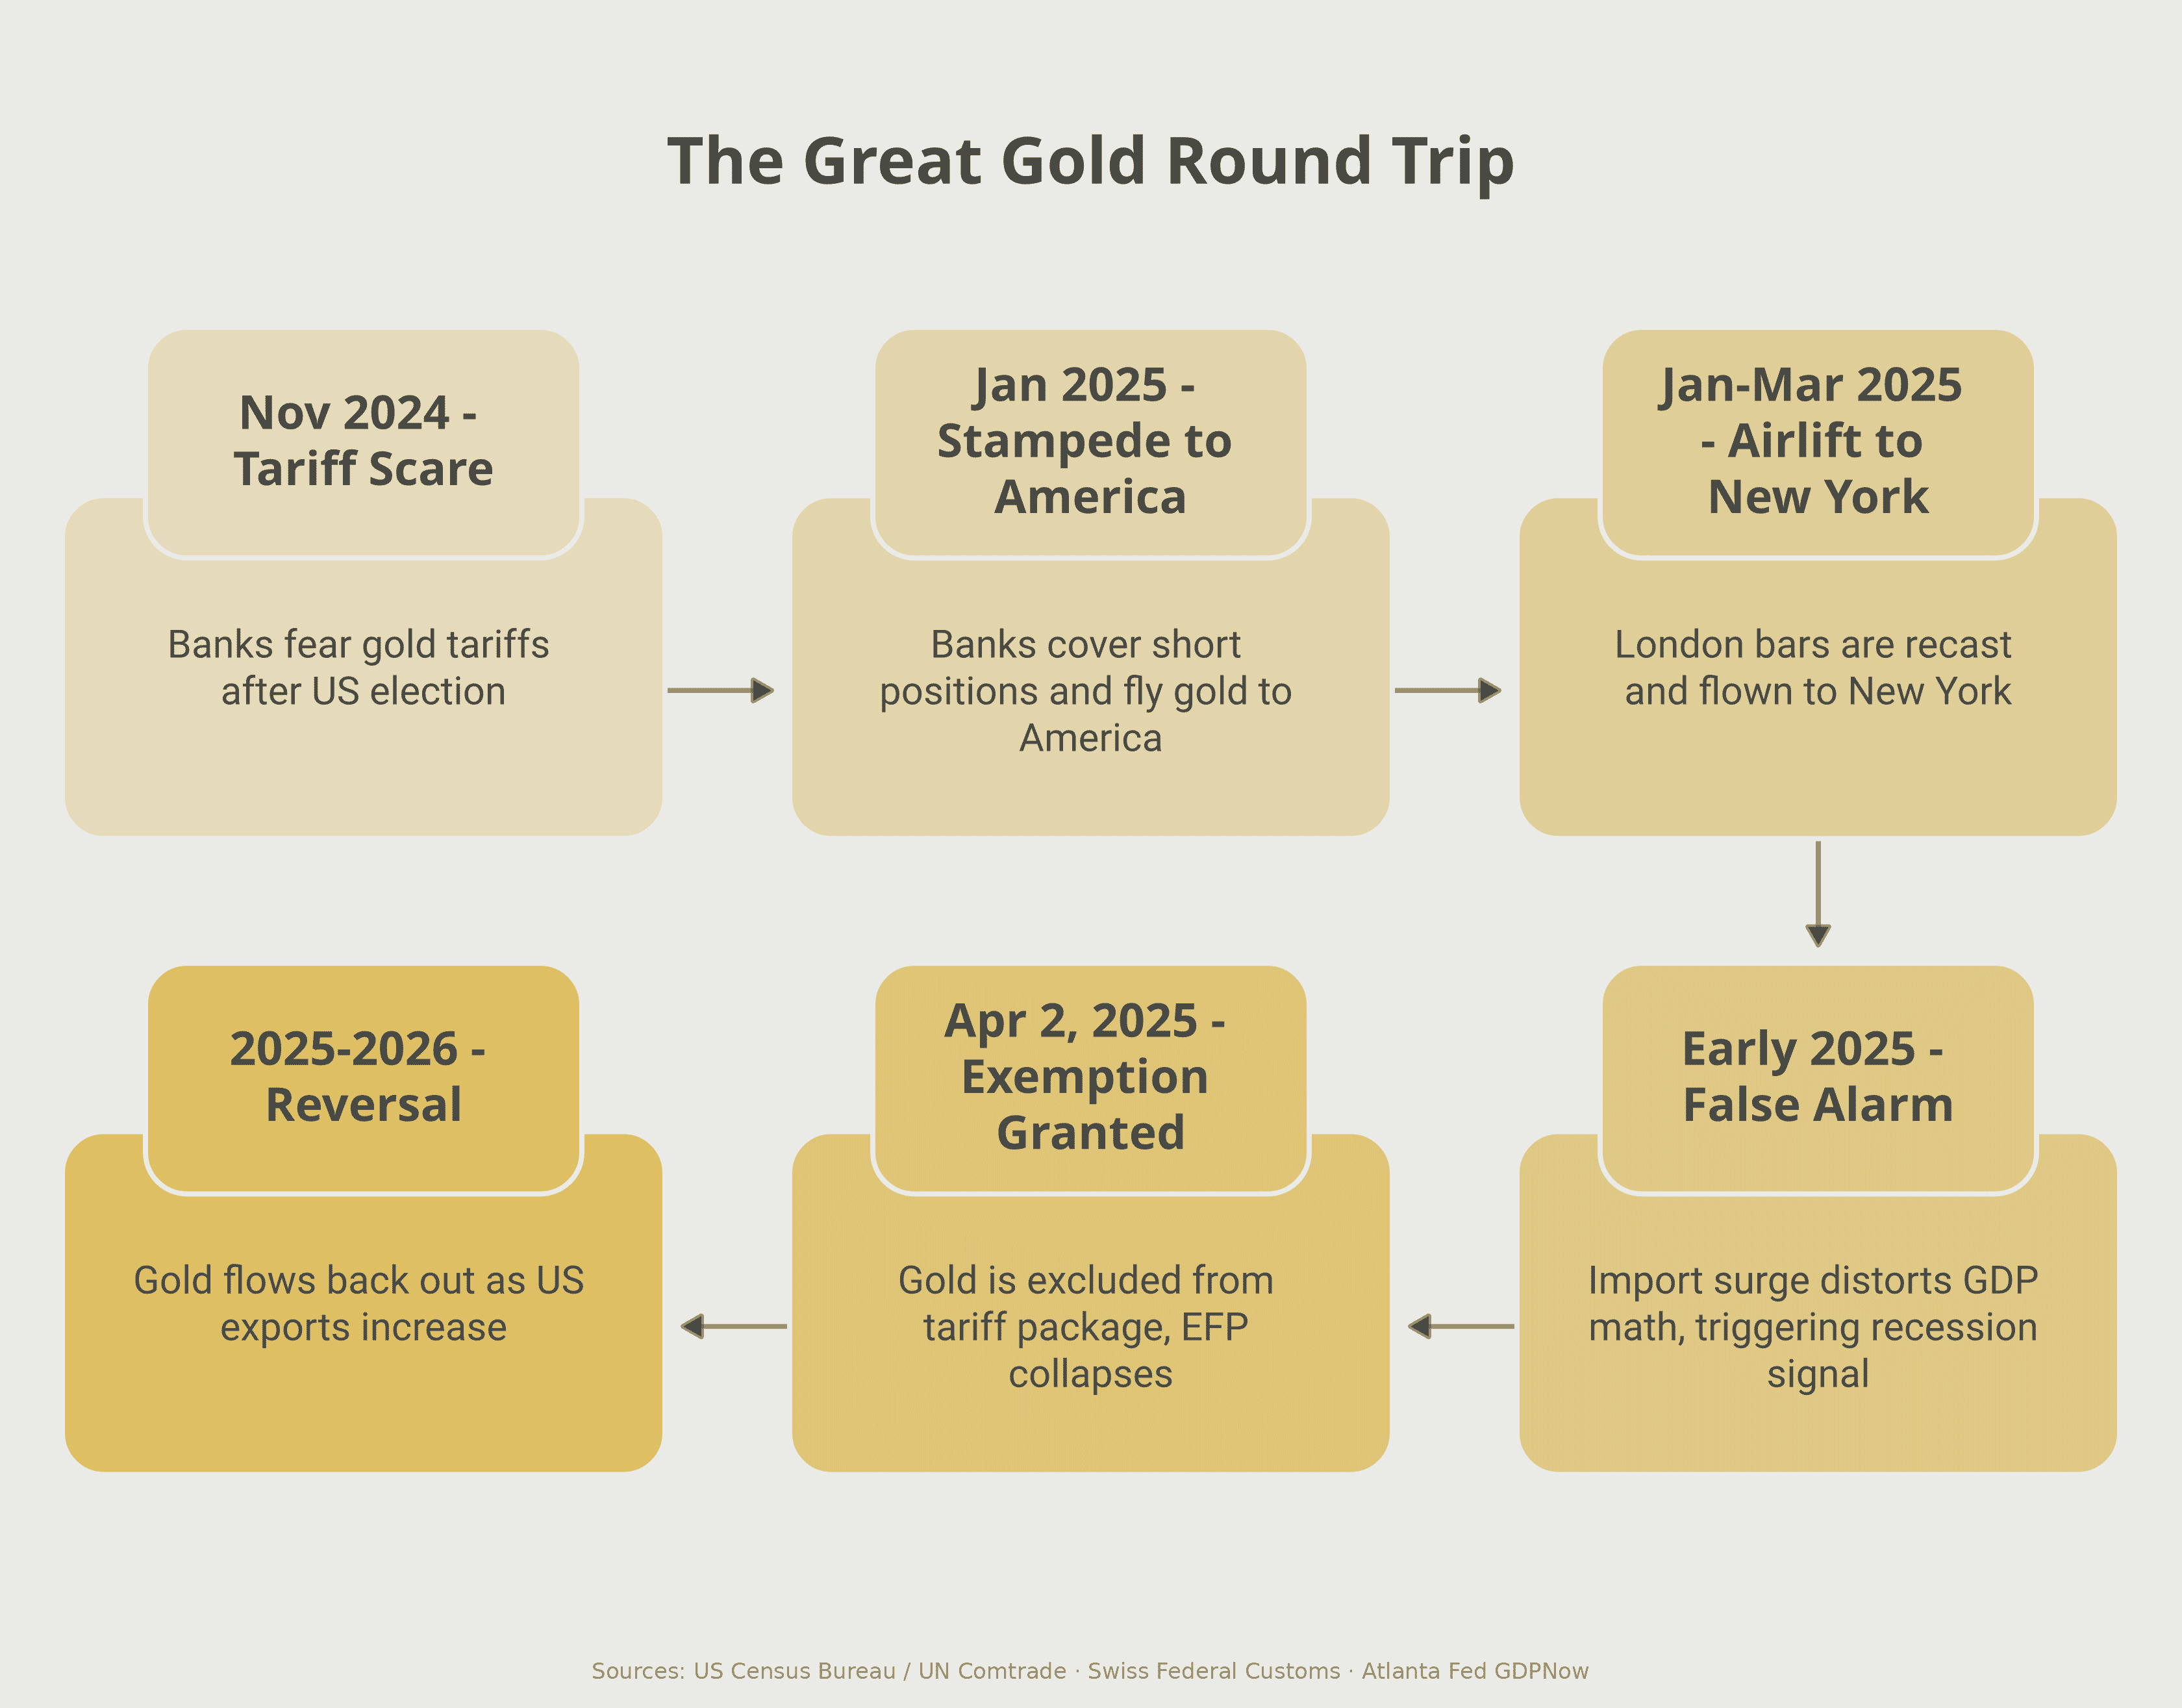
The story begins in late 2024, after the US election. Global banks run their bullion books as a two-legged trade: physical gold held in London, offset by short futures positions in New York. The whole structure assumes gold can move freely between the two cities, and that their prices converge. The gap between them, called the EFP (Exchange for Physical), normally sits around $10 to $20 an ounce, roughly the cost of freight, storage and financing.
Then came the tariff talk. Nobody seriously expected gold to be tariffed; it is a financial asset, not a consumer good. But bank risk departments do not run on probabilities, they run on worst cases, and the worst case (owing physical delivery in New York against tariffed imports) was expensive enough to act on. Banks covered their New York shorts and started flying metal to America just in case. By mid-January 2025 the EFP had blown past $60 an ounce, and the arbitrage machine kicked in behind it: buy in London, sell in New York, pocket the spread.
There was one catch: London’s standard 400-ounce bars do not meet COMEX delivery specs. So the gold detoured through Swiss refineries to be melted and recast into 100-ounce bars, then flew on to vaults near JFK. Swiss customs recorded a 13-year high in gold exports to the US in January 2025; US gold imports hit roughly $32.6 billion that month, and COMEX warehouse inventories ballooned from 17.1 million to 43.3 million troy ounces in four months, a 153% jump. All told, an estimated $135 billion of physical gold crossed the Atlantic because of a policy that existed only as a rumor.
The False Recession
The stampede had a famous side effect. Imports subtract from GDP in the accounting, and the Atlanta Fed’s closely watched GDPNow model had never needed special handling for gold, historically a rounding error. In early 2025 the model read the bullion pile-up as a collapsing economy and flashed -2.8% for the first quarter, setting off a wave of recession headlines. Reality: Q1 2025 GDP came in around -0.3% to -0.5%. In April 2025 the Atlanta Fed rewrote GDPNow’s methodology to strip gold flows out, the first time a single commodity forced a change to the model’s core logic.
The Reversal: How Records Were Born
On April 2, 2025, the tariff package landed and the exemption list said it plainly: gold and precious metals excluded. The EFP collapsed from above $60 to about $20 overnight. Swiss shipments to the US fell from 103.3 tonnes in March to 12.7 tonnes in April, while Swiss imports from the US jumped from 25.5 to 63 tonnes. The mountain of metal that had piled up in New York for nothing began flowing back to the London-Zurich hub, and every ounce of it now counted as a US export. That is the engine behind the 2025 export explosion on the chart above.
2026: The Second Wave Is Different
If this were only an unwind, the records would fade as the excess inventory drained. Instead, exports set fresh records in early 2026, and the mix of buyers changed: Hong Kong overtook the UK as the second-largest destination in February 2026. Analysts see two flows in the same statistics: arbitrage gold still returning to Europe, and a structural one, Asian and Middle Eastern buyers taking physical delivery as a long-term allocation, with gold prices at repeated record highs.
Meanwhile the uncertainty that started everything has not gone away, it has mutated. In February 2026 the Supreme Court struck down most of the tariffs imposed under the IEEPA emergency powers; the administration answered with a blanket 10% tariff on all imports and signals it could go higher. As long as the rules keep shifting, the bullion market keeps pricing the risk, and the gold keeps moving. Watch three public numbers if you want to see the next chapter early: COMEX warehouse inventories, Swiss monthly customs data, and the gap between London spot and New York futures. They told this whole story months before the headlines did.
Sources: