Key Takeaways
- Two models dominate rich-world healthcare. Of the 22 high-income OECD systems analysed by IPPR, 12 are tax-funded 'Beveridge' systems (the UK, Italy, Spain, Canada, Australia and the Nordics) and 9 are payroll-based 'Bismarck' social health insurance systems (France, Germany, the Netherlands, Japan). The United States is the odd one out with its mixed system.
- No clear winner. There is no evidence that social health insurance systems outperform tax-funded ones, or vice versa. Performance varies more within each model than between them, and the best tax-funded systems (mostly Scandinavian) match or beat the best insurance systems.
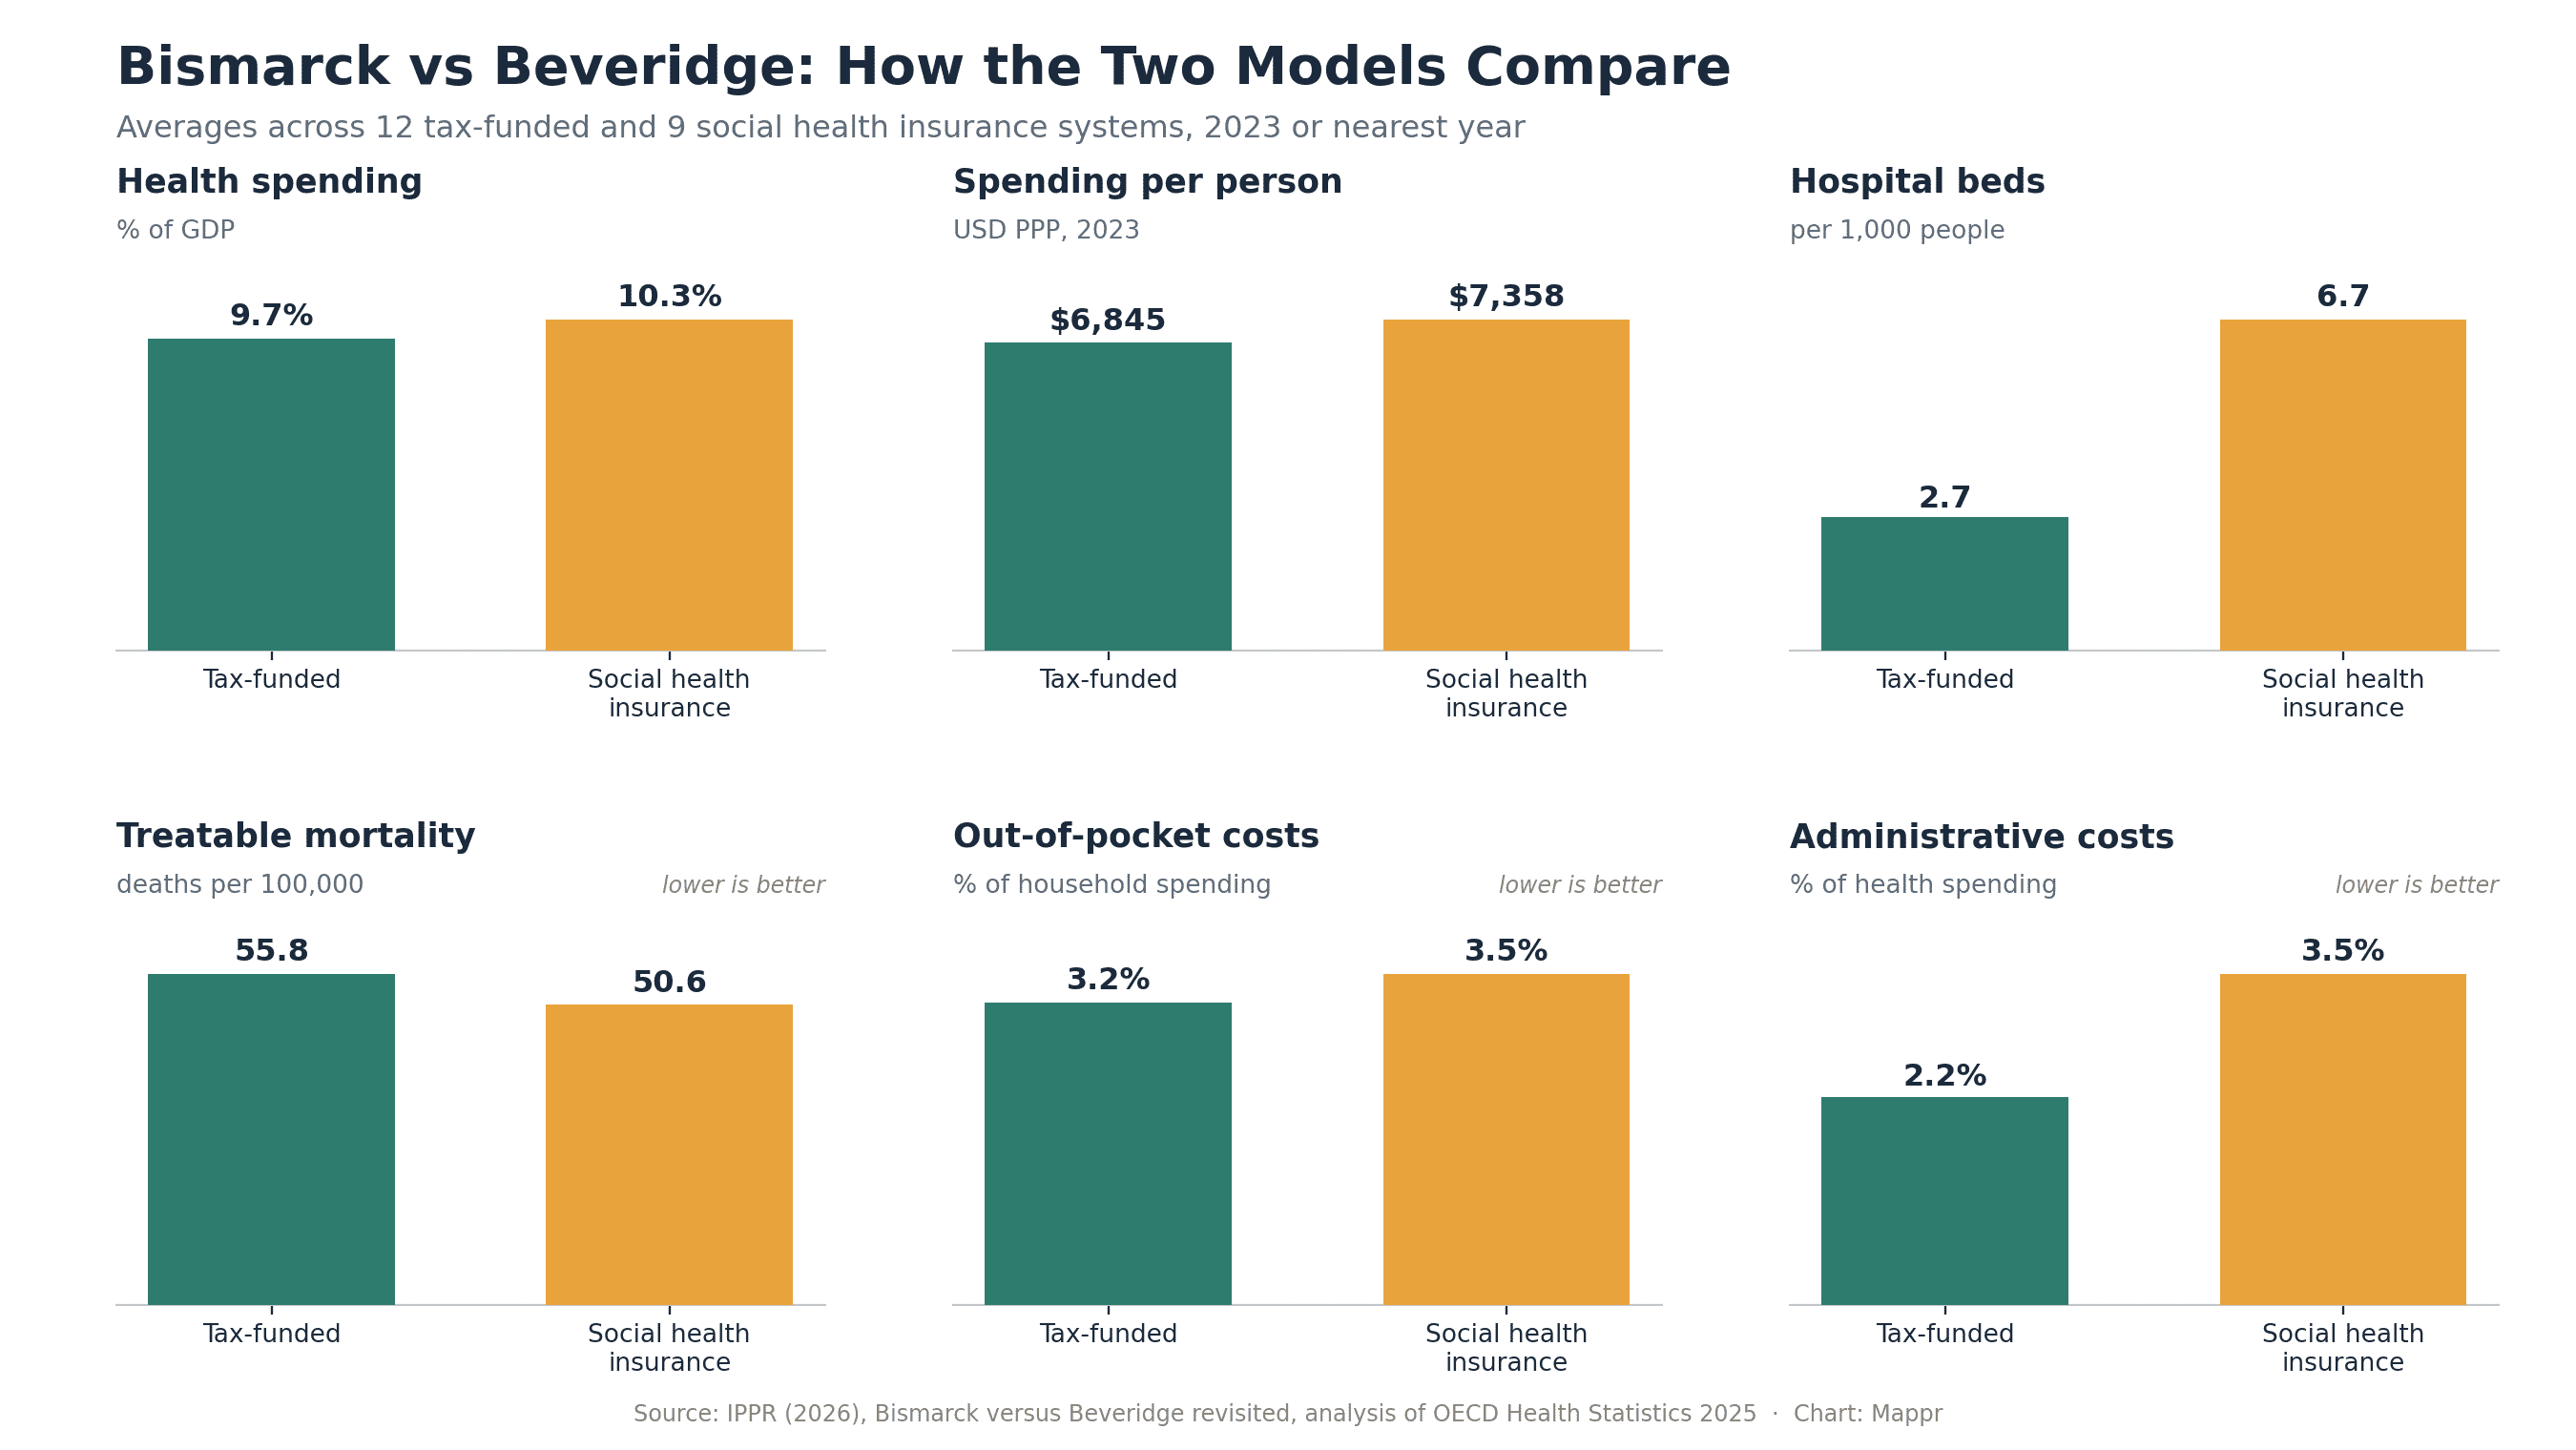
- Insurance systems buy more capacity. Social health insurance systems spend more (10.3% of GDP vs 9.7%; $7,358 vs $6,845 per person) and run more than double the hospital beds (6.7 vs 2.7 per 1,000 people), which shows up as faster access to specialists.
- Tax-funded systems win on equity and admin. Households in tax-funded systems pay less out of pocket (3.2% vs 3.5% of household spending) and administration eats far less of the budget (2.2% vs 3.5%). The UK's admin share is just 1.4%, among the lowest anywhere.
- Countries almost never switch. Wholesale funding-model transitions are rare outside political upheaval, like Spain after Franco. The Dutch insurance reform took roughly three decades, and even the 2012 English NHS reorganisation, which changed no funding model at all, cost an estimated £1.5 billion.
Ask ten people how a country should pay for healthcare and you will usually get two answers: through taxes, like the British NHS, or through insurance, like Germany. Those two answers have names. The “Beveridge” model, named after the 1942 report by British economist William Beveridge that led to the NHS in 1948, funds care from general taxation. The “Bismarck” model traces back to Otto von Bismarck’s sickness insurance law of 1883, which built healthcare on compulsory payroll contributions collected by independent sickness funds.
Nearly 150 years later, virtually every rich country still runs on one of those two chassis. And the debate about which one is better has flared up again, especially in Britain, where politicians periodically point across the Channel to France or Germany and ask whether social insurance would fix the NHS.
A new report from the Institute for Public Policy Research (IPPR), Bismarck versus Beveridge revisited (April 2026), takes that question seriously. It compares 22 high-income OECD health systems across five domains: capacity, access, equity, quality and efficiency. We mapped its classification and pulled out the numbers that matter. The headline: the funding model is not destiny. Neither system consistently beats the other, and the differences within each camp are bigger than the differences between them.
Two Models, One Map
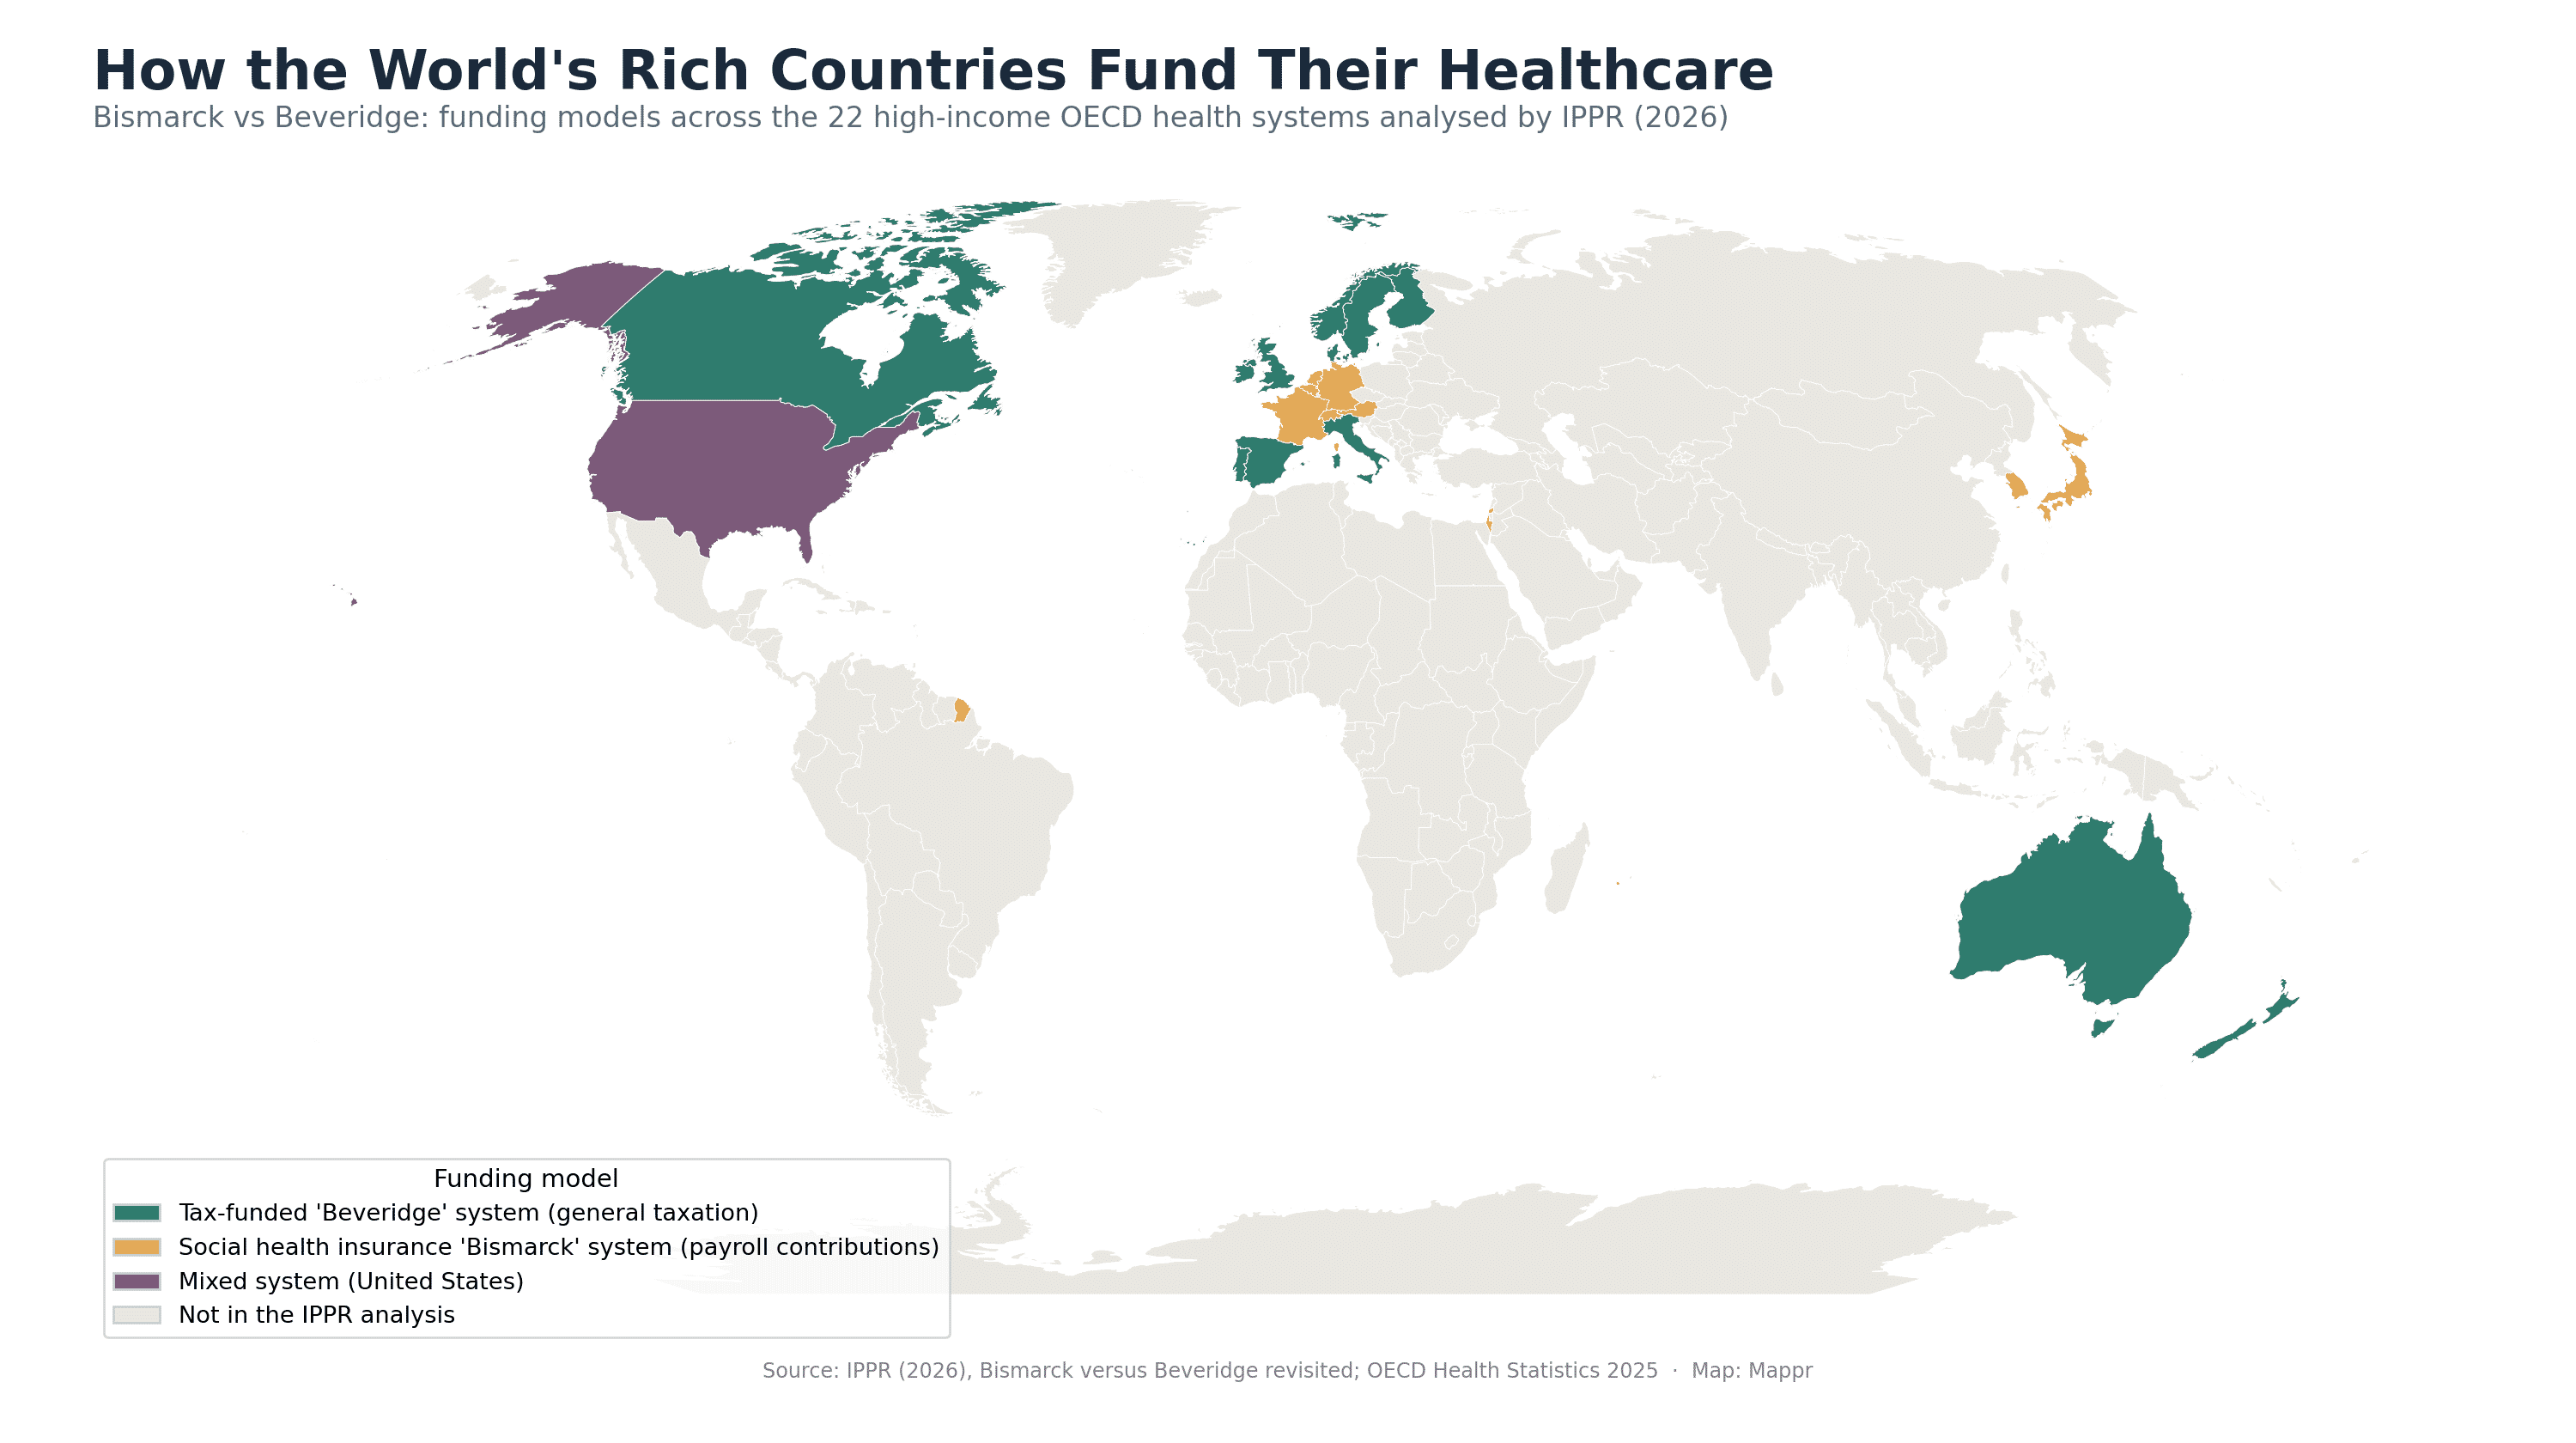
The map splits the rich world into two blocs. The tax-funded camp covers the UK, Ireland, the Nordics (Denmark, Finland, Norway, Sweden), southern Europe (Italy, Spain, Portugal), plus Canada, Australia and New Zealand. The social insurance camp runs through the middle of Europe (Germany, France, the Netherlands, Belgium, Austria, Switzerland) and extends to Israel, Japan and South Korea. The United States sits alone in a third category: a mix of tax funding (Medicare, Medicaid), employer-based private insurance and heavy out-of-pocket payment.
| Funding model | Countries in the IPPR analysis |
|---|---|
| Tax-funded (Beveridge) | Australia, Canada, Denmark, Finland, Ireland, Italy, New Zealand, Norway, Portugal, Spain, Sweden, United Kingdom |
| Social health insurance (Bismarck) | Austria, Belgium, France, Germany, Israel, Japan, Netherlands, South Korea, Switzerland |
| Mixed (other) | United States |
Beyond the OECD, the picture blurs. Most middle-income countries run hybrids (Thailand and Taiwan built celebrated national health insurance schemes; many Latin American systems mix social security funds with public providers), while in much of the developing world the dominant “funding model” is still the patient’s own wallet, with out-of-pocket payments covering a large share of care. The IPPR analysis deliberately sticks to 22 comparable high-income systems, and so does our map.
Bismarck vs Beveridge: What Is the Difference?
| Beveridge (tax-funded) | Bismarck (social health insurance) | |
|---|---|---|
| Where the money comes from | General taxation | Earmarked payroll contributions split between employers and employees |
| Who is covered | Everyone, by residency or citizenship | Everyone, through mandatory enrolment with an insurer or sickness fund |
| Who pays providers | The state, which often owns hospitals directly | Multiple insurers, which contract private or non-profit providers |
| Role of the state | Strong: plans budgets and services centrally or regionally | Referee: defines the benefits package and regulates the insurers |
| Archetypes | UK NHS, Nordic systems, Spain, Italy | Germany, France, the Netherlands, Japan |
In practice, no system is a pure type. Beveridge-model Sweden charges small user fees; Bismarck-model Germany funds hospital construction from state taxes; France created a tax on broader income precisely because payroll contributions alone could not keep up. The labels describe where the bulk of the money comes from and who controls it, not a rigid design.
Even within the social insurance family the differences are huge. France has effectively a single dominant insurer and a strong state that sets prices. The Netherlands has multiple competing not-for-profit insurers and a state that mostly referees the market. Germany sits in between, with self-governing sickness funds negotiating collectively with providers, and higher earners allowed to opt out into private insurance entirely.
So Which Model Works Better?
The honest answer from the data: it depends what you value. Here is how the two camps compare on the five domains IPPR tested, using 2023 OECD data (or the nearest available year).
Capacity: advantage Bismarck
Social insurance systems spend more (10.3% of GDP vs 9.7%; $7,358 vs $6,845 per person, adjusted for purchasing power) and hold far more physical capacity: 6.7 hospital beds per 1,000 people against 2.7 in tax-funded systems, and 68 vs 50 CT, MRI and PET scanners per million (Japan alone runs 184). One caveat: more beds and machines are not automatically better, and can drive unnecessary hospitalisation and over-testing.
Access: advantage Bismarck, with caveats
Users of insurance systems are more satisfied with access to quality care (77.7% vs 64.7%) and report less unmet medical need (1.5% vs 3.8%), though Finland and Canada drag the tax-funded average down almost single-handedly. Waits for specialists show the clearest gap: 24.3% of insurance-system patients wait more than two months for a specialist appointment, versus 36.7% in tax-funded systems; for elective surgery it is 23.4% vs 44.8%. GP access flips the other way in some places: the UK actually beats France and Germany on the share of patients seeing a GP within a week.
Equity: advantage Beveridge
Tax-funded systems raise money in proportion to ability to pay and charge less at the point of use. Households in them spend 3.2% of their budgets on healthcare out of pocket, vs 3.5% under social insurance, and only 33.7% need voluntary extra insurance, against 61.4% in insurance systems (in the UK, just 12%). Britain is a standout on billing: far fewer patients report problems paying medical bills or fighting insurers than in any comparator, of either type.
Quality: a draw
On treatable mortality (deaths that timely care should prevent), insurance systems average 50.6 deaths per 100,000 and tax-funded systems 55.8, a modest gap. Thirty-day mortality after a heart attack is slightly better in tax-funded systems (5.02 vs 5.94 deaths per 100 admissions), and they also see fewer avoidable hospital admissions for diabetes and heart failure. The UK, for the record, does badly here regardless of camp: 71 treatable deaths per 100,000, second worst in the basket, ahead of only the United States (95).
Efficiency: advantage Beveridge
The clearest structural difference of all is administration. Insurance systems, with their multiple payers, contracts and claims processing, spend 3.5% of their health budgets on admin and governance; tax-funded systems spend 2.2%, and the NHS just 1.4%. Matching the average insurance system would cost the UK an extra £7 billion a year in overheads alone. Hospital stays are also shorter in tax-funded systems (6.4 vs 7.2 days on average).
Why Countries Almost Never Switch
If the models roughly tie, could a struggling system at least shake things up by switching? History says: almost nobody does. Wholesale transitions between funding models are so rare that the textbook example is Spain moving from social insurance to a tax-funded system after Franco’s dictatorship ended, a moment of total political rupture.
The most instructive modern case is the Netherlands, which converted a hybrid insurance system into regulated competition between private not-for-profit insurers. That reform started in 1987 and was not fully complete until the early 2010s, roughly three decades, despite building on insurer infrastructure that already existed. Dutch health economists’ verdict on the results is mixed at best, and Dutch policy is now drifting back towards state coordination rather than competition.
Even reorganisations far short of a model switch are expensive. England’s 2012 NHS reforms, which left the funding model untouched, cost an estimated £1.5 billion and were described by Lord Darzi as “a calamity without international precedent.” The OECD’s dry conclusion: big-bang health reforms should be “designed and implemented with caution.”
What Actually Matters
Across 22 countries, the pattern IPPR finds is less about models and more about money and follow-through: countries broadly get what they pay for. Higher-spending systems have more capacity and better access, whatever the funding mechanism. The Scandinavian tax-funded systems match the best insurance systems on most measures while keeping the equity advantages of taxation.
For the UK specifically, the report points at four fixes that have nothing to do with switching models: sustained capital investment (NHS capital formation is 0.4% of GDP, about half the comparator average), a genuine shift toward primary and community care, serious funding for social care (the Netherlands spends roughly three times as much per person as the UK), and a bigger bet on public health, where an extra year of healthy life costs around £3,800 to generate, versus roughly £13,500 through NHS treatment.
That lesson travels. The funding model a country inherited in the 1880s or 1940s matters far less than how much it invests, where it targets that investment, and whether it can resist the temptation of perpetual reorganisation. On the evidence, Bismarck and Beveridge fight to a draw; underfunding beats both.
Sources: