Key Takeaways
- South Korea is far and away #1. Koreans filed about 3,696 resident patent applications per million people in 2023 — twice Japan's rate and more than four times the United States'.
- East Asia dominates. South Korea and Japan take the top two per-capita spots, with China close behind — patent intensity is heavily concentrated in East Asia.
- China's decade-long surge. China's resident filings per capita more than doubled since 2013 (517 → 1,079), overtaking the US and Germany. By sheer volume China files more patents than the rest of the world combined.
- Switzerland leapfrogs into the top three. At 1,212 per million, Switzerland now ranks 3rd — just ahead of China — powered by its pharma and precision-engineering base.
- Several Western leaders are slipping. Per-capita filing fell over the decade in Japan, the US, Germany, the UK and Russia, even as the small Nordic and Alpine economies held strong.
Which countries invent the most, relative to their size? A good proxy is resident patent applications per capita — how many patents people file at their own national office, per million population. It measures innovation intensity rather than raw scale, and in 2023 the leaderboard was dominated by a familiar cluster of East Asian and European economies.
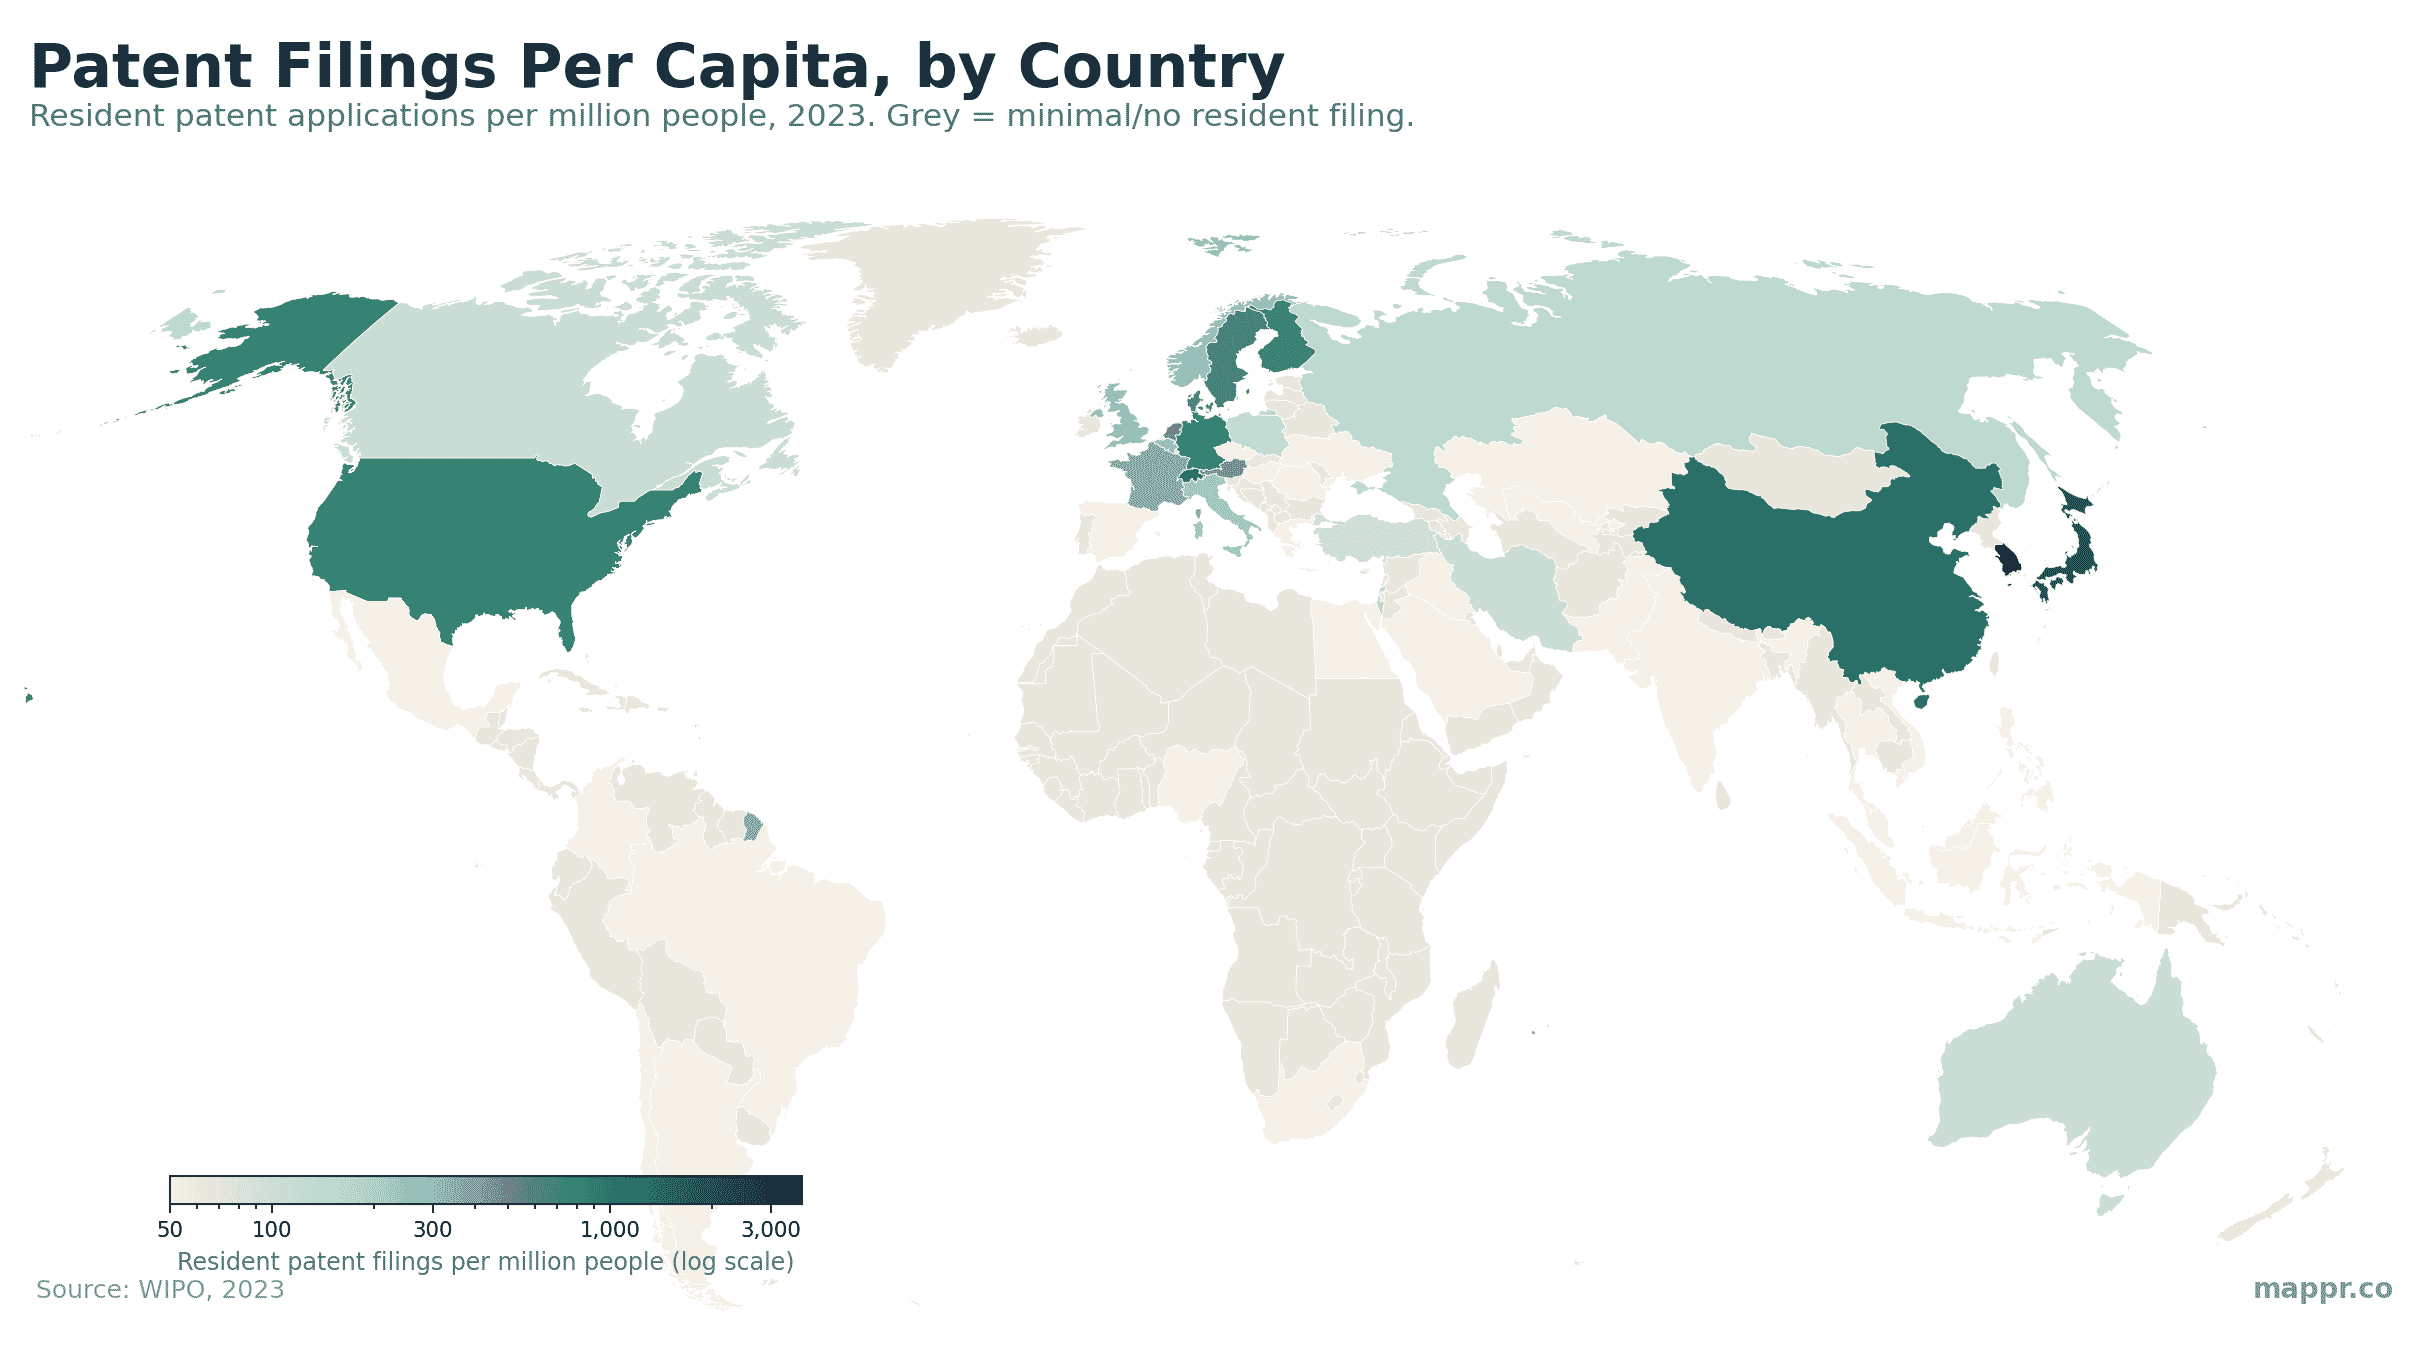
Patent filings per capita, mapped
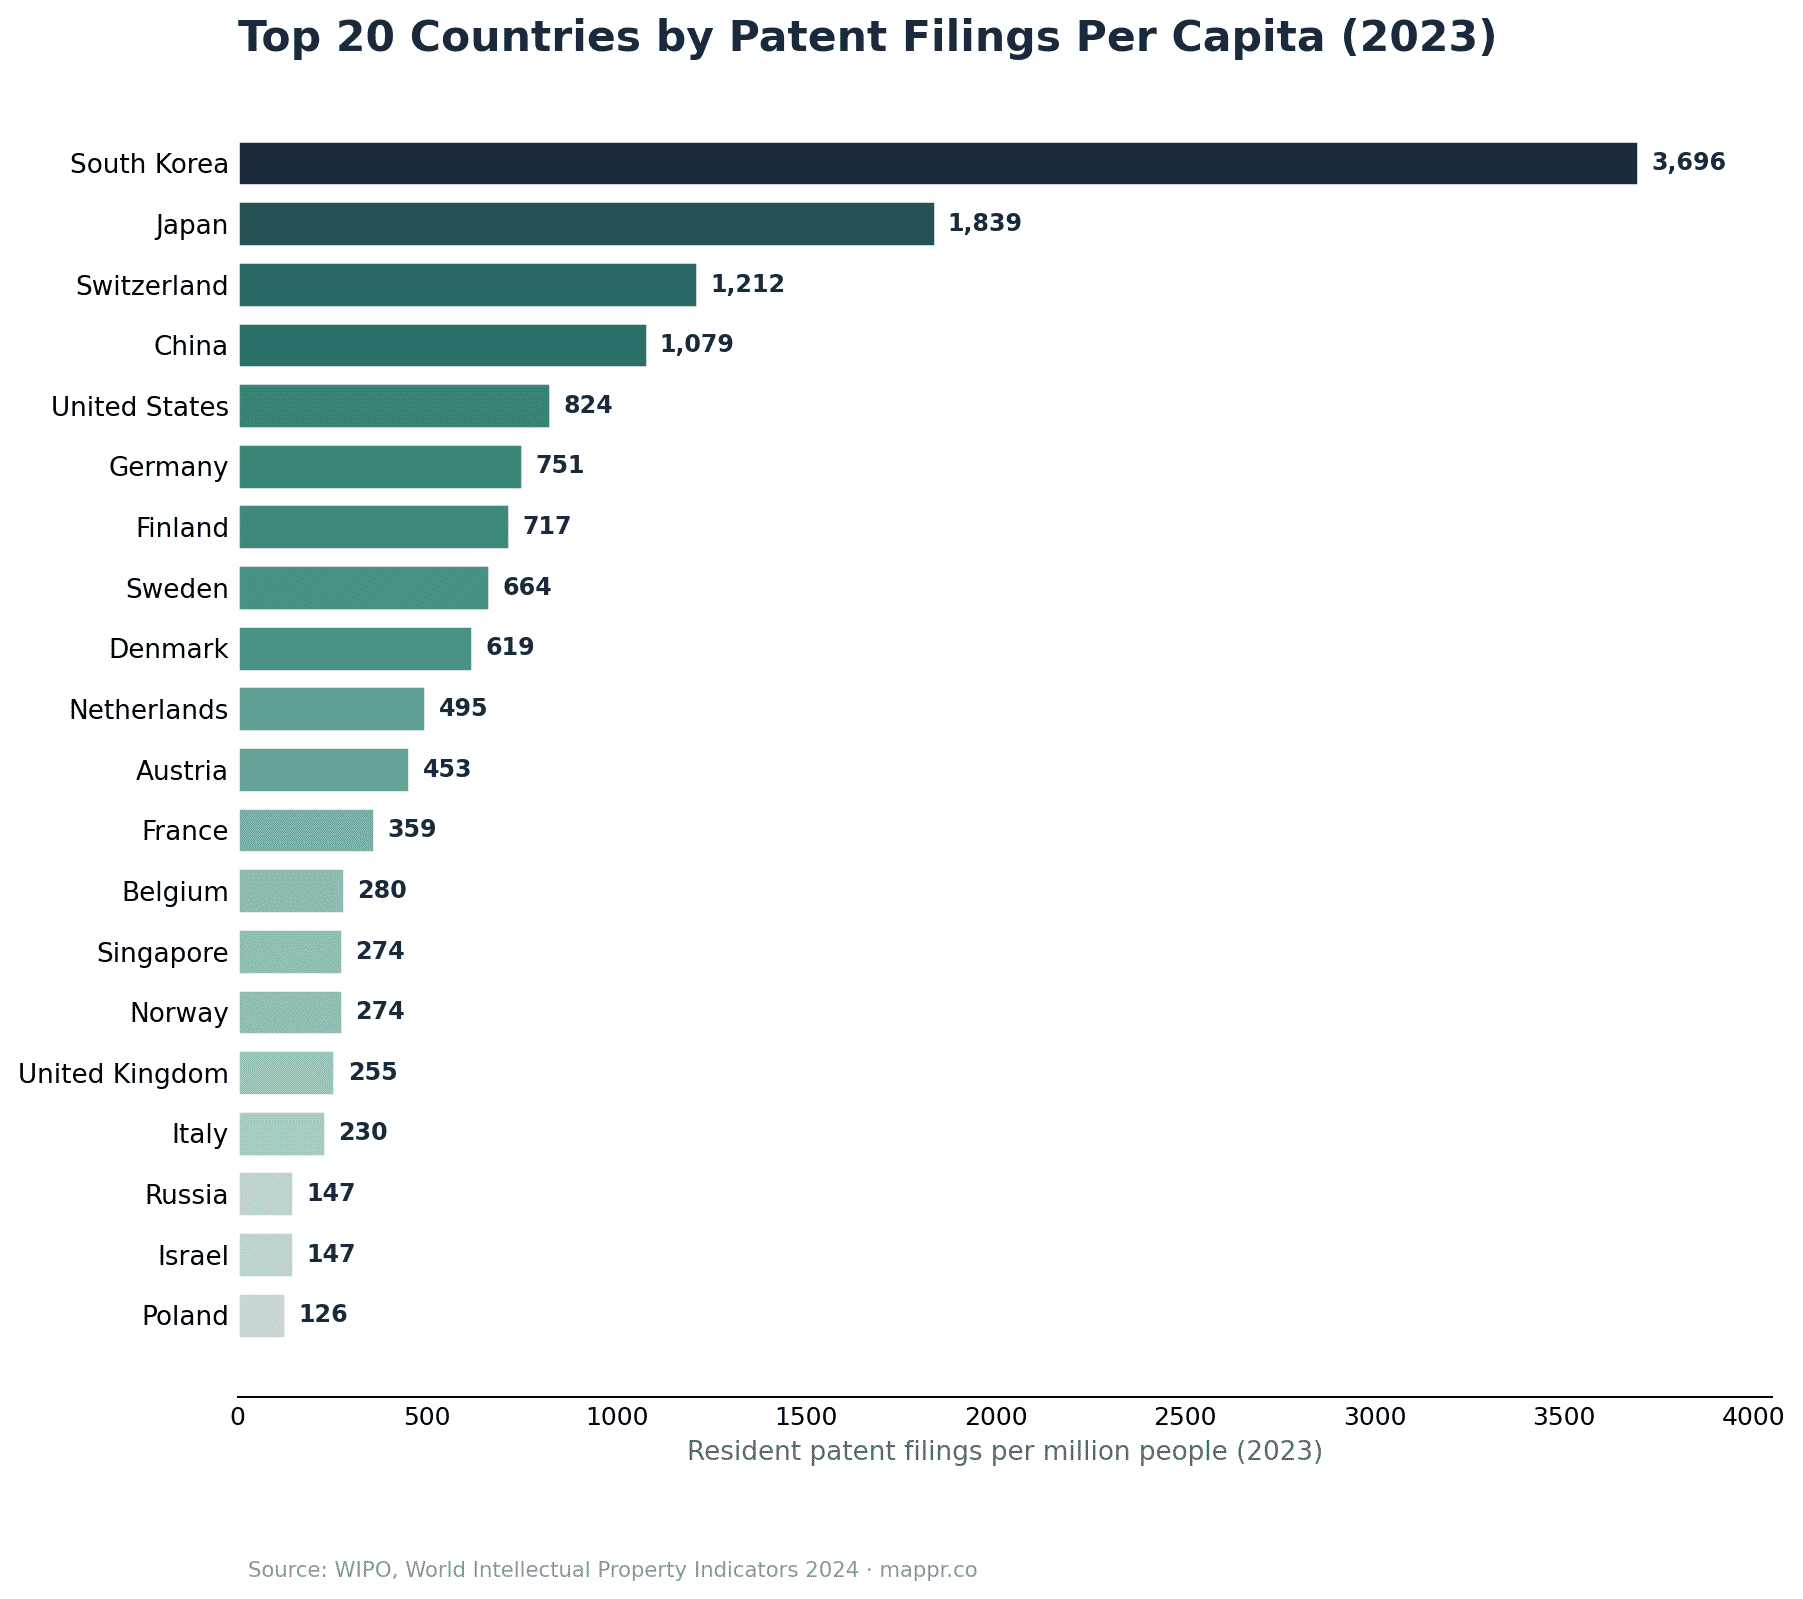
The top 20 countries (2023)
South Korea is in a league of its own, filing roughly 3,696 resident patents per million people — about twice Japan‘s rate (1,839) and far ahead of Switzerland (1,212), China (1,079) and the United States (824). Below the leaders, the ranking is full of small, research-intensive economies: Finland, Sweden, Denmark, the Netherlands and Austria.
| # | Country | Per million (2023) | Per million (2013) | Trend |
|---|---|---|---|---|
| 1 | South Korea | 3,696 | 3,172 | ▲ |
| 2 | Japan | 1,839 | 2,132 | ▼ |
| 3 | Switzerland | 1,212 | 1,012 | ▲ |
| 4 | China | 1,079 | 517 | ▲ |
| 5 | United States | 824 | 911 | ▼ |
| 6 | Germany | 751 | 917 | ▼ |
| 7 | Finland | 717 | 642 | ▲ |
| 8 | Sweden | 664 | 625 | ▲ |
| 9 | Denmark | 619 | 583 | ▲ |
| 10 | Netherlands | 495 | 485 | ■ |
| 11 | Austria | 453 | 491 | ▼ |
| 12 | France | 359 | 372 | ■ |
| 13 | Belgium | 280 | 233 | ▲ |
| 14 | Norway | 274 | 317 | ▼ |
| 15 | Singapore | 274 | 212 | ▲ |
| 16 | United Kingdom | 255 | 305 | ▼ |
| 17 | Italy | 230 | 200 | ■ |
| 18 | Israel | 147 | 149 | ■ |
| 19 | Russia | 147 | 203 | ▼ |
| 20 | Poland | 126 | 121 | ■ |
What changed since 2013
The decade tells two stories. China more than doubled its per-capita filing rate (517 → 1,079), and the small high-tech economies — Finland, Sweden, Denmark, Singapore, Belgium — pushed higher. Meanwhile several established leaders drifted down on a per-capita basis, including Japan (2,132 → 1,839), the United States (911 → 824), Germany (917 → 751), the UK and Russia. South Korea, already #1 in 2013, climbed even higher.
Per capita vs. total: China’s split picture
It’s worth separating volume from intensity. China files more patents than any other country — over 1.5 million resident applications in 2023, more than the next several countries combined. But spread across its enormous population, that works out to a per-capita rate just behind South Korea, Japan and Switzerland. The reverse is true for places like Switzerland and Finland: modest totals, but very high rates per person.
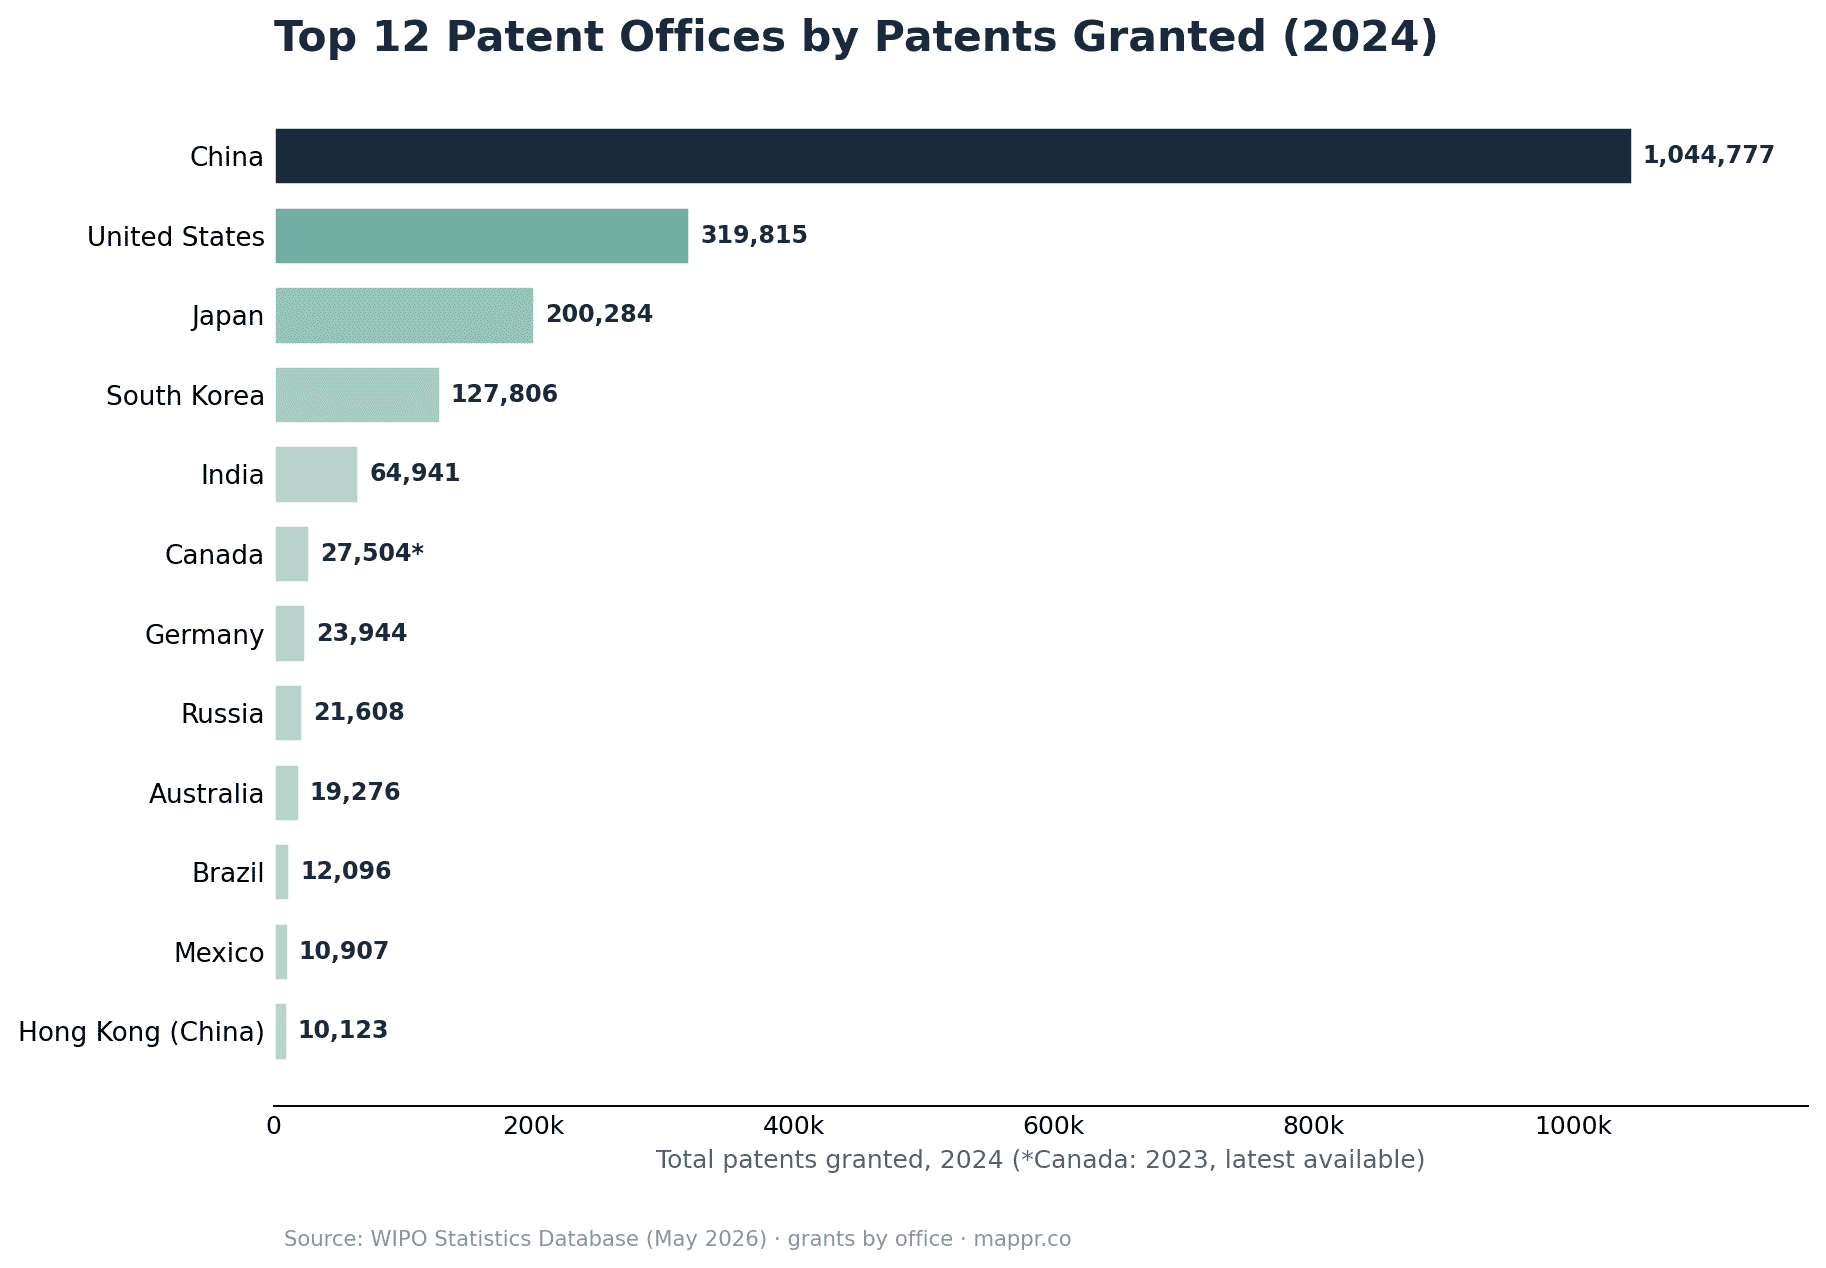
Total patents granted, by country
Applications are only half the story — what actually gets granted is the other half. Here the picture tilts even more sharply toward China, whose patent office granted nearly 1.05 million patents in 2024, more than three times the United States (319,815) and far ahead of Japan (200,284) and South Korea (127,806). India has surged into the top five. Note this counts grants issued by each office (to resident and foreign applicants alike), so it reflects the scale and throughput of national patent systems.
| # | Patent office | Granted (2024) | Granted (2023) |
|---|---|---|---|
| 1 | China | 1,044,777 | 920,797 |
| 2 | United States | 319,815 | 315,245 |
| 3 | Japan | 200,284 | 209,368 |
| 4 | South Korea | 127,806 | 134,734 |
| 5 | India | 64,941 | 76,053 |
| 6 | Canada | — | 27,504 |
| 7 | Germany | 23,944 | 22,363 |
| 8 | Russia | 21,608 | 23,406 |
| 9 | Australia | 19,276 | 15,573 |
| 10 | Brazil | 12,096 | 18,287 |
| 11 | Mexico | 10,907 | 10,471 |
| 12 | Hong Kong (China) | 10,123 | 10,866 |
| 13 | France | 9,581 | 10,105 |
| 14 | United Kingdom | 8,228 | 8,377 |
| 15 | Italy | 7,678 | 8,348 |
About the data
Figures are resident patent applications (patents filed by a country’s own residents at its national IP office) per million population, for 2023, from WIPO’s World Intellectual Property Indicators 2024 (figure A38). WIPO lists the top 20 origins meeting its thresholds (population over 5 million and more than 100 resident applications). The world map shades those leaders with 2023 values and fills remaining countries with the latest available figures; grey countries file very few or no resident patents. The colour scale is logarithmic because South Korea, Japan and China are such outliers. The patent-grants table and chart use total grants by office (direct plus PCT national-phase entries) from the WIPO Statistics Database (updated May 2026), latest year 2024.