Key Takeaways
- UAE leads the world at 70.1%. More than seven in ten working-age Emiratis used an AI tool for at least 90 minutes a month in Q1 2026 — a 6.1-point jump from H1 2025 and the largest absolute lead in any country.
- Singapore second at 63.4%. The two top countries are small, wealthy, English-friendly city-states with aggressive national AI strategies. The next-highest economy doesn't crack 50%.
- The U.S. ranks 21st, not 1st. American adoption at 31.3% sits outside the top 20 — behind every Western European country surveyed except Germany (#23) and Italy (#25). Home of the leading AI companies; not the leading user.
- 17.8% global adoption. Up from 16.3% in H2 2025 — about 1.5 percentage points per quarter. At that pace, half the world's working-age adults would be using AI regularly by late 2031.
- South Korea is the biggest mover. Korea jumped from 25.9% in H1 2025 to 37.1% in Q1 2026 — +11.2 points, the largest single-year gain in the dataset. Microsoft credits improved Korean-language AI capabilities.
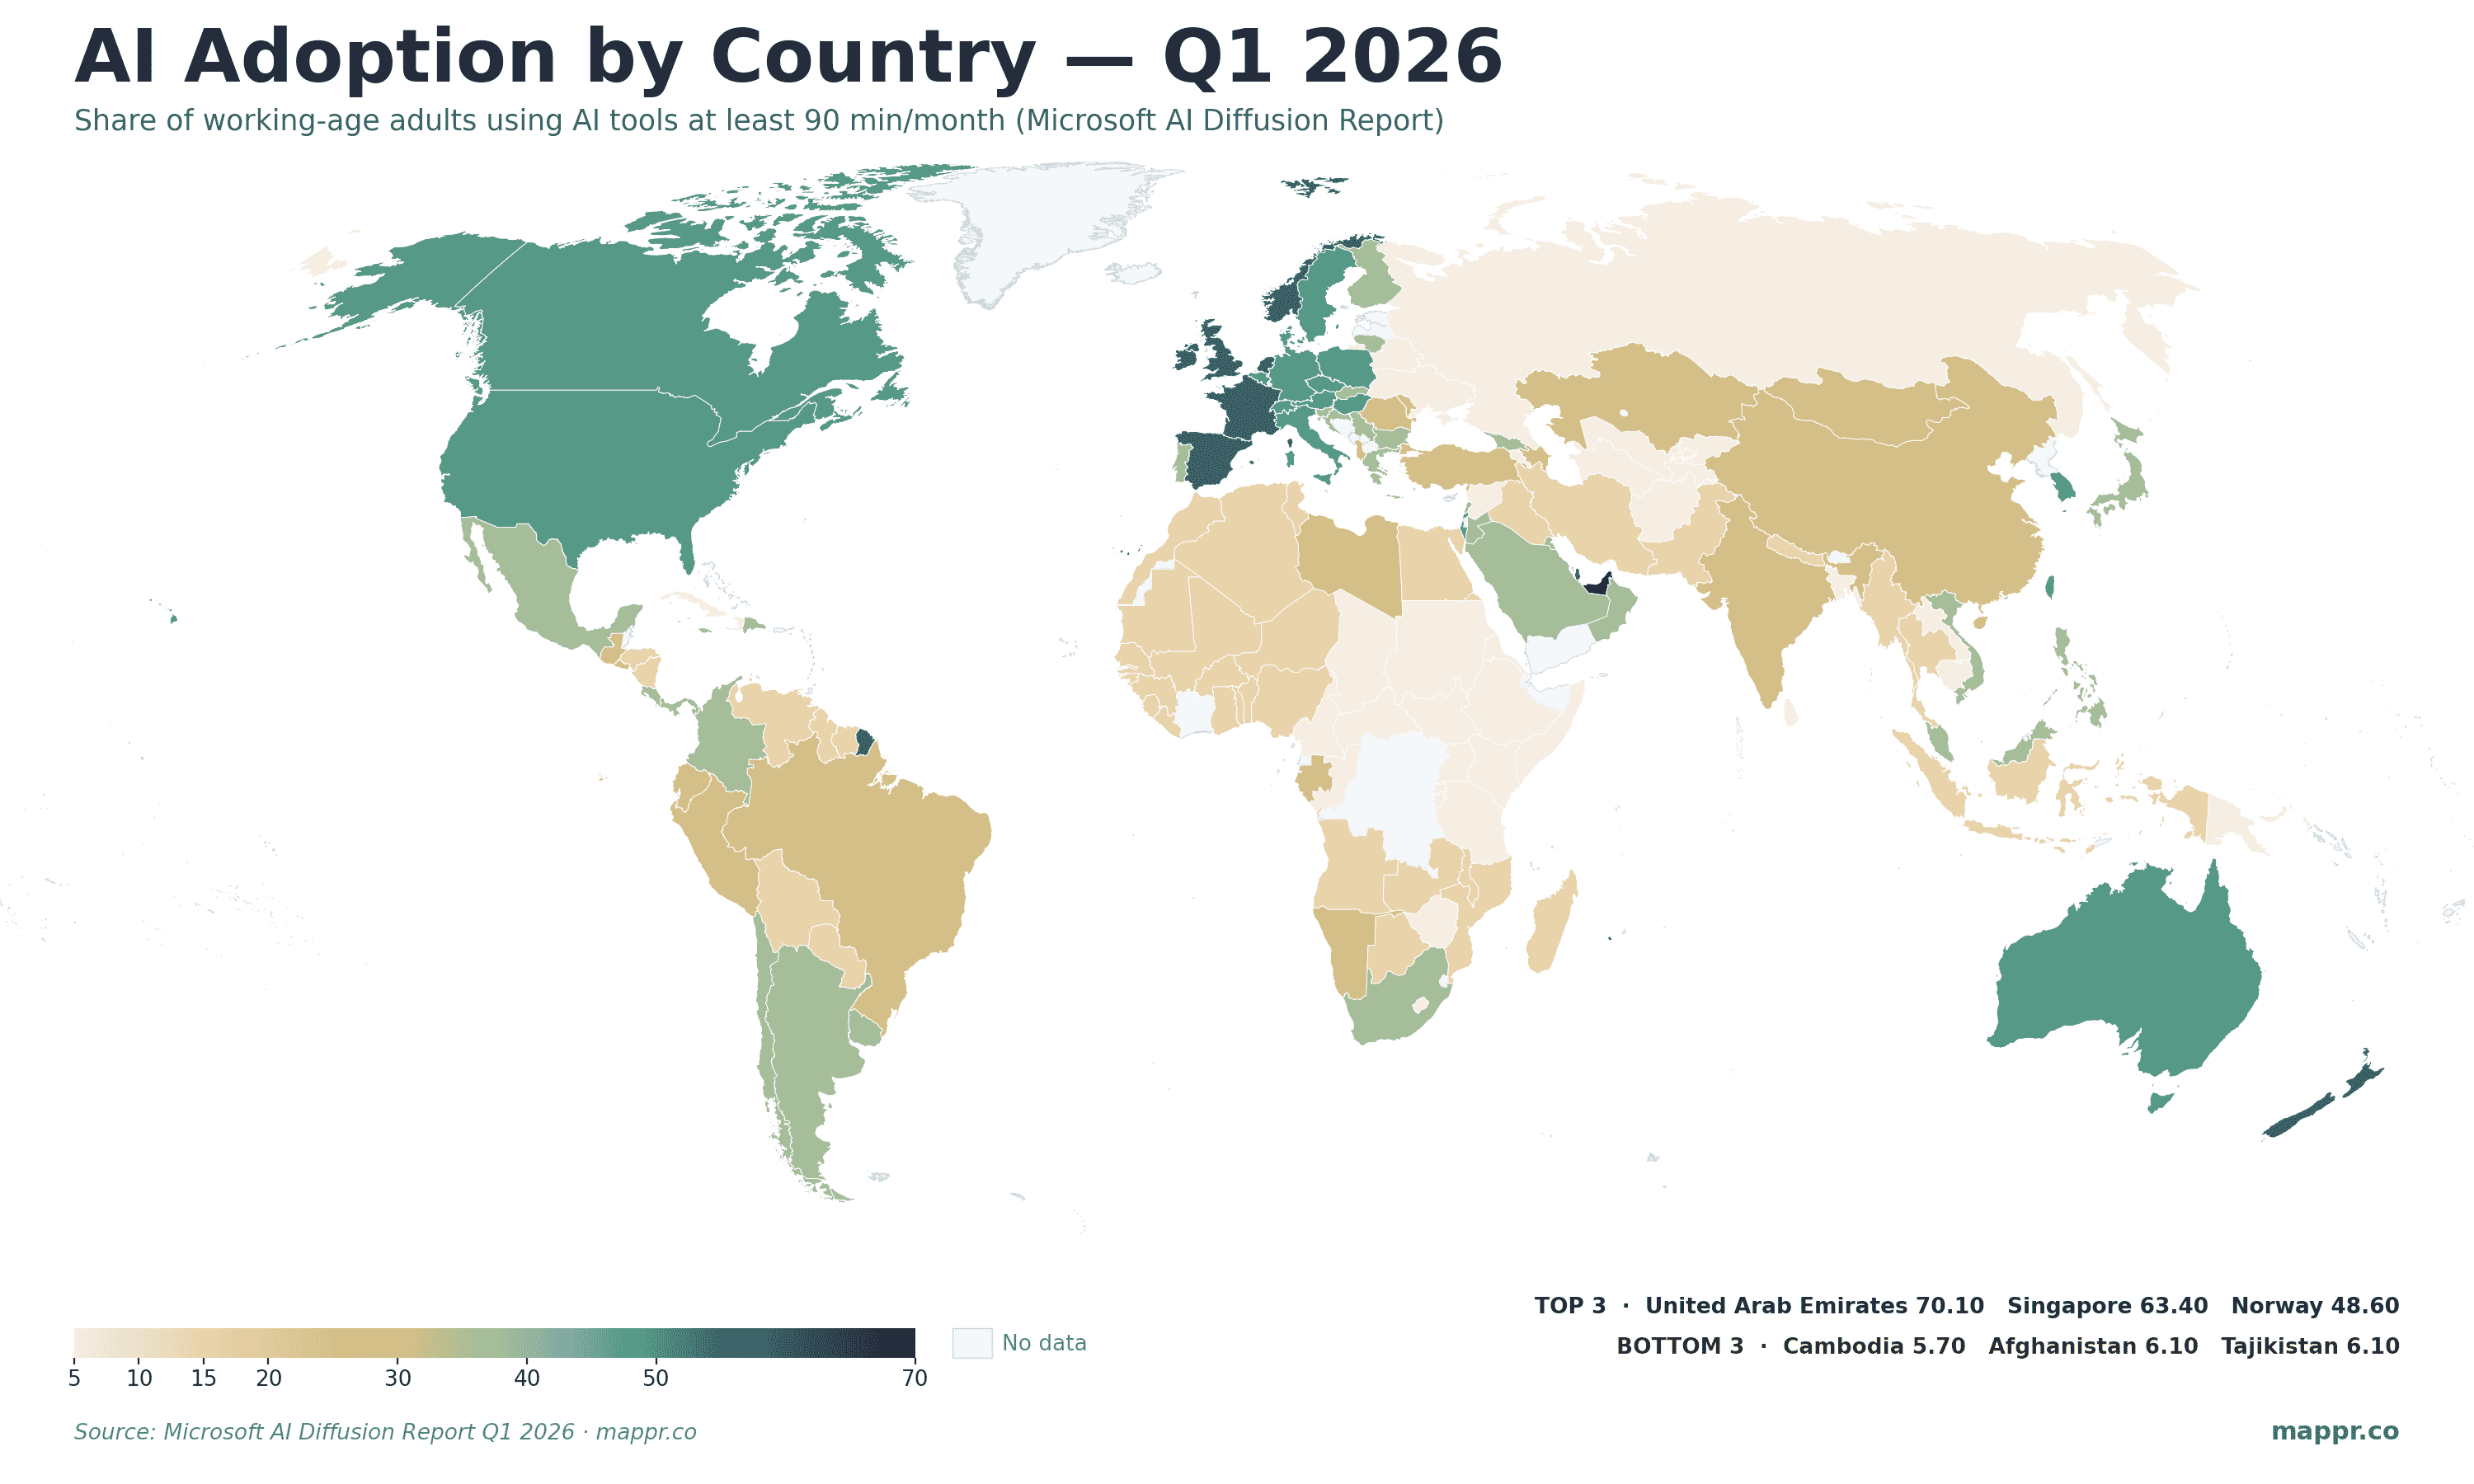
Microsoft’s AI Diffusion Report Q1 2026 tracks something most other AI rankings ignore: not who builds AI models, but who actually uses them. The headline measure is the share of each country’s working-age population (15–64) that used an AI tool — ChatGPT, Copilot, Gemini, Claude, or any other consumer or workplace AI — for at least 90 minutes in the trailing month.
By that measure, 17.8% of the world’s working-age population now uses AI regularly, up from 16.3% a quarter earlier. But the geographic distribution is dramatically uneven: a small cluster of countries has crossed 40% adoption while most of the world remains in single digits.
UAE and Singapore: the AI City-States
The top of the leaderboard is dominated by two small, wealthy city-states that have invested heavily in national AI strategies:
- UAE — 70.1%. The Emirates created the world’s first Ministry of AI in 2017 and have pushed adoption through government services, education, and corporate mandates. They also released their own open-weight Arabic LLM (Falcon) and partnered with Microsoft on a $1.5B+ investment. The 6.1-point jump in one quarter is the largest in the entire dataset.
- Singapore — 63.4%. A national AI strategy (NAIS 2.0, launched 2023) plus the AI Apprenticeship Programme has pushed AI use across the public sector and SMEs. Singapore’s English-language baseline and tech-forward workforce removed many of the friction points other countries face.
What both countries have in common: small populations, top-down digital policy, English as the working language of business, and concentrated investment in AI infrastructure. The next-largest economy in the top 10 is France at #5 — and France’s 47.8% is more than 22 points behind the UAE.
Europe Dominates the Top 20 — But America Doesn’t
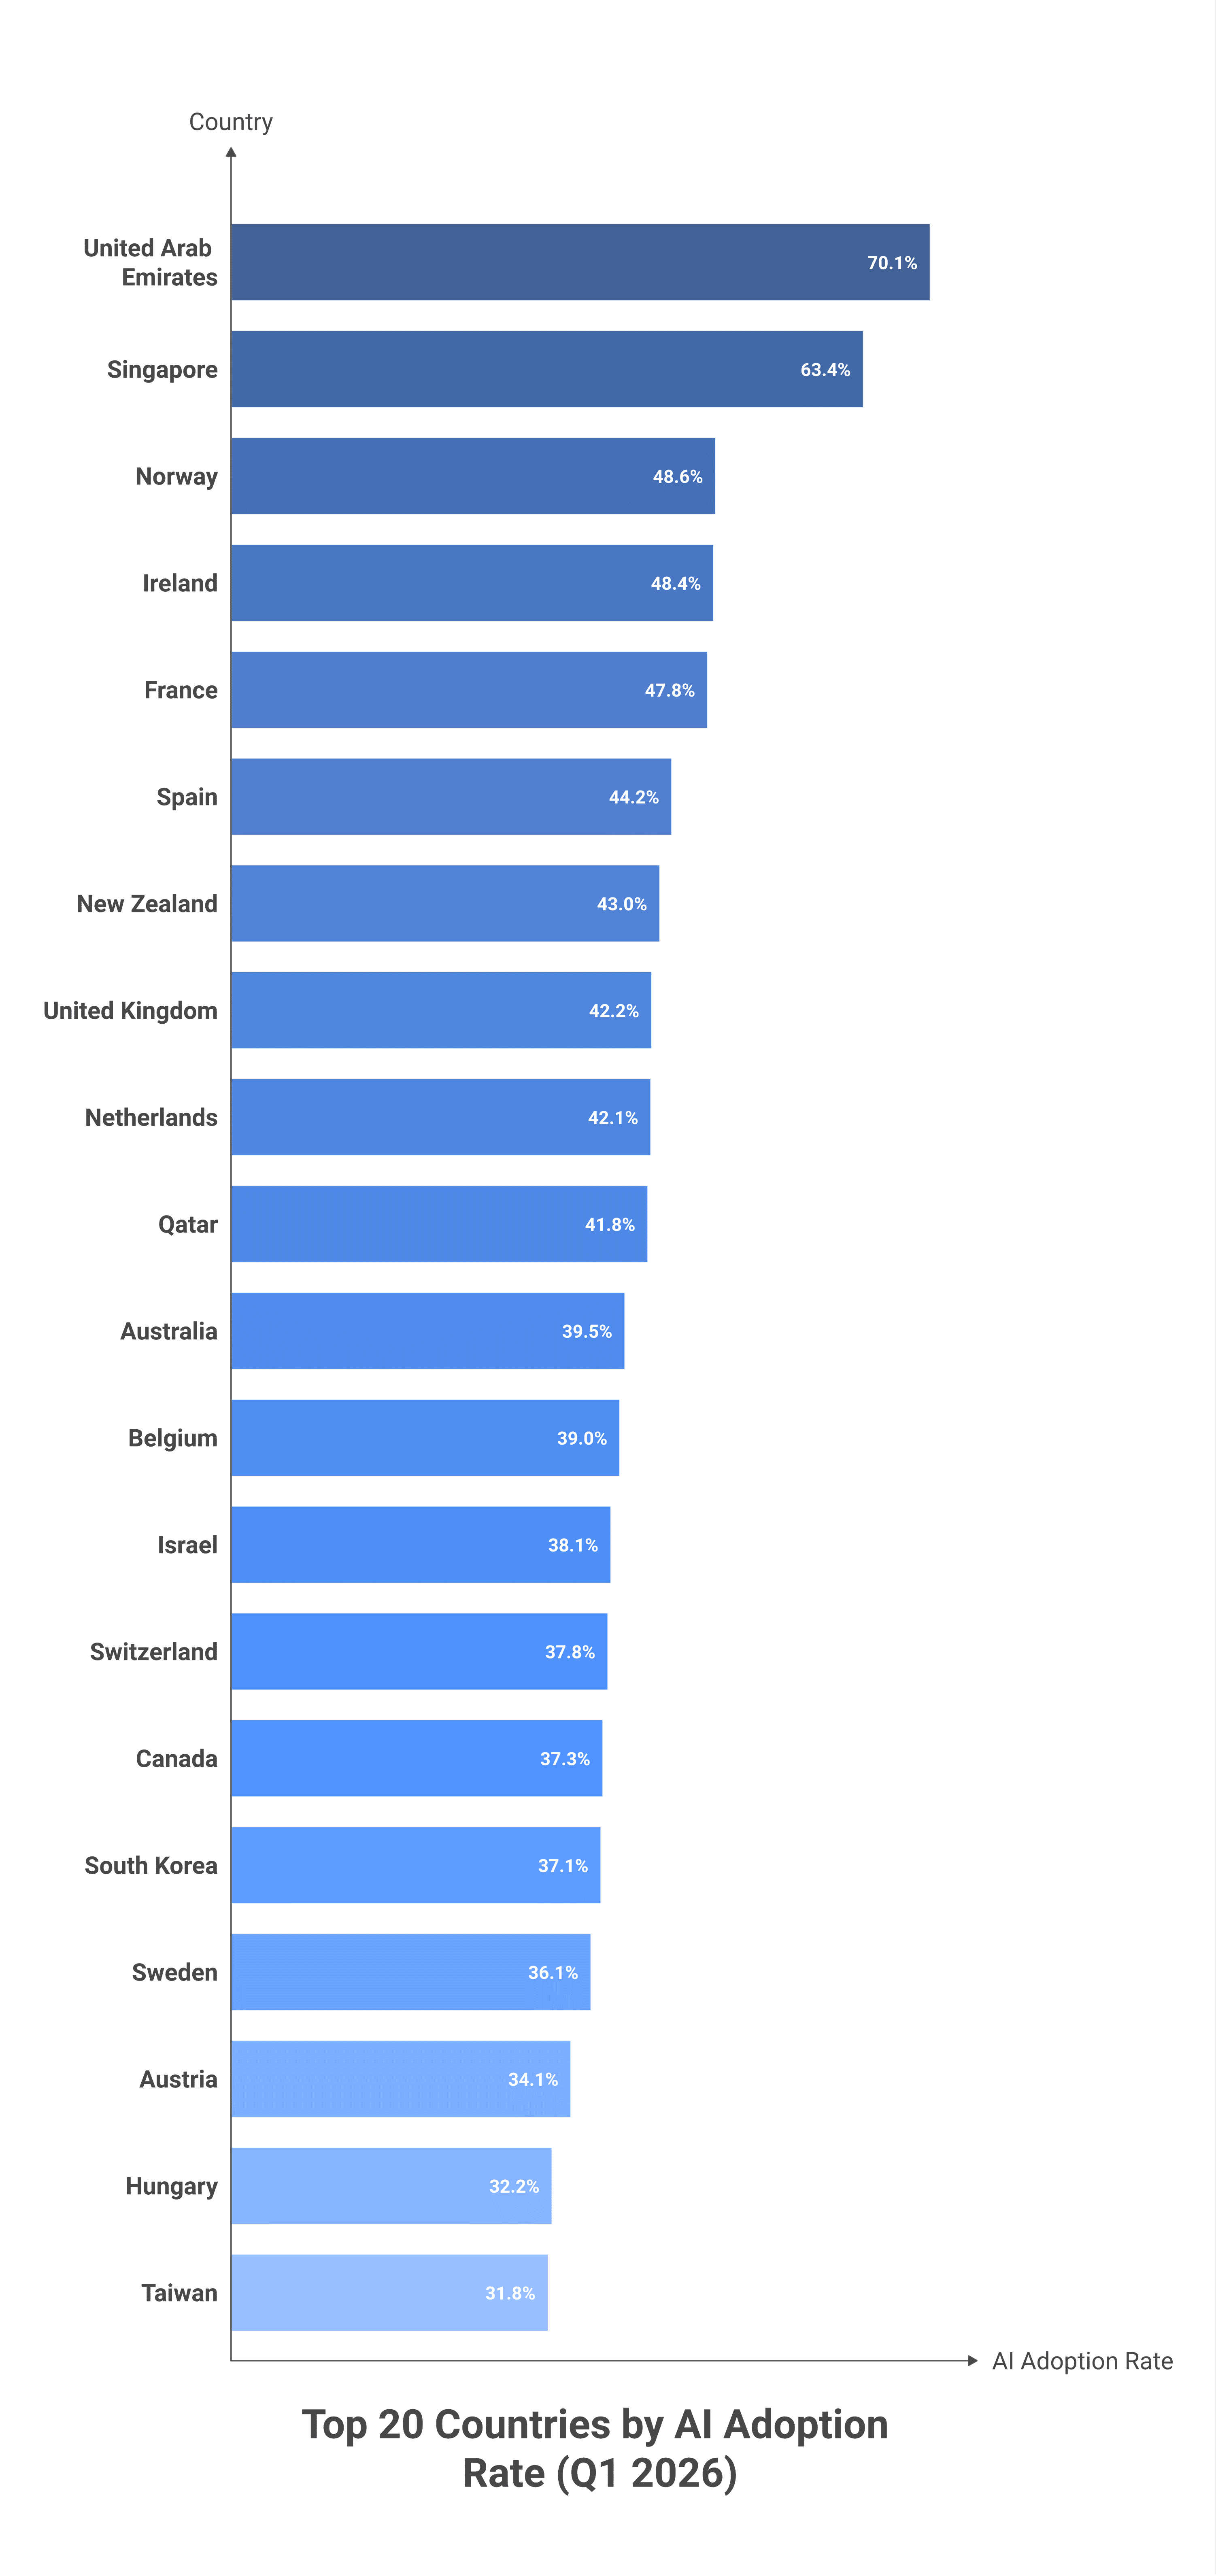
The most surprising pattern in the data: Europe massively outperforms North America on AI adoption, despite the U.S. and Canada being home to most of the leading AI companies. Eight of the top 20 are Western European; only Canada (#15) represents North America in the top 20. The United States sits at #21.
| Rank | Country | Q1 2026 | H1 2025 | YoY change (pp) |
|---|---|---|---|---|
| 1 | 🇦🇪 UAE | 70.1% | 59.4% | +10.7 |
| 2 | 🇸🇬 Singapore | 63.4% | 58.6% | +4.8 |
| 3 | 🇳🇴 Norway | 48.6% | 45.3% | +3.3 |
| 4 | 🇮🇪 Ireland | 48.4% | 41.7% | +6.7 |
| 5 | 🇫🇷 France | 47.8% | 40.9% | +6.9 |
| 6 | 🇪🇸 Spain | 44.2% | 39.7% | +4.5 |
| 7 | 🇳🇿 New Zealand | 43.0% | 37.6% | +5.4 |
| 8 | 🇬🇧 UK | 42.2% | 36.4% | +5.8 |
| 9 | 🇳🇱 Netherlands | 42.1% | 36.3% | +5.8 |
| 10 | 🇶🇦 Qatar | 41.8% | 35.7% | +6.1 |
| 11 | 🇦🇺 Australia | 39.5% | 34.5% | +5.0 |
| 12 | 🇧🇪 Belgium | 39.0% | 33.5% | +5.5 |
| 13 | 🇮🇱 Israel | 38.1% | 33.9% | +4.2 |
| 14 | 🇨🇭 Switzerland | 37.8% | 32.4% | +5.4 |
| 15 | 🇨🇦 Canada | 37.3% | 33.5% | +3.8 |
| 16 | 🇰🇷 South Korea | 37.1% | 25.9% | +11.2 |
| 17 | 🇸🇪 Sweden | 36.1% | 31.2% | +4.9 |
| 18 | 🇦🇹 Austria | 34.1% | 29.1% | +5.0 |
| 19 | 🇭🇺 Hungary | 32.2% | 27.9% | +4.3 |
| 20 | 🇹🇼 Taiwan | 31.8% | 26.4% | +5.4 |
| 21 | 🇺🇸 United States | 31.3% | 26.3% | +5.0 |
The U.S. has been climbing — Microsoft notes it moved from #24 to #21 in this quarter alone — but it still sits below most of Europe. Germany (#23, 31.1%), Italy (#25, 30.2%), and Poland (#24, 31.0%) round out a cluster of large economies that have only just crossed the 30% threshold.
Why Doesn’t the Home of AI Lead in AI Usage?
The “home of the leading AI companies” question deserves a real answer. A few factors that show up in the underlying Microsoft data:
- Workforce composition matters. Adoption rates measure working-age population usage, not enterprise spend. A country dominated by knowledge workers (Singapore, Norway, Ireland) sees higher uptake than a country with a larger share of trades, agriculture, and services where AI tools are less obviously applicable.
- Mobile vs desktop access. In the U.S., AI tools are heavily desktop-and-workplace-mediated; in the UAE and Singapore, mobile-first AI integration (WhatsApp bots, government services, banking apps) reaches deeper into daily life.
- National AI strategies pay off. The top three (UAE, Singapore, Norway) all have explicit national AI plans backed by procurement and education funding. The U.S. has no equivalent federal policy on consumer/workforce adoption — adoption has happened, but bottom-up rather than top-down.
- Language. South Korea’s +11.2-point jump is explicitly attributed by Microsoft to improvements in Korean-language LLM capabilities. Wherever the major models are weaker in the local language, adoption lags — and that effect is shrinking rapidly as models get more multilingual.
The Global Adoption Gap
Microsoft splits the world into “Global North” (high-income) and “Global South” (low- and middle-income) for the adoption analysis. The gap is widening rather than closing:
- Global North: 27.5% adoption in Q1 2026
- Global South: 15.4% adoption in Q1 2026
At the very bottom of the rankings sit Afghanistan, Tajikistan, Turkmenistan (all 6.1%), and Cambodia (5.7%). In these countries, AI adoption is constrained by some combination of internet penetration, smartphone access, language coverage, and basic literacy. The gap to the UAE’s 70.1% is more than 60 percentage points — roughly the same span as the GDP-per-capita gap between Switzerland and the lowest-income LDCs.
Methodology
Microsoft’s measure of AI diffusion is built on aggregated, anonymised telemetry from a broad sample of Microsoft and partner products plus modelled estimates filling in non-Microsoft AI tools (ChatGPT, Gemini, Claude, etc.). The threshold for “adoption” is at least 90 minutes of monthly AI usage by a working-age individual — a low bar that captures regular, intentional use without requiring daily reliance.
The dataset covers 147 countries with quarterly resolution from H1 2025 through Q1 2026 (the report’s release date is May 2026). All values in this post are from the report’s Annex (Page 17) and Section 1 (national leaderboard, Page 4).
Conclusion
The map of AI adoption is not the map of AI creation. The countries leading global usage in Q1 2026 are not the same set hosting the largest model labs. UAE and Singapore are running ahead of every G7 economy. France is at 47.8%; the United States is at 31.3%. South Korea jumped 11 points in twelve months on the back of better Korean-language models. The headline story isn’t who builds the models — it’s who lives in countries that have made AI a default tool of work and government services. By that measure, the AI race in 2026 is being led by small, wealthy, tech-strategic states; large economies are following, and the Global South is still a long way behind.
This post uses data from Microsoft's AI Diffusion Report Q1 2026 (released May 2026), which tracks the share of working-age adults using AI tools for at least 90 minutes per month across 147 countries. The choropleth and ranking are built from the report's quarterly leaderboard data tables (Pages 4 and 17).
Primary Data Sources:
- Microsoft AI Diffusion Report Q1 2026 – Microsoft Research full-text PDF of the Q1 2026 national AI diffusion leaderboard. All country-level percentages and global aggregate figures in this post come from this report.
- Visual Capitalist — Mapped: AI Adoption by Country in 2026 – Companion visualisation of the Microsoft data, by Amy Kuo (May 2026).
- Stanford HAI 2026 AI Index Report – Stanford's annual AI Index, an independent companion analysis covering investment, capabilities, and use patterns.
Image Sources:
- Dubai skyline at night — Kevin JD on Unsplash – Featured image.