Key Takeaways
- $857 billion moved in 2024. Personal remittances received worldwide reached $856.6 billion in 2024, per the latest World Bank release picked up by the IOM's World Migration Report 2026. That is a bigger flow than foreign direct investment to low- and middle-income countries.
- India is the only $100bn receiver. India received $137.7 billion in 2024 alone, more than double second-place Mexico ($67.6bn). The Philippines ($40.3bn), France ($38.8bn) and Pakistan ($34.9bn) round out the top five by absolute value.
- Tajikistan depends on it most. Small economies show up completely differently. In Tajikistan remittances equal 47% of GDP, in Tonga 39%, in Nicaragua 27%, in Nepal 26%. For these countries, money sent home is not a supplement, it is the economy.
- The two maps tell opposite stories. By absolute value, remittances go mostly to giant emerging economies (India, Mexico, Bangladesh, Egypt). By share of GDP, they matter most in small, migration-heavy countries in Central Asia, the Pacific, Central America and West Africa. The map on this page shows the second story: dependence.
- The world's cheapest cash lifeline. The UN Sustainable Development Goal target is to bring the average cost of sending $200 across borders below 3%. In 2024 the global average was 6.6%, more than double the target. Sub-Saharan Africa remains the most expensive corridor.
Remittances (money migrants send home to their families) are one of the largest, most stable and most under-covered flows in the global economy. In 2024 they totaled $856.6 billion worldwide, a bigger flow than foreign direct investment to low- and middle-income countries. The IOM’s World Migration Report 2026, released in June, made international remittances its Chapter 2. Here is where the money is going, mapped two different ways.
Where Remittances Matter Most: The Dependency Map
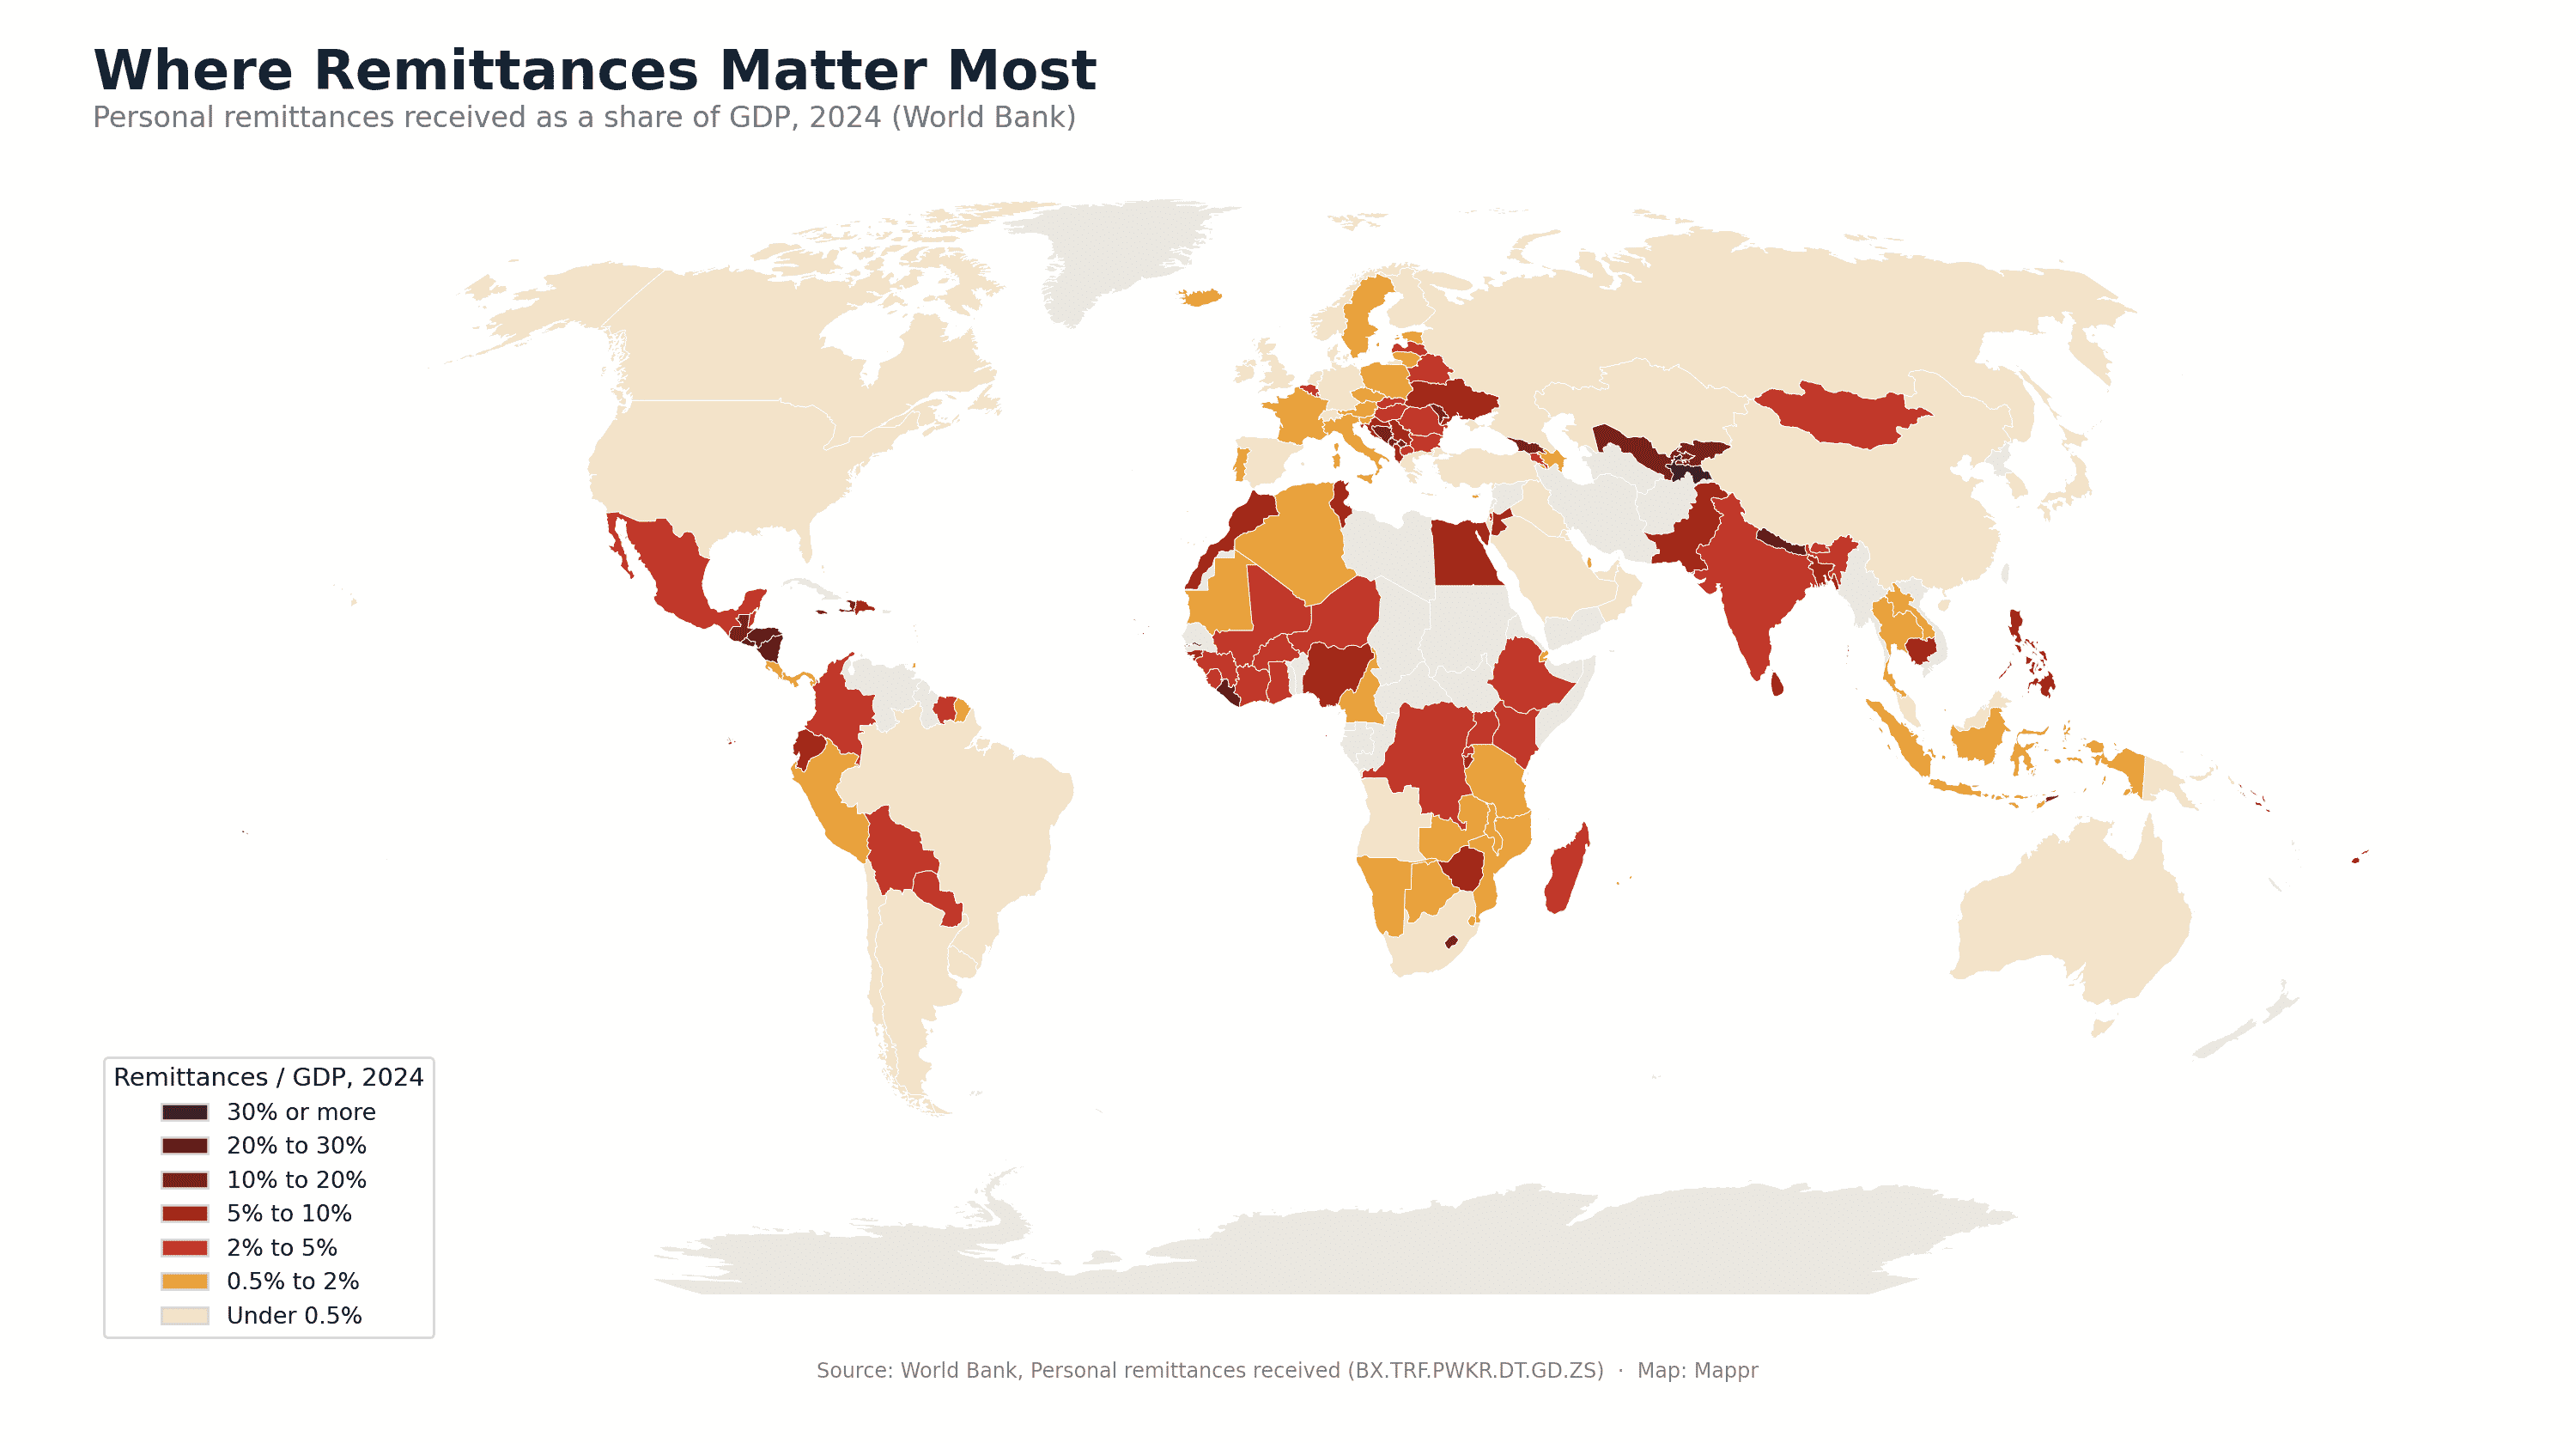
This is the story-rich layer. Rather than the biggest dollar amounts, it shows the countries where remittances are most load-bearing: what share of the entire economy the money coming home represents. Four clusters jump out:
- Central Asia: Tajikistan (47%) and Kyrgyzstan (18%) are among the most remittance-dependent economies on Earth, with most of the outflow going to Russia.
- Central America: Nicaragua (27%), Honduras (26%), El Salvador (24%) and Guatemala (19%) sit in the top 12. The corridor from the US is the largest single flow of money to a region.
- The South Pacific: Tonga (39%) and Samoa (24%) rely on remittances from workers in Australia, New Zealand and the US.
- West and Southern Africa: The Gambia (22%), Liberia (21%), Lesotho (20%). Migration to South Africa, the Gulf, and increasingly Europe drives the flow.
The Top 15 Most Remittance-Dependent Countries
| Rank | Country | Remittances / GDP (2024) |
|---|---|---|
| 1 | Tajikistan | 47.2% |
| 2 | Tonga | 39.2% |
| 3 | Nicaragua | 26.6% |
| 4 | Nepal | 26.0% |
| 5 | Honduras | 25.7% |
| 6 | El Salvador | 24.3% |
| 7 | Samoa | 24.0% |
| 8 | Marshall Islands | 23.5% |
| 9 | The Gambia | 22.0% |
| 10 | Liberia | 21.3% |
| 11 | Lesotho | 19.9% |
| 12 | Guatemala | 19.1% |
| 13 | Kyrgyzstan | 17.6% |
| 14 | Kosovo | 17.3% |
| 15 | Haiti | 16.9% |
Note on Lebanon: Lebanon historically ran around 25 to 30% of GDP in remittances, but currency collapse and severely disrupted national accounts since 2022 have created data gaps. It is not in the 2024 World Bank ranking above, but was consistently in the top five before the crisis.
The Other Story: Absolute Dollars
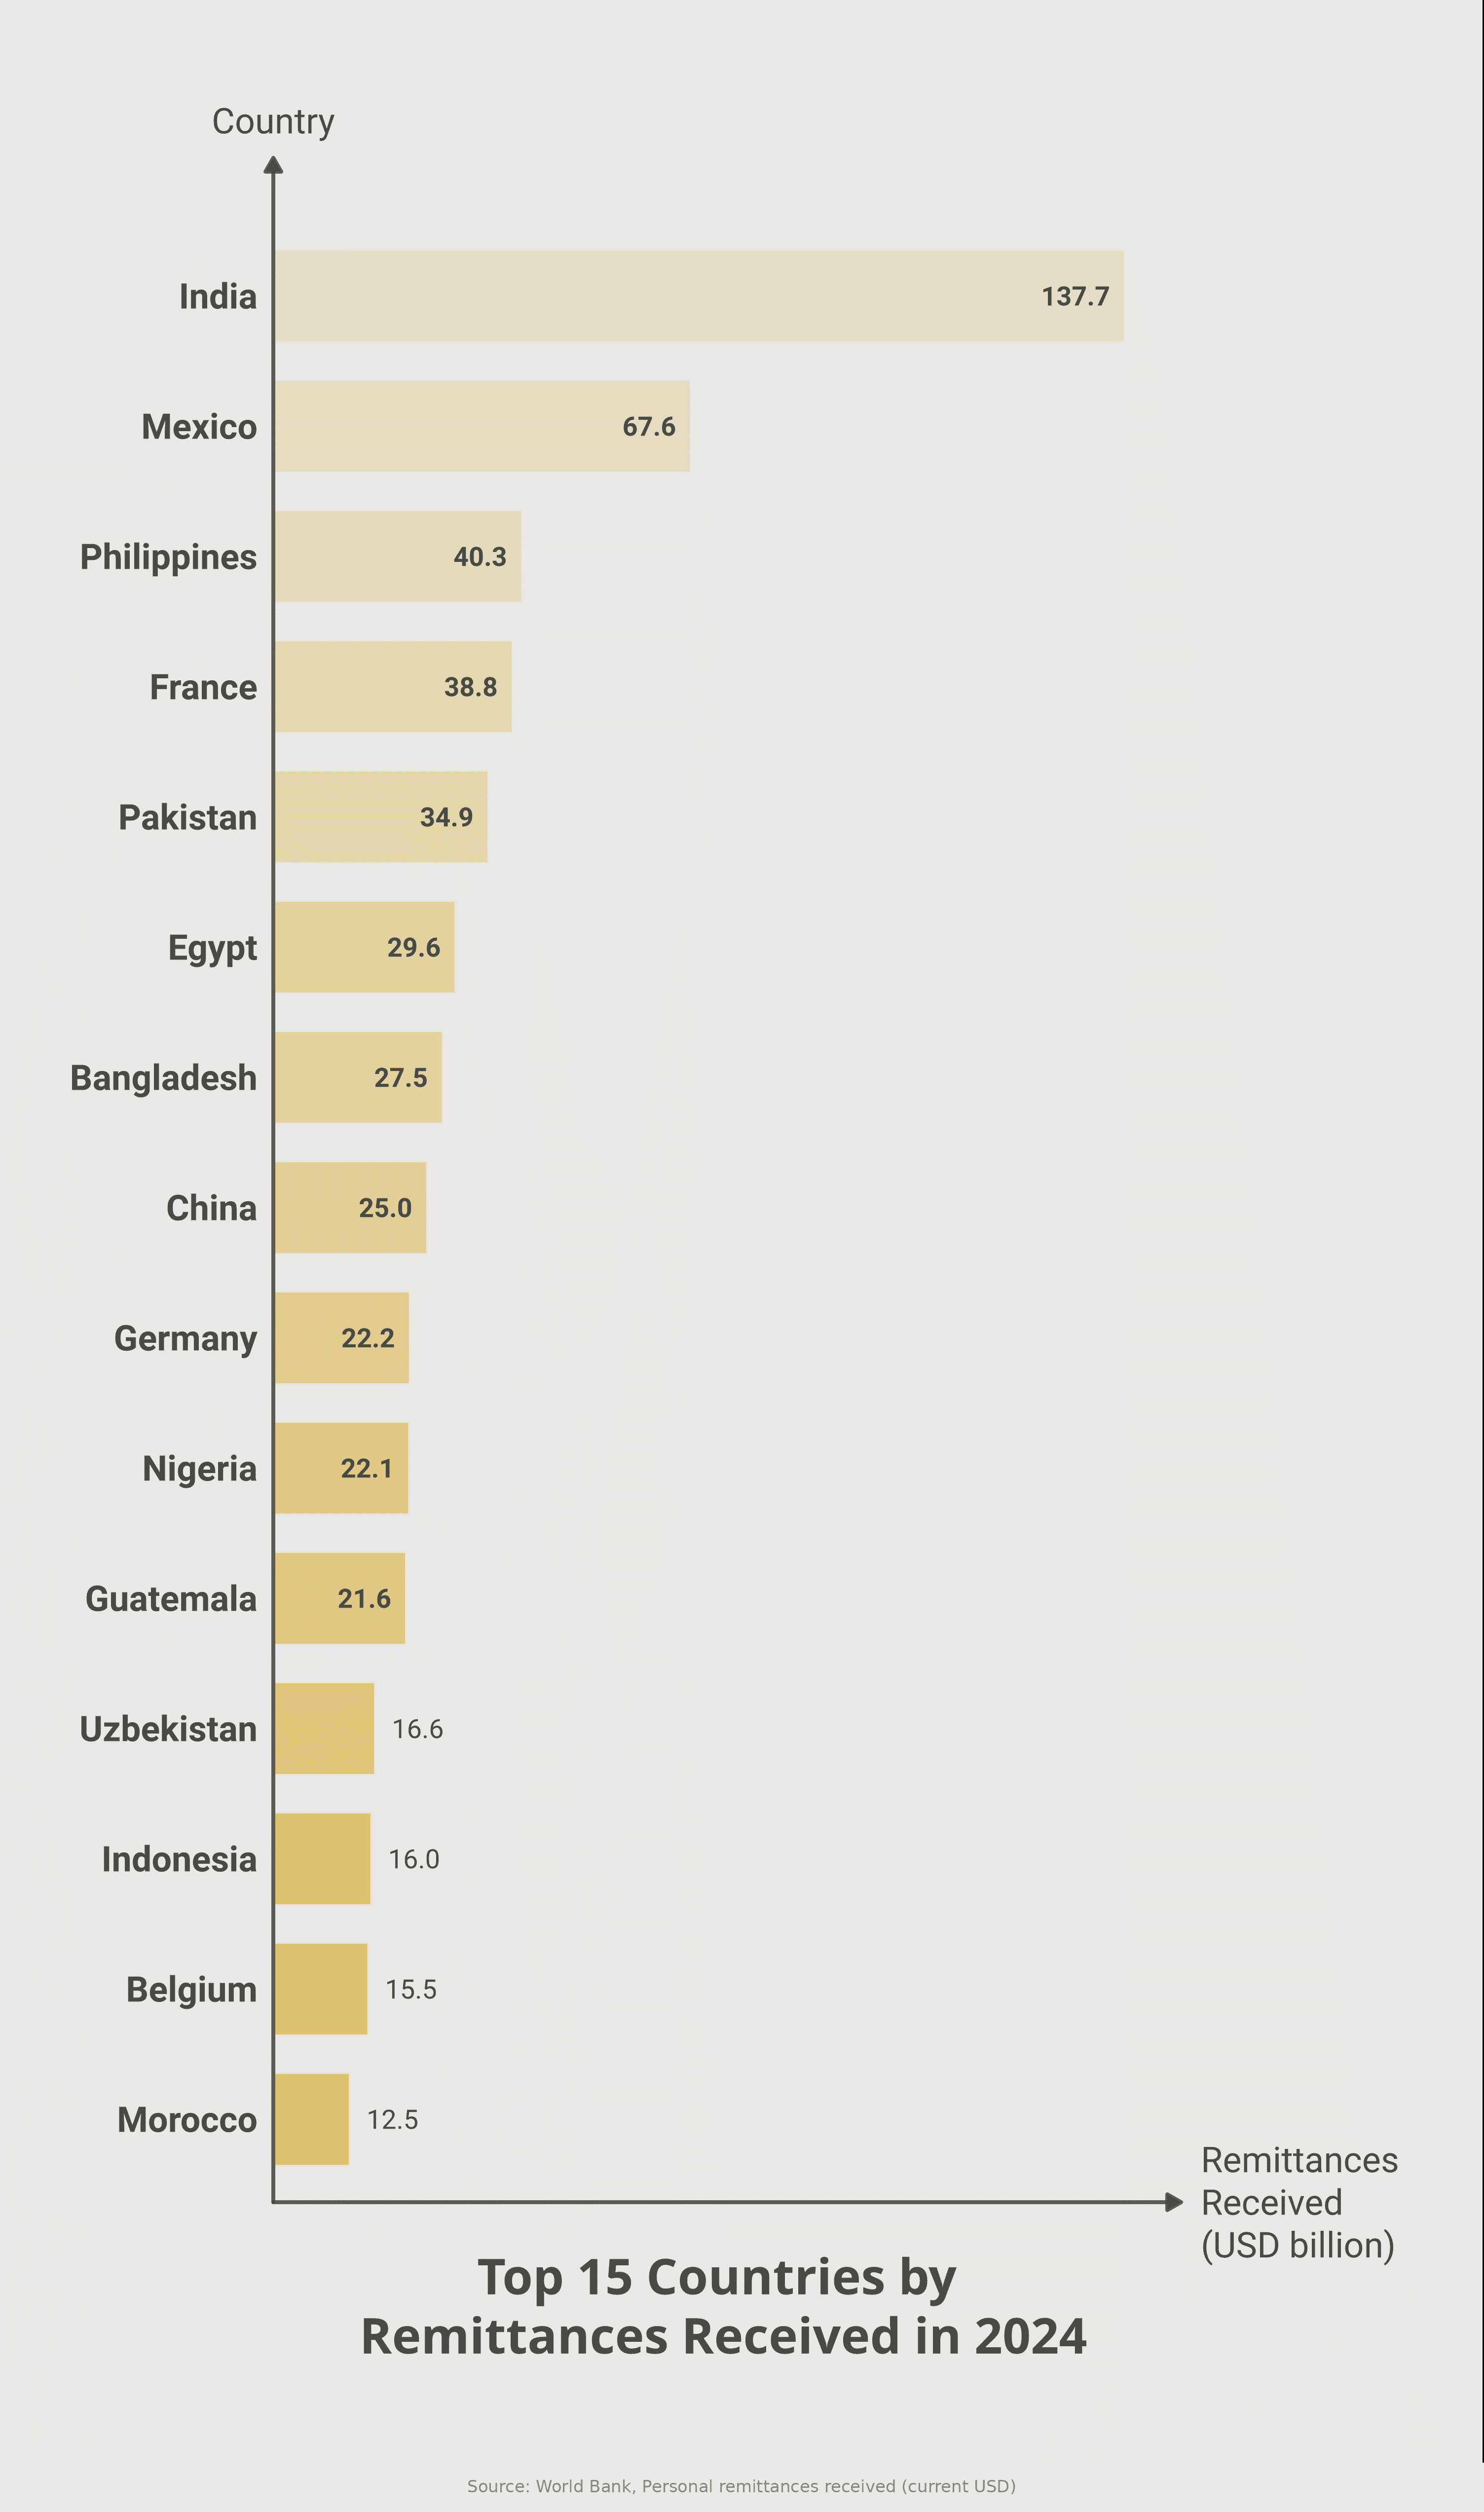
Sorted by raw dollars, the map flips. The receiving countries become the huge emerging economies with vast migrant populations abroad, plus a handful of Western European countries with lots of cross-border commuting.
Top 15 by Absolute Remittances Received (2024)
| Rank | Country | Remittances received (2024) |
|---|---|---|
| 1 | India | $137.7 billion |
| 2 | Mexico | $67.6 billion |
| 3 | Philippines | $40.3 billion |
| 4 | France | $38.8 billion |
| 5 | Pakistan | $34.9 billion |
| 6 | Egypt | $29.6 billion |
| 7 | Bangladesh | $27.5 billion |
| 8 | China | $25.0 billion |
| 9 | Germany | $22.2 billion |
| 10 | Nigeria | $22.1 billion |
| 11 | Guatemala | $21.6 billion |
| 12 | Uzbekistan | $16.6 billion |
| 13 | Indonesia | $16.0 billion |
| 14 | Belgium | $15.5 billion |
| 15 | Morocco | $12.5 billion |
India's $137.7 billion is more than double any other country. It represents the earnings of the world's largest overseas workforce, roughly 18 million Indians living abroad, from Silicon Valley engineers to Gulf construction workers. Mexico's $67.6 billion is essentially a single-corridor story: nearly all of it flows south from the United States. The Philippines' $40.3 billion comes from a genuinely globalized workforce, with almost every wealthy country contributing.
Two entries surprise: France at #4 and Germany at #9. Both are the receiving end of large cross-border-commuter and diaspora flows. Belgium ($15.5 billion, #14) is similar: a lot of what shows up as remittances is really wages earned in one EU country and paid to a family member in another.
Full 160-Country Table
Every World-Bank-reporting country, ranked by absolute value, with both metrics. Sortable and searchable.
| Rank (by USD) | Country | Remittances received (2024) | % of GDP |
|---|---|---|---|
| 1 | India | $137.67bn | 3.66% |
| 2 | Mexico | $67.64bn | 3.70% |
| 3 | Philippines | $40.28bn | 8.72% |
| 4 | France | $38.78bn | 1.23% |
| 5 | Pakistan | $34.91bn | 9.39% |
| 6 | Egypt | $29.56bn | 7.60% |
| 7 | Bangladesh | $27.52bn | 6.11% |
| 8 | China | $24.98bn | 0.13% |
| 9 | Germany | $22.17bn | 0.47% |
| 10 | Nigeria | $22.13bn | 8.77% |
| 11 | Guatemala | $21.64bn | 19.12% |
| 12 | Uzbekistan | $16.58bn | 13.66% |
| 13 | Indonesia | $16.04bn | 1.15% |
| 14 | Belgium | $15.48bn | 2.31% |
| 15 | Morocco | $12.51bn | 7.79% |
| 16 | Italy | $12.14bn | 0.51% |
| 17 | Ukraine | $12.00bn | 6.29% |
| 18 | Colombia | $11.87bn | 2.82% |
| 19 | Dominican Republic | $11.35bn | 9.13% |
| 20 | Nepal | $11.25bn | 25.99% |
| 21 | Romania | $9.53bn | 2.49% |
| 22 | Honduras | $9.52bn | 25.74% |
| 23 | Thailand | $9.46bn | 1.79% |
| 24 | United States | $8.71bn | 0.03% |
| 25 | Poland | $8.69bn | 0.95% |
| 26 | El Salvador | $8.49bn | 24.34% |
| 27 | South Korea | $7.28bn | 0.39% |
| 28 | Ethiopia | $7.14bn | 4.77% |
| 29 | Tajikistan | $6.80bn | 47.15% |
| 30 | Sri Lanka | $6.72bn | 6.75% |
| 31 | Croatia | $6.70bn | 7.21% |
| 32 | Ecuador | $6.54bn | 5.29% |
| 33 | Spain | $6.33bn | 0.37% |
| 34 | Serbia | $5.76bn | 6.40% |
| 35 | Hungary | $5.56bn | 2.49% |
| 36 | Nicaragua | $5.25bn | 26.63% |
| 37 | Kenya | $5.00bn | 4.15% |
| 38 | Peru | $4.93bn | 1.69% |
| 39 | Brazil | $4.90bn | 0.22% |
| 40 | United Kingdom | $4.83bn | 0.13% |
| 41 | Netherlands | $4.72bn | 0.39% |
| 42 | Japan | $4.65bn | 0.11% |
| 43 | Czechia | $4.55bn | 1.31% |
| 44 | Jordan | $4.43bn | 7.56% |
| 45 | Sweden | $4.43bn | 0.73% |
| 46 | Haiti | $4.11bn | 16.95% |
| 47 | Georgia | $4.06bn | 11.87% |
| 48 | Switzerland | $3.64bn | 0.37% |
| 49 | Jamaica | $3.56bn | 16.19% |
| 50 | Zimbabwe | $3.51bn | 8.45% |
| 51 | Austria | $3.48bn | 0.65% |
| 52 | Tunisia | $3.26bn | 6.34% |
| 53 | Kyrgyzstan | $3.20bn | 17.60% |
| 54 | Bosnia and Herzegovina | $3.12bn | 10.51% |
| 55 | Ghana | $3.03bn | 3.63% |
| 56 | Slovakia | $2.95bn | 2.10% |
| 57 | Cambodia | $2.83bn | 6.10% |
| 58 | Bulgaria | $2.64bn | 2.33% |
| 59 | Luxembourg | $2.52bn | 2.70% |
| 60 | Albania | $2.27bn | 8.41% |
| 61 | DR Congo | $2.00bn | 2.64% |
| 62 | Kosovo | $1.94bn | 17.29% |
| 63 | Moldova | $1.92bn | 10.53% |
| 64 | Belarus | $1.84bn | 2.34% |
| 65 | Portugal | $1.84bn | 0.59% |
| 66 | Russia | $1.82bn | 0.08% |
| 67 | Algeria | $1.80bn | 0.67% |
| 68 | United Arab Emirates | $1.80bn | 0.33% |
| 69 | Cote d’Ivoire | $1.77bn | 2.03% |
| 70 | Australia | $1.77bn | 0.10% |
| 71 | Malaysia | $1.61bn | 0.38% |
| 72 | Denmark | $1.52bn | 0.36% |
| 73 | Qatar | $1.44bn | 0.67% |
| 74 | Uganda | $1.43bn | 2.65% |
| 75 | Azerbaijan | $1.35bn | 1.82% |
| 76 | Latvia | $1.34bn | 3.04% |
| 77 | Bolivia | $1.28bn | 2.33% |
| 78 | Armenia | $1.28bn | 4.92% |
| 79 | Paraguay | $1.14bn | 2.54% |
| 80 | Tanzania | $1.12bn | 1.42% |
| 81 | Mali | $1.07bn | 3.99% |
| 82 | Lithuania | $1.05bn | 1.23% |
| 83 | Argentina | $1.04bn | 0.16% |
| 84 | Liberia | $1.02bn | 21.28% |
| 85 | Türkiye | $0.98bn | 0.07% |
| 86 | Israel | $0.95bn | 0.18% |
| 87 | Norway | $0.95bn | 0.19% |
| 88 | Slovenia | $0.91bn | 1.24% |
| 89 | South Africa | $0.86bn | 0.21% |
| 90 | Montenegro | $0.86bn | 10.34% |
| 91 | Canada | $0.85bn | 0.04% |
| 92 | Finland | $0.81bn | 0.27% |
| 93 | Palestine (West Bank & Gaza) | $0.74bn | 4.59% |
| 94 | Costa Rica | $0.72bn | 0.75% |
| 95 | Iraq | $0.70bn | 0.25% |
| 96 | Cameroon | $0.69bn | 1.29% |
| 97 | Cyprus | $0.68bn | 1.80% |
| 98 | Ireland | $0.66bn | 0.11% |
| 99 | Niger | $0.65bn | 3.30% |
| 100 | Guinea | $0.62bn | 2.46% |
| 101 | Burkina Faso | $0.60bn | 2.57% |
| 102 | Greece | $0.56bn | 0.22% |
| 103 | Panama | $0.53bn | 0.61% |
| 104 | The Gambia | $0.53bn | 22.00% |
| 105 | Mongolia | $0.53bn | 2.22% |
| 106 | Rwanda | $0.52bn | 3.42% |
| 107 | Estonia | $0.50bn | 1.15% |
| 108 | Lesotho | $0.48bn | 19.90% |
| 109 | North Macedonia | $0.46bn | 2.70% |
| 110 | Hong Kong | $0.46bn | 0.11% |
| 111 | Fiji | $0.42bn | 7.11% |
| 112 | Madagascar | $0.41bn | 2.31% |
| 113 | Saudi Arabia | $0.34bn | 0.03% |
| 114 | Zambia | $0.33bn | 1.32% |
| 115 | Cabo Verde | $0.33bn | 12.31% |
| 116 | Sierra Leone | $0.32bn | 4.60% |
| 117 | Mauritius | $0.29bn | 1.92% |
| 118 | Samoa | $0.28bn | 24.01% |
| 119 | Mozambique | $0.27bn | 1.17% |
| 120 | Tonga | $0.25bn | 39.20% |
| 121 | Lao PDR | $0.25bn | 1.49% |
| 122 | Iceland | $0.25bn | 0.74% |
| 123 | Kazakhstan | $0.24bn | 0.08% |
| 124 | Burundi | $0.24bn | 7.80% |
| 125 | Timor-Leste | $0.22bn | 11.77% |
| 126 | Guinea-Bissau | $0.22bn | 9.88% |
| 127 | Trinidad and Tobago | $0.20bn | 0.78% |
| 128 | Malawi | $0.19bn | 1.65% |
| 129 | Suriname | $0.16bn | 3.63% |
| 130 | Uruguay | $0.14bn | 0.17% |
| 131 | Macao SAR, China | $0.14bn | 0.27% |
| 132 | Botswana | $0.13bn | 0.67% |
| 133 | Belize | $0.12bn | 3.79% |
| 134 | Bhutan | $0.11bn | 3.28% |
| 135 | Chile | $0.10bn | 0.03% |
| 136 | Namibia | $96M | 0.71% |
| 137 | Solomon Islands | $95M | 6.01% |
| 138 | Mauritania | $95M | 0.87% |
| 139 | Saint Vincent & the Grenadines | $92M | 7.94% |
| 140 | São Tomé and Príncipe | $80M | 9.71% |
| 141 | Marshall Islands | $67M | 23.48% |
| 142 | The Bahamas | $66M | 0.42% |
| 143 | Saint Lucia | $61M | 2.33% |
| 144 | Djibouti | $56M | 1.35% |
| 145 | Andorra | $52M | 1.29% |
| 146 | Angola | $51M | 0.05% |
| 147 | Grenada | $48M | 3.56% |
| 148 | Dominica | $39M | 5.67% |
| 149 | Oman | $39M | 0.04% |
| 150 | Saint Kitts and Nevis | $39M | 3.45% |
| 151 | Eswatini | $33M | 0.69% |
| 152 | Antigua and Barbuda | $26M | 1.21% |
| 153 | Kuwait | $20M | 0.01% |
| 154 | Malta | $16M | 0.06% |
| 155 | Kiribati | $15M | 4.27% |
| 156 | Seychelles | $12M | 0.54% |
| 157 | Cayman Islands | $11M | 0.15% |
| 158 | Maldives | $6M | 0.08% |
| 159 | Papua New Guinea | $4M | 0.01% |
| 160 | Nauru | $2M | 1.33% |
Why the Cost of Sending Money Matters
A recurring point in the IOM report and in every UN development document since 2015 is the cost of remittances. The Sustainable Development Goal target 10.c.1 asks countries to bring the average cost of sending $200 across borders below 3% by 2030. In 2024, the global average was 6.6%. Sub-Saharan Africa remains the most expensive corridor, averaging around 8%.
At $857 billion of total flows, every percentage point in cost that gets removed puts roughly $8.5 billion a year back in the pockets of families in low-income countries, a rounding error in the global economy and a life-changing sum for the households receiving it. Mobile money, fintech competition and post-office corridors have all pulled the average down over the past decade, but not fast enough to hit the SDG line.
What Remittances Are Not
Two useful clarifications for reading these numbers. First: World Bank data captures formal, recorded flows. Actual global remittances are widely believed to be 30 to 50% larger once informal hand-carried cash, hawala networks and other unrecorded channels are included. Countries with weak banking or heavy cash economies are under-counted more than others.
Second: these are personal remittances (workers to families). They do not include foreign aid, foreign direct investment, tourism revenue or corporate transfers. The comparison to FDI in the summary is deliberate: for many of the countries on the dependency map, remittances are larger than aid and FDI combined, and far more stable through crises. When the global economy wobbles, remittances usually keep flowing home.
Sources: