Key Takeaways
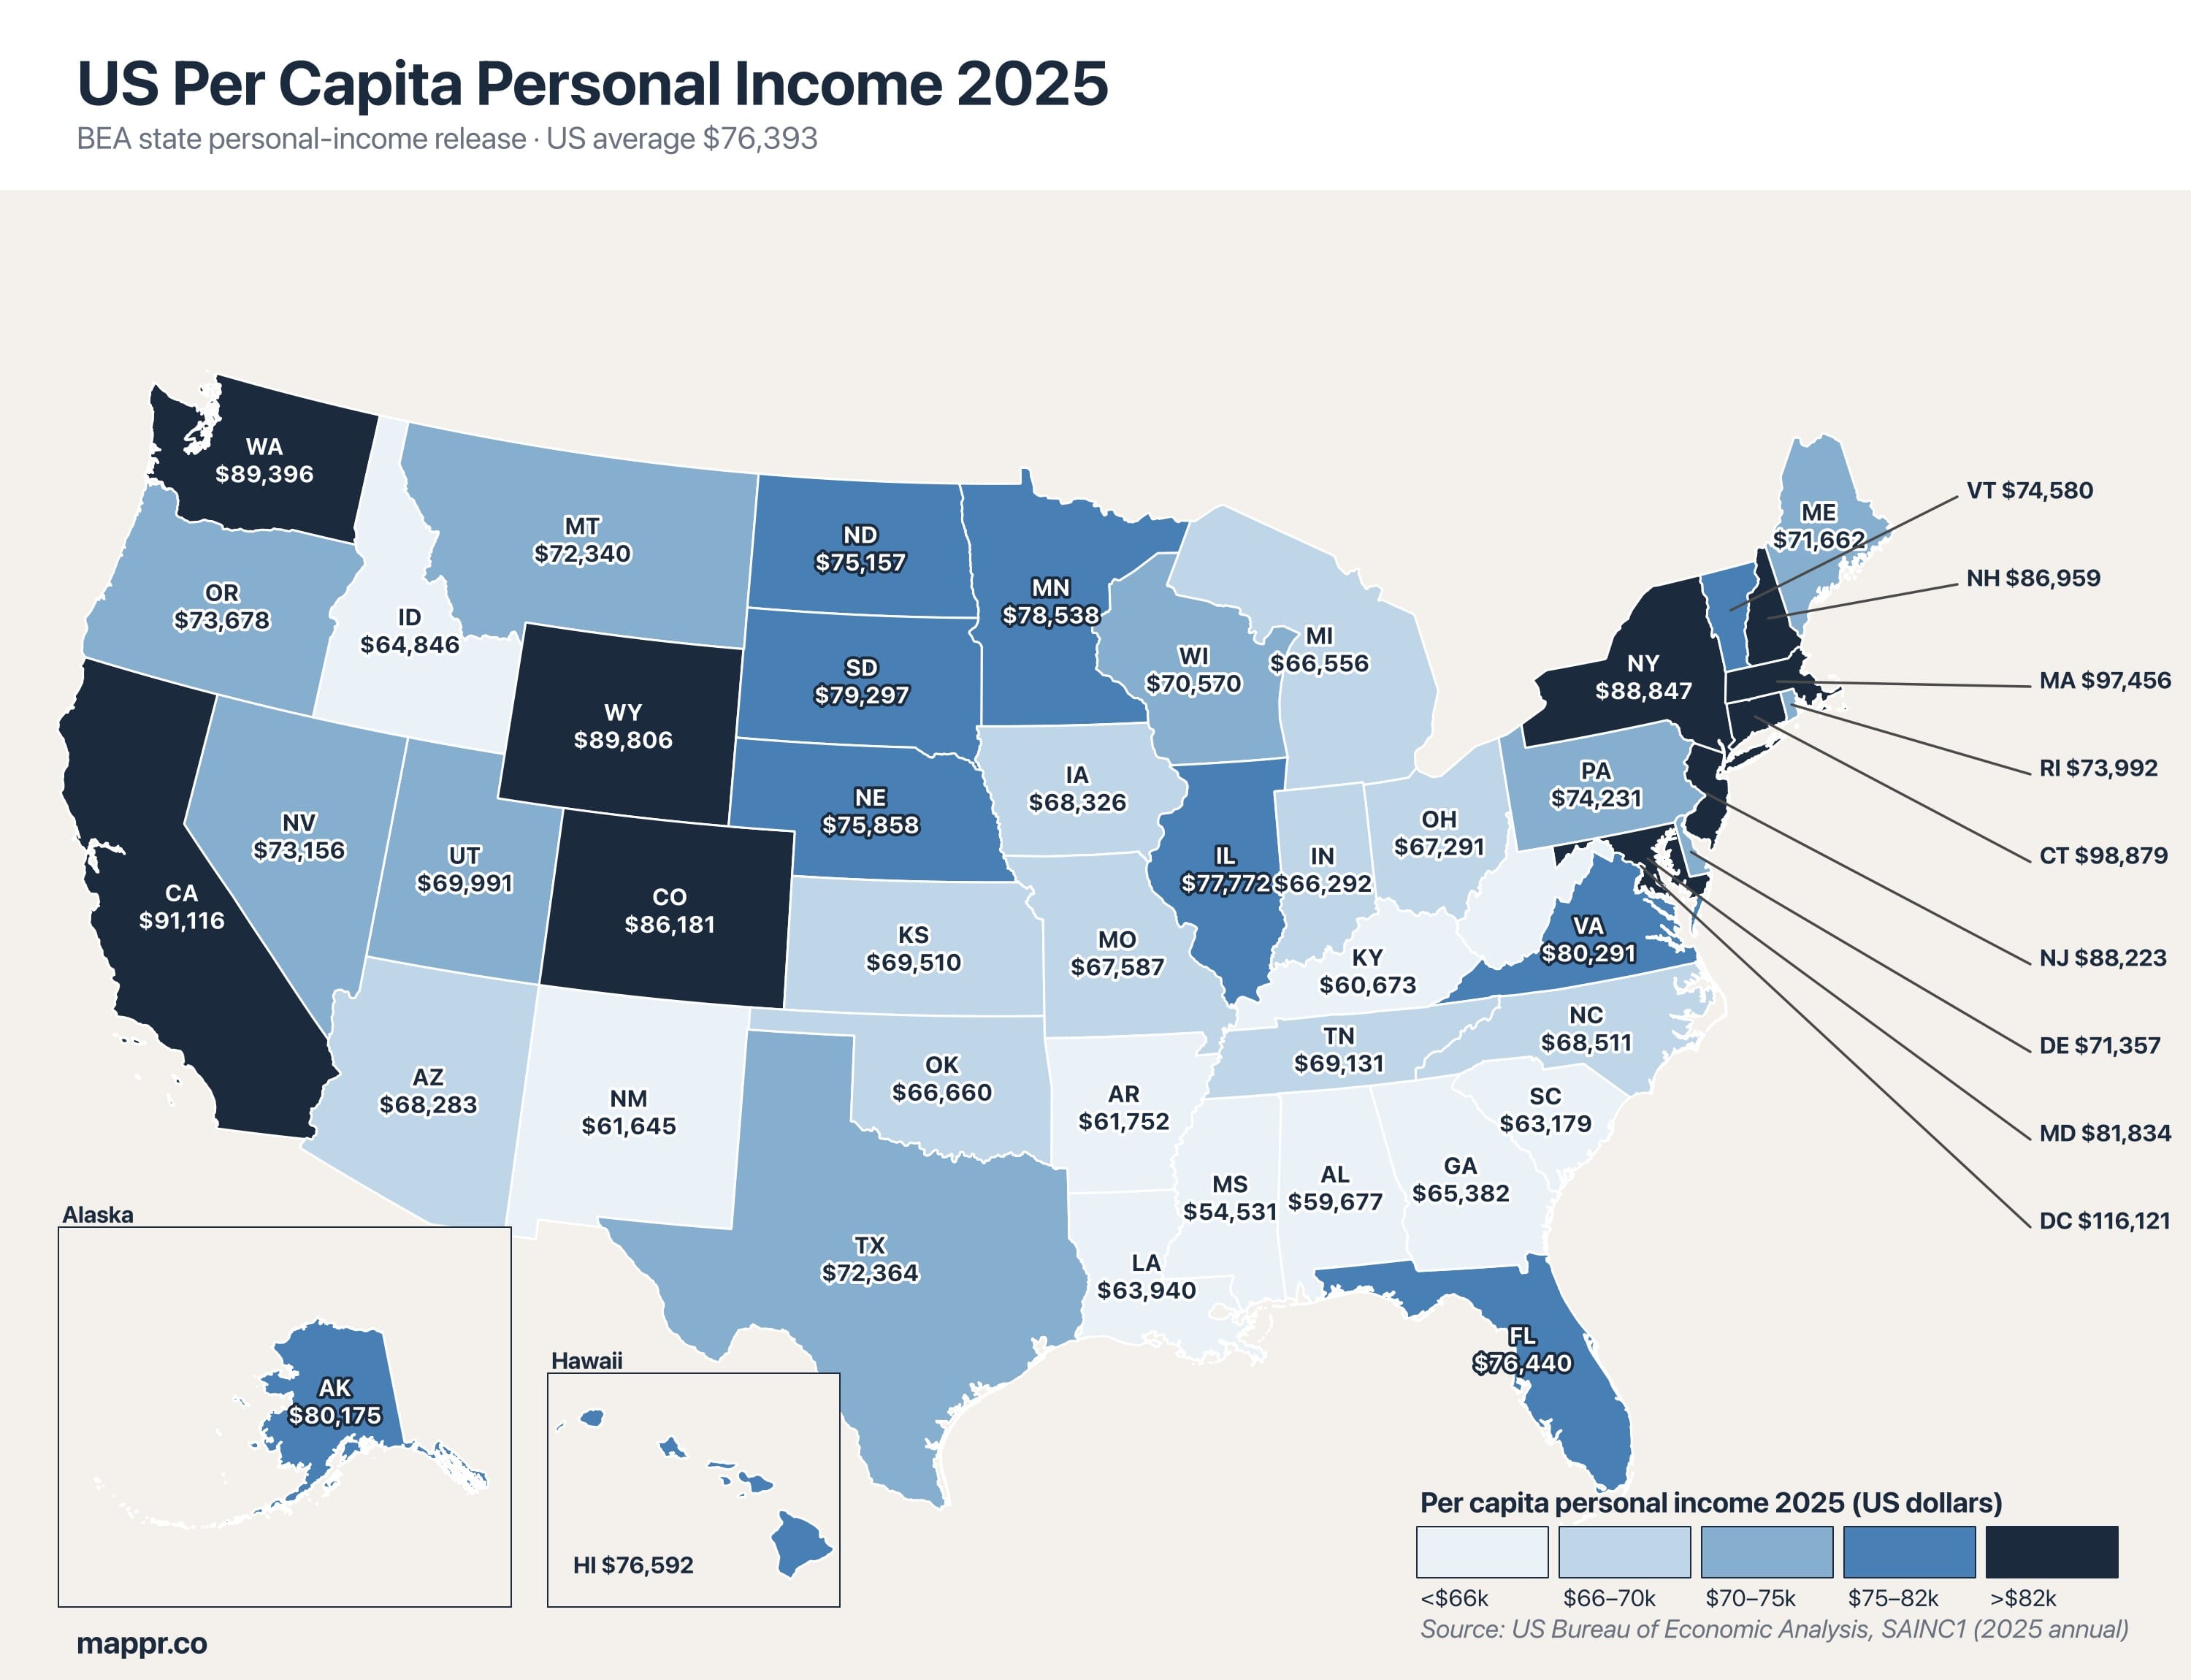
- District of Columbia leads — $116,121. DC's per-capita personal income is $116,121, more than double Mississippi's $54,531. Concentration of federal employment + high-earning professional services pulls the federal city far above any state.
- Connecticut tops the states at $98,879. Massachusetts ($97,456) and California ($91,116) follow. New England and the Northeast dominate the top tier — 7 of the 10 highest-income states sit in those two regions.
- Mississippi is lowest at $54,531. West Virginia ($57,932), Alabama ($59,677), Kentucky ($60,673), and New Mexico ($61,645) round out the bottom five. Mississippi-to-Connecticut gap is roughly $44,000 — a 45% shortfall.
- US average: $76,393 (YoY +4.3%). Nominal per-capita personal income rose from $73,227 in 2024 to $76,393 in 2025. Real growth is lower once inflation is accounted for; BEA reports nominal dollars.
- Utah, Arizona, Washington are the 10-year climbers. Utah +75.5%, Arizona +71.2%, Washington +70.6%, Florida +70.0%, California +69.3% since 2015. Resource/energy states Alaska and North Dakota lag at the bottom, up only ~41–42% in the same decade.
A person living in the District of Columbia earns on average $116,121 a year — more than double what their counterpart in Mississippi earns ($54,531). That $61,590 gap between the richest and poorest jurisdictions in the United States is the largest in more than two decades, and it’s the headline fact in the US Bureau of Economic Analysis’ April 9, 2026 state personal-income release.
Across all 50 states and DC, per-capita personal income averaged $76,393 in 2025 — up +4.3% from 2024 in nominal terms. But that headline number masks a geography of wealth that’s more unequal than it was in 2015: New England and the Mid-Atlantic have pulled further ahead of the Southeast, while tech-hub states like California, Washington, and Utah have seen the fastest per-capita growth of the past decade.
How the BEA Measures Per-Capita Personal Income
Per-capita personal income (PCPI) is total personal income divided by the resident population of an area. “Personal income” here is the BEA’s broad aggregate: wages and salaries, employer contributions to pension/insurance funds, proprietors’ income, rental income, personal dividend and interest income, and government transfer receipts (Social Security, Medicare, veterans’ benefits, unemployment insurance), minus contributions for government social insurance.
A few framing points matter before comparing states:
- Nominal dollars, not real. BEA reports current-year dollars. Year-over-year growth rates below include inflation. The real (inflation-adjusted) change in 2025 was meaningfully smaller than the nominal +4.3% headline.
- Residence, not workplace. PCPI is measured at place of residence. A Connecticut accountant who commutes to Manhattan has her income counted in Connecticut. This is why DC’s number is so striking — it’s the federal workforce’s residence, not just its workplace.
- Cost of living differs — a lot. Mississippi’s $54,531 and Massachusetts’ $97,456 are not directly comparable in purchasing power. BEA also publishes Regional Price Parities for PCPI adjustment; we’ve stayed with unadjusted figures here because they’re what the release actually reports.
- Transfer receipts matter at the bottom. In lower-income states, a larger share of personal income comes from government transfers (Social Security, Medicare, Medicaid) rather than from wages. That compresses the gap between the top and bottom relative to a wage-only measure.
The 10 Highest-Income States in 2025
The top is a Northeast-and-Pacific story. DC leads by a wide margin; seven of the top ten states sit in New England or the Mid-Atlantic. California and Washington represent the Pacific tech corridor. Wyoming is the surprise — a resource-heavy, sparsely-populated state whose energy and mineral wealth push its per-capita numbers into the top ten.
| Rank | State | Abbr. | PCPI 2025 | YoY | BEA Region |
|---|---|---|---|---|---|
| 1 | District of Columbia | DC | $116,121 | +2.8% | Mideast |
| 2 | Connecticut | CT | $98,879 | +4.0% | New England |
| 3 | Massachusetts | MA | $97,456 | +4.1% | New England |
| 4 | California | CA | $91,116 | +5.5% | Far West |
| 5 | Wyoming | WY | $89,806 | +3.7% | Rocky Mountain |
| 6 | Washington | WA | $89,396 | +4.5% | Far West |
| 7 | New York | NY | $88,847 | +4.6% | Mideast |
| 8 | New Jersey | NJ | $88,223 | +4.0% | Mideast |
| 9 | New Hampshire | NH | $86,959 | +4.5% | New England |
| 10 | Colorado | CO | $86,181 | +4.3% | Rocky Mountain |
Two things jump out. First, DC’s $116,121 is a federal-capital artifact: the District is overwhelmingly composed of federal, legal, and consulting professionals, without the lower-income suburban or rural population that brings down state-level averages. Treat it as an urban data-point rather than a state comparison. Second, Wyoming at #5 looks anomalous until you notice its population is under 600,000 — resource royalties and absence of corporate income tax pull the denominator down and the numerator up. Connecticut and Massachusetts are the cleanest state-vs-state comparison for “richest America”.
The 10 Lowest-Income States in 2025
The bottom is almost entirely a Southeast story. Nine of the ten lowest-income states are in the BEA Southeast region; New Mexico is the only non-Southeast entry in the bottom ten. All 50 states grew nominally year-over-year, but the floor is still decisively below the national median.
| Rank | State | Abbr. | PCPI 2025 | YoY | BEA Region |
|---|---|---|---|---|---|
| 42 | Mississippi | MS | $54,531 | +5.0% | Southeast |
| 43 | West Virginia | WV | $57,932 | +4.5% | Southeast |
| 44 | Alabama | AL | $59,677 | +4.2% | Southeast |
| 45 | Kentucky | KY | $60,673 | +4.1% | Southeast |
| 46 | New Mexico | NM | $61,645 | +5.7% | Southwest |
| 47 | Arkansas | AR | $61,752 | +4.4% | Southeast |
| 48 | South Carolina | SC | $63,179 | +4.2% | Southeast |
| 49 | Louisiana | LA | $63,940 | +3.7% | Southeast |
| 50 | Idaho | ID | $64,846 | +4.0% | Rocky Mountain |
| 51 | Georgia | GA | $65,382 | +4.0% | Southeast |
Mississippi’s $54,531 represents 56% of Connecticut’s $98,879 — and 47% of DC’s $116,121. The Southeast’s concentration of low-wage service and agricultural work, combined with lower educational attainment and smaller high-earner populations, keeps these states stuck well below the national average despite decades of real per-capita growth.
Regional Snapshot — BEA’s 8 Regions
The BEA groups states into eight regions for analytical purposes. Ranked by average 2025 per-capita personal income across member states:
| Rank | Region | Avg PCPI 2025 (states) |
|---|---|---|
| 1 | Mideast | $86,769 |
| 2 | New England | $83,921 |
| 3 | Far West | $80,686 |
| 4 | Rocky Mountain | $76,633 |
| 5 | Plains | $73,468 |
| 6 | Great Lakes | $69,696 |
| 7 | Southwest | $67,238 |
| 8 | Southeast | $65,120 |
The regional pattern is remarkably stable year-on-year. New England (CT, MA, ME, NH, RI, VT) and the Mideast (NY, NJ, PA, MD, DE, DC) take the top two slots thanks to finance, biotech, professional services, and the federal-workforce concentration. The Far West (CA, WA, OR, NV, HI, AK) sits in the top three on the strength of the Pacific tech corridor — California and Washington pull the regional average up; Oregon and Nevada moderate it. The Southeast (12 states) is the lowest, pulling below every other region’s average even with outliers like Florida and Virginia.
The 10-Year Growth Story
Where personal income has grown fastest since 2015 tells a different geographic story than who’s richest today. The fastest climbers are not the already-wealthy Northeast but the Sun Belt + Pacific Northwest:
- 🇺🇸 Utah: +75.5% (to $69,991) — youngest, fastest-growing state; concentrated tech + financial services sector.
- 🇺🇸 Arizona: +71.2% (to $68,283) — sustained migration from California, manufacturing re-shoring, chip-factory build-out.
- 🇺🇸 Washington: +70.6% (to $89,396) — tech compensation growth (Microsoft, Amazon) with no state income tax compressing the top end less than in California.
- 🇺🇸 Florida: +70.0% (to $76,440) — high-income in-migration during the post-2020 remote-work wave, plus retirement transfer receipts.
- 🇺🇸 California: +69.3% (to $91,116) — still the headline growth story despite out-migration of middle-income residents.
At the other end — the slow growers — are states whose 10-year arc was shaped by commodity cycles more than by services:
- 🇺🇸 Alaska: +41.4% (to $80,175) — oil royalties flat over the decade; Permanent Fund dividend growth modest.
- 🇺🇸 North Dakota: +41.9% (to $75,157) — Bakken shale peak is behind us; per-capita income reflects an oil-sector normalization.
- 🇺🇸 Maryland: +48.7% (to $81,834) — already-high base; federal-employment growth flat, professional services pricing squeezed.
- 🇺🇸 Kansas: +49.2% (to $69,510) — agriculture + aerospace manufacturing; neither has produced the earnings growth of tech or energy booms.
- 🇺🇸 Connecticut: +49.3% (to $98,879) — still the richest state today, but slowest-growing among the Northeast cluster as Wall Street compensation shifted to a flatter trajectory.
One takeaway: being rich in 2025 is not the same as getting richer. Several of today’s richest states (Connecticut, Maryland, New Jersey) have grown more slowly than Sun Belt and Mountain West states that were middle-tier a decade ago and are now closing the gap.
All 50 States + DC — Searchable Ranking
The full 2025 BEA per-capita personal income release, sortable by state, value, year-over-year growth, or region. Type in the search box to filter (e.g. “New” catches New York, New Hampshire, New Jersey, New Mexico).
| Rank | State | PCPI 2025 (USD) | YoY | 10-yr | BEA Region |
|---|---|---|---|---|---|
| 1 | District of Columbia | 116,121 | 2.8% | 55.3% | Mideast |
| 2 | Connecticut | 98,879 | 4.0% | 49.3% | New England |
| 3 | Massachusetts | 97,456 | 4.1% | 58.4% | New England |
| 4 | California | 91,116 | 5.5% | 69.3% | Far West |
| 5 | Wyoming | 89,806 | 3.7% | 60.0% | Rocky Mountain |
| 6 | Washington | 89,396 | 4.5% | 70.6% | Far West |
| 7 | New York | 88,847 | 4.6% | 57.0% | Mideast |
| 8 | New Jersey | 88,223 | 4.0% | 51.0% | Mideast |
| 9 | New Hampshire | 86,959 | 4.5% | 60.6% | New England |
| 10 | Colorado | 86,181 | 4.3% | 67.7% | Rocky Mountain |
| 11 | Maryland | 81,834 | 3.0% | 48.7% | Mideast |
| 12 | Virginia | 80,291 | 3.9% | 55.6% | Southeast |
| 13 | Alaska | 80,175 | 4.7% | 41.4% | Far West |
| 14 | South Dakota | 79,297 | 5.0% | 64.1% | Plains |
| 15 | Minnesota | 78,538 | 4.0% | 52.9% | Plains |
| 16 | Illinois | 77,772 | 4.3% | 53.4% | Great Lakes |
| 17 | Hawaii | 76,592 | 7.0% | 62.4% | Far West |
| 18 | Florida | 76,440 | 4.2% | 70.0% | Southeast |
| 19 | Nebraska | 75,858 | 4.3% | 52.6% | Plains |
| 20 | North Dakota | 75,157 | 4.3% | 41.9% | Plains |
| 21 | Vermont | 74,580 | 4.3% | 55.0% | New England |
| 22 | Pennsylvania | 74,231 | 4.8% | 50.6% | Mideast |
| 23 | Rhode Island | 73,992 | 4.6% | 54.0% | New England |
| 24 | Oregon | 73,678 | 3.9% | 66.8% | Far West |
| 25 | Nevada | 73,156 | 4.4% | 67.0% | Far West |
| 26 | Texas | 72,364 | 3.7% | 54.7% | Southwest |
| 27 | Montana | 72,340 | 4.5% | 67.9% | Rocky Mountain |
| 28 | Maine | 71,662 | 4.2% | 66.9% | New England |
| 29 | Delaware | 71,357 | 4.7% | 51.1% | Mideast |
| 30 | Wisconsin | 70,570 | 4.1% | 53.7% | Great Lakes |
| 31 | Utah | 69,991 | 3.9% | 75.5% | Rocky Mountain |
| 32 | Kansas | 69,510 | 5.4% | 49.2% | Plains |
| 33 | Tennessee | 69,131 | 4.3% | 64.8% | Southeast |
| 34 | North Carolina | 68,511 | 4.4% | 64.6% | Southeast |
| 35 | Iowa | 68,326 | 4.4% | 50.4% | Plains |
| 36 | Arizona | 68,283 | 3.4% | 71.2% | Southwest |
| 37 | Missouri | 67,587 | 4.1% | 58.4% | Plains |
| 38 | Ohio | 67,291 | 4.2% | 53.6% | Great Lakes |
| 39 | Oklahoma | 66,660 | 4.7% | 50.5% | Southwest |
| 40 | Michigan | 66,556 | 4.1% | 54.8% | Great Lakes |
| 41 | Indiana | 66,292 | 3.6% | 57.3% | Great Lakes |
| 42 | Georgia | 65,382 | 4.0% | 57.4% | Southeast |
| 43 | Idaho | 64,846 | 4.0% | 67.1% | Rocky Mountain |
| 44 | Louisiana | 63,940 | 3.7% | 50.5% | Southeast |
| 45 | South Carolina | 63,179 | 4.2% | 59.6% | Southeast |
| 46 | Arkansas | 61,752 | 4.4% | 57.3% | Southeast |
| 47 | New Mexico | 61,645 | 5.7% | 63.3% | Southwest |
| 48 | Kentucky | 60,673 | 4.1% | 56.5% | Southeast |
| 49 | Alabama | 59,677 | 4.2% | 56.3% | Southeast |
| 50 | West Virginia | 57,932 | 4.5% | 56.3% | Southeast |
| 51 | Mississippi | 54,531 | 5.0% | 55.4% | Southeast |
Methodology & Data Caveats
- Source series: BEA SAINC1 (State Annual Personal Income Summary) and SAINC4 (Personal Income by Major Component), downloaded April 2026. The dataset spans 1929–2025 with consistent methodology applied retroactively to the full series.
- Nominal not real: All figures are in current-year dollars. BEA’s real personal income series (inflation-adjusted) is published separately; it trims the headline growth rates meaningfully but doesn’t change the cross-state ranking.
- No cost-of-living adjustment: BEA publishes Regional Price Parities that can re-base PCPI by local cost of living; applying those flattens the top of the distribution (New York, California, Hawaii fall several places) and raises some of the bottom (Mississippi, Alabama move up). We’ve stayed with the headline SAINC1 series for consistency with how the release is reported.
- Revisions: BEA revises 2020–2024 statistics each annual release. Growth rates calculated against earlier BEA releases may not match this post’s figures.
- DC is not a state. Included here because BEA ranks it alongside the 50 states, but readers should treat it as an urban data point (federal workforce + professional services) rather than a state-level comparison.
The Bottom Line on American Income Geography
The US per-capita income map in 2025 looks more stratified than it did in 2015: a Northeast-and-Pacific top tier sits well above a middle-America majority, with a Southeast tail that has grown in dollar terms but not closed the gap in percentage terms. DC’s $116,121 and Mississippi’s $54,531 bookend a country where personal income is strongly correlated with the mix of industries a state specializes in — finance and tech pull New England and the Pacific up; agriculture, manufacturing, and government transfers keep the Southeast at the bottom.
The more interesting story is the 10-year trajectory: Sun Belt and Mountain West states are the fastest climbers, narrowing some of the gap with the wealthy Northeast. Utah, Arizona, and Washington all grew per-capita income by more than 70% between 2015 and 2025, while Connecticut and Maryland — still among the richest — grew by under 50%. That’s the more predictive map of where income is moving over the next decade.
Per-capita personal income data from the US Bureau of Economic Analysis State Annual Personal Income summary (SAINC1), released April 9, 2026. All figures in nominal current-year dollars, not adjusted for inflation. Growth comparisons draw on the same series 2000–2025.