Key Takeaways
- $6.49 trillion in state + local pension assets. Up 8.46% from $5.98T in 2024. Funds defined-benefit retirement for 37 million current and former public employees.
- California holds 24% of the national total. $1.55 trillion in CA pension funds alone — more than the next two states (NY $730B + TX $426B) combined.
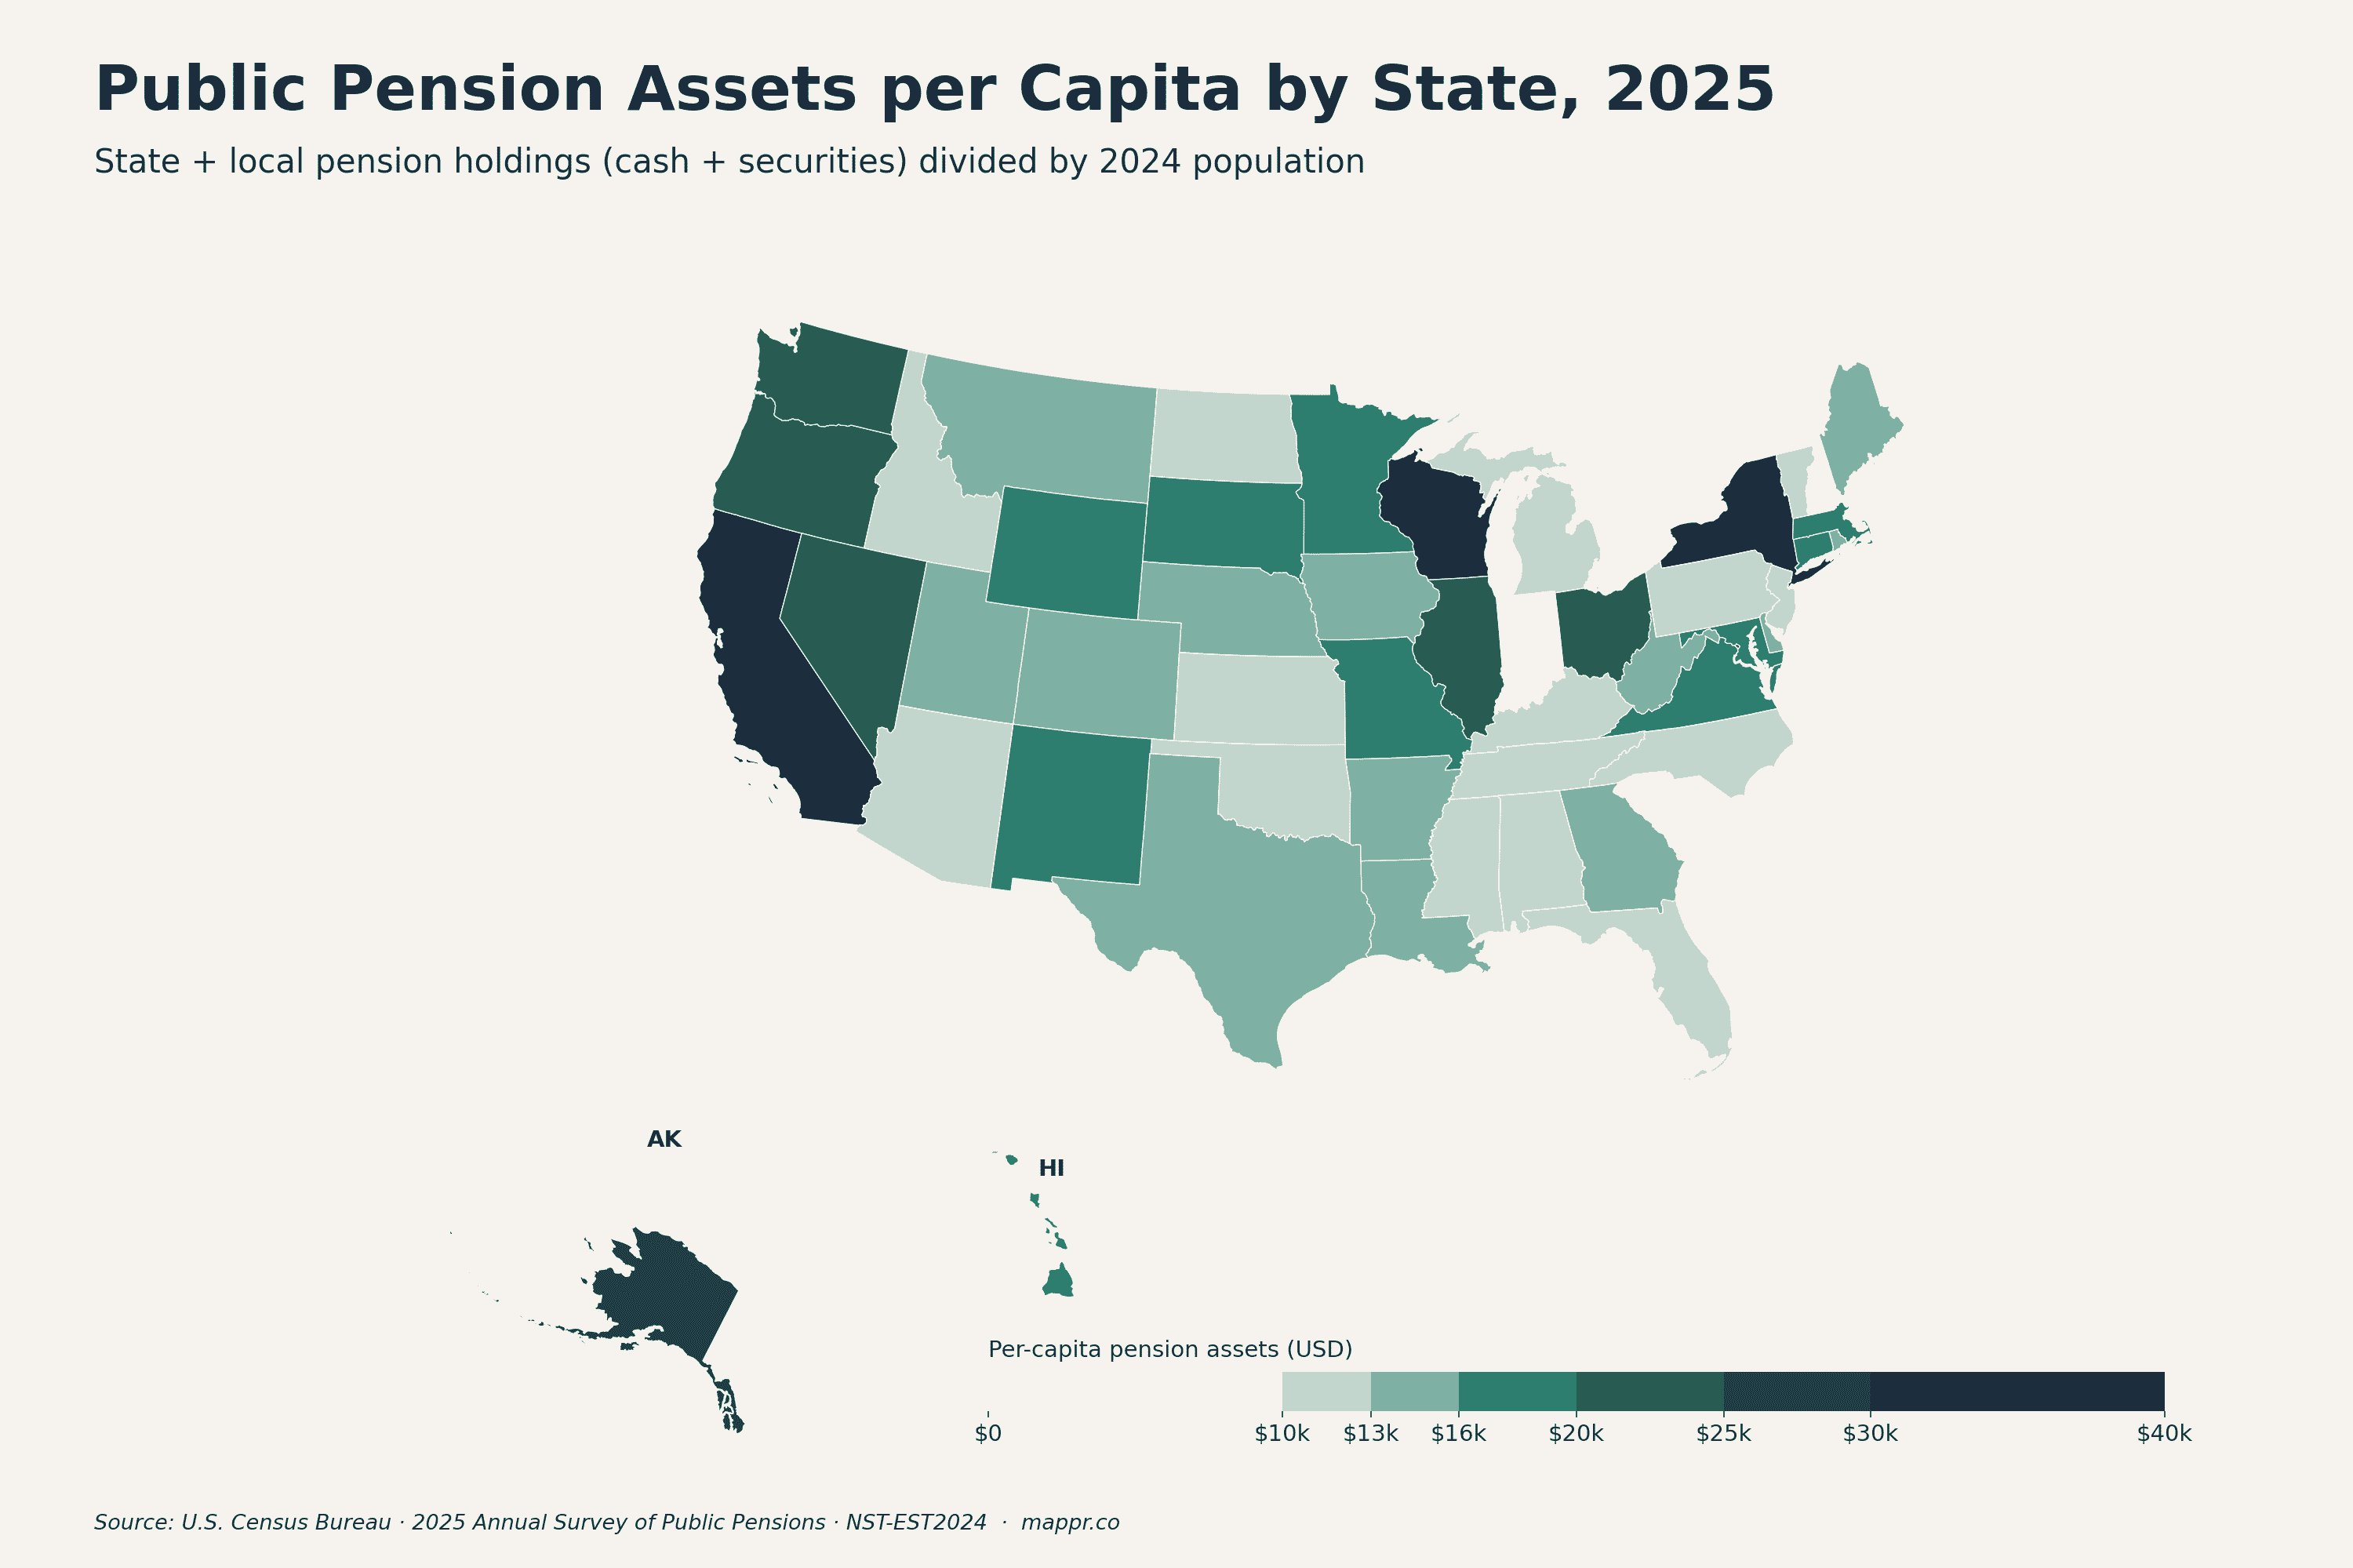
- California and New York lead per capita. $39,400 and $36,700 per resident respectively. Indiana sits at the other end with $7,300 per resident.
- Wisconsin punches above its weight. Just 6M residents but $185B in pension assets — $31,000 per resident, third-highest in the nation.
- Government contributions dominate. State and local governments contributed 75.2% of the $315B in new money flowing into pension plans in 2025; employees added the other 24.8%.
U.S. state and local governments held a combined $6.49 trillion in public pension assets at the end of fiscal 2025 — up 8.46% from $5.98 trillion the year before, according to the U.S. Census Bureau’s Annual Survey of Public Pensions released May 14, 2026.
The funds back the retirement promises made to roughly 37 million current and former public employees: teachers, police officers, firefighters, judges, and rank-and-file state and local workers. In 2025 alone, those plans paid out $418.25 billion in benefits — about $1.15 billion every day — and absorbed $315 billion in new contributions, mostly from the governments themselves.
How that wealth is distributed across the country is wildly uneven. The map below shows pension assets per resident in 2025: deep navy where states have stockpiled the most retirement money relative to population, light cream where they have the least.
The $6.49 Trillion Picture
Public pensions in America are a hybrid system. State-administered plans like CalPERS (California), the New York State Common Retirement Fund, and Teacher Retirement System of Texas account for the bulk of the assets, but every state also runs an array of smaller local plans for municipal employees — county police, city fire, school district teachers in states without state-administered teacher plans.
The Census Bureau’s survey covers all of them: 1,948 defined-benefit pension systems run by state and local governments. The $6.49 trillion figure is the total cash and securities those systems held at the end of their fiscal years — a number that grew on the back of strong investment returns plus net new contributions.
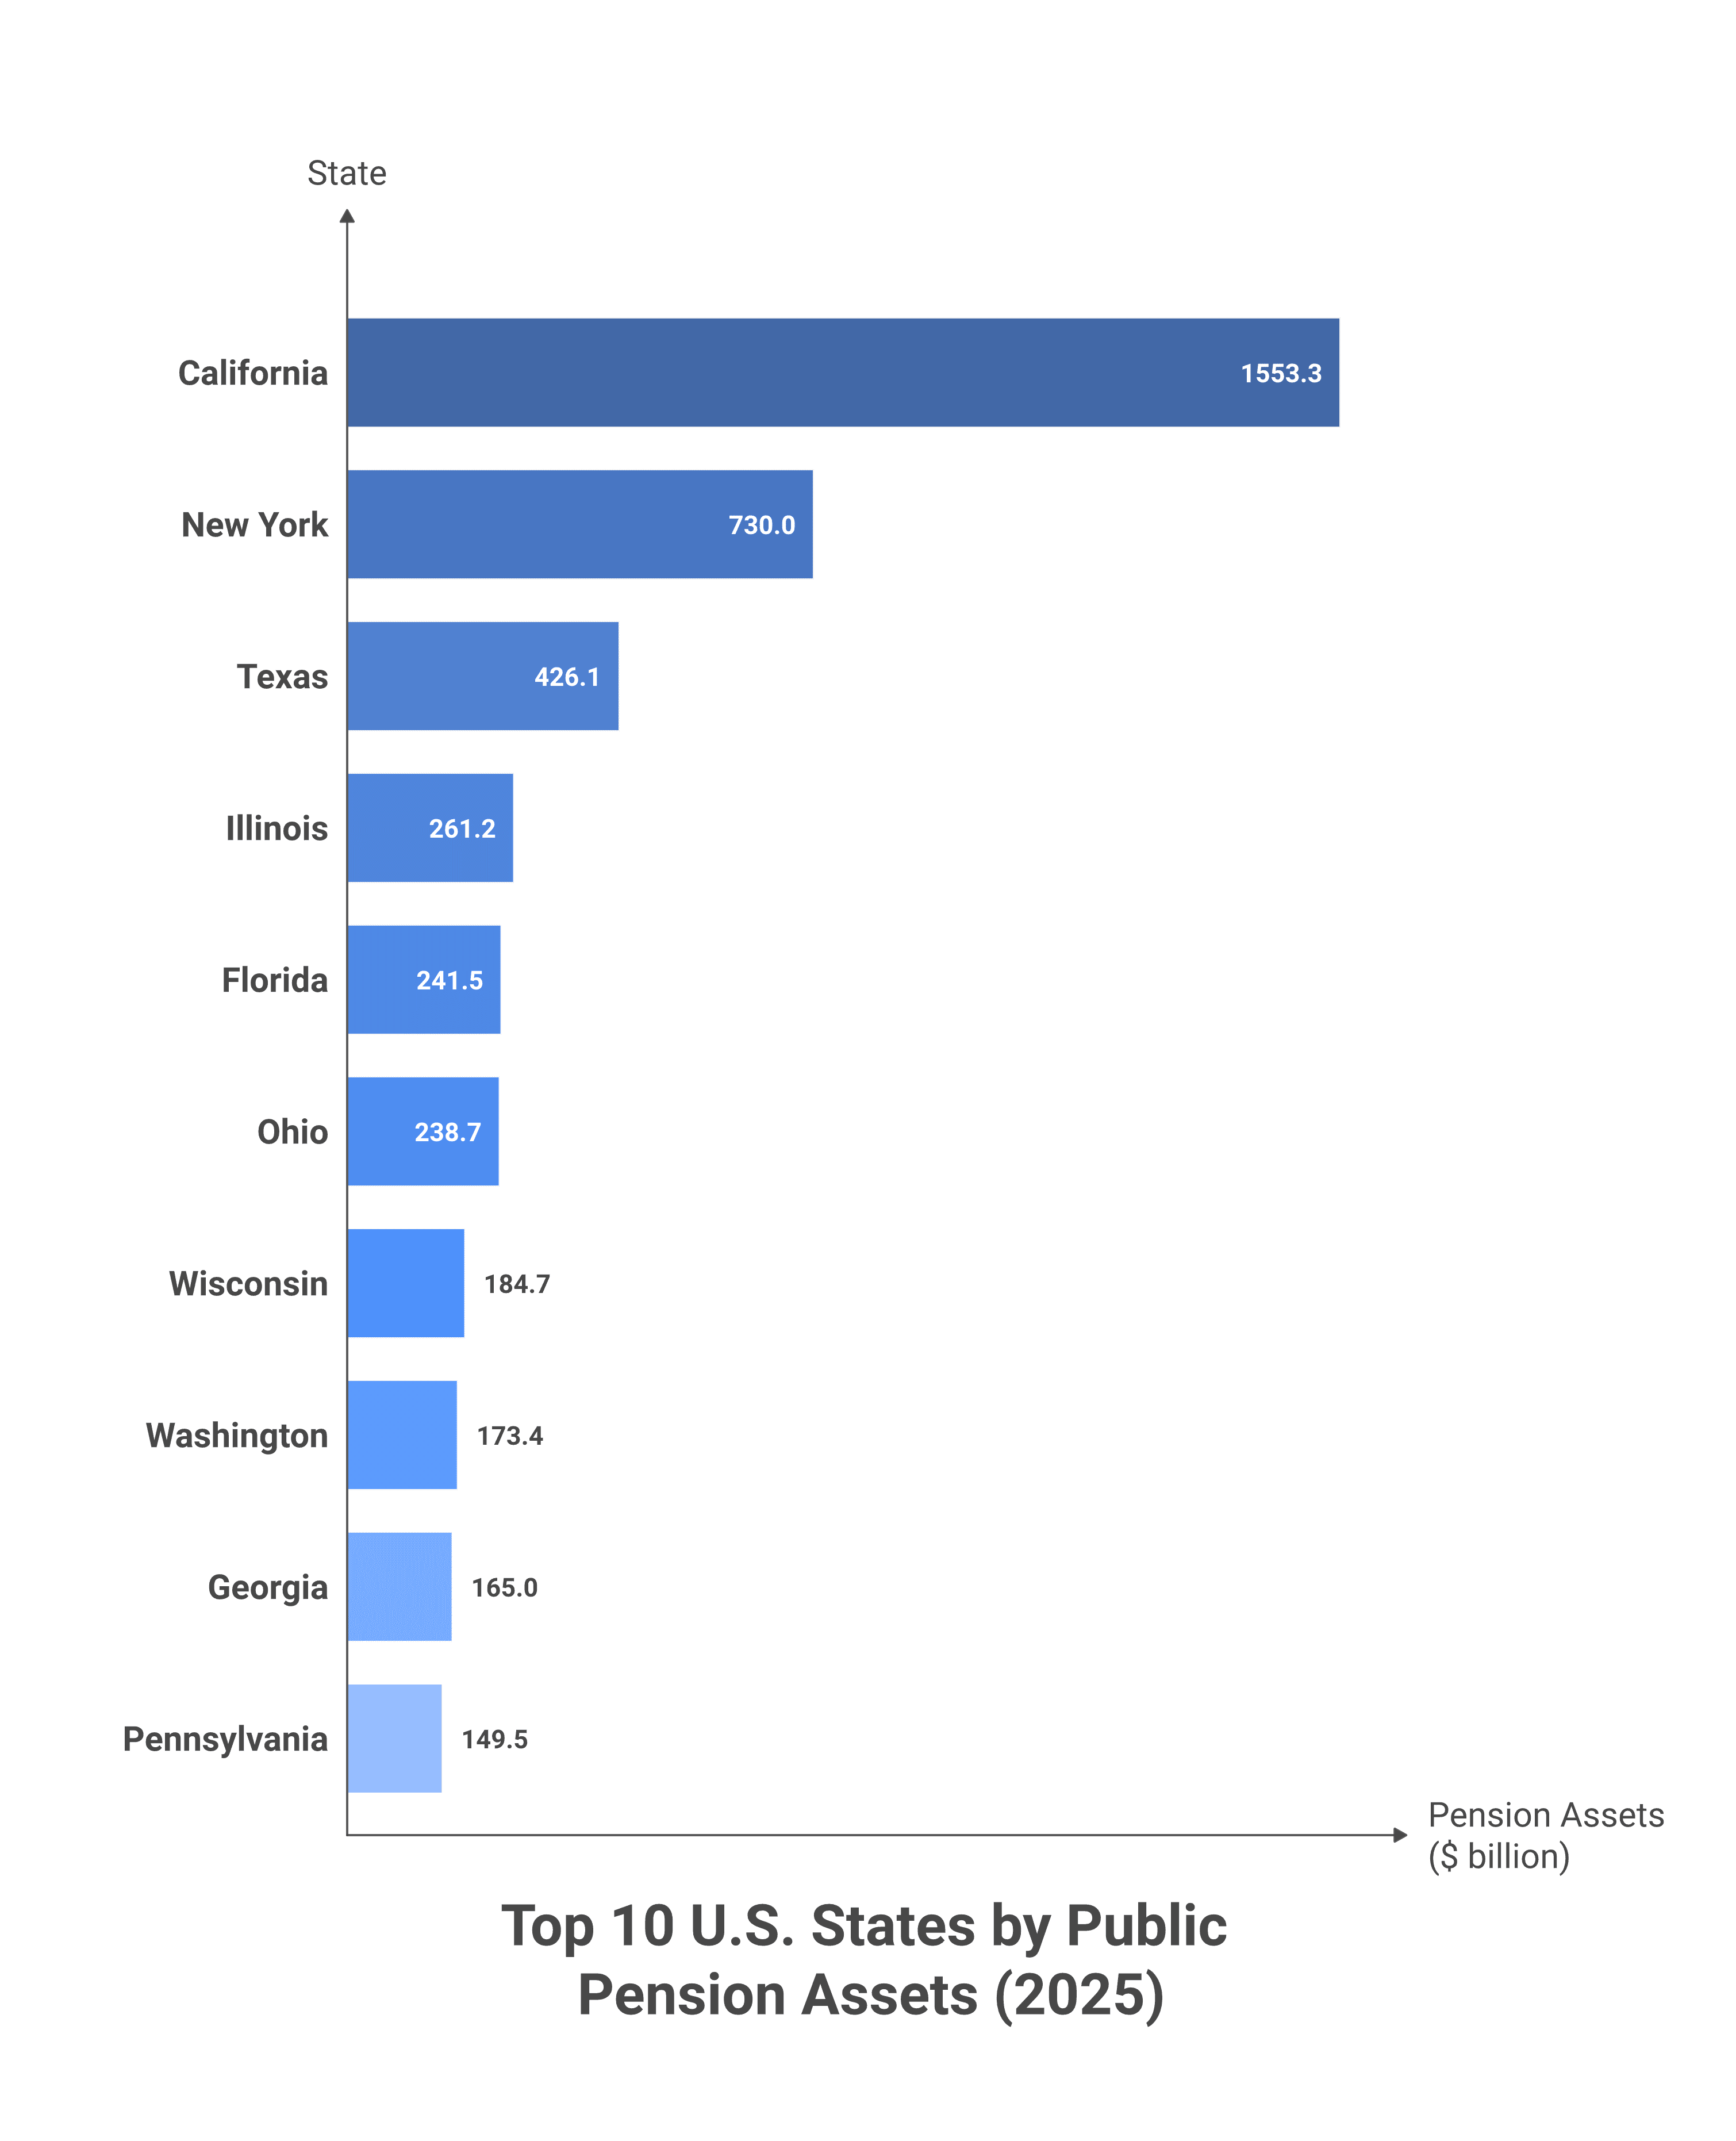
Top 10 States by Total Pension Assets
The ten largest state pension systems account for about 65% of all U.S. public pension wealth. California alone holds almost a quarter of the national total.
| Rank | State | Total Pension Assets | Per Capita |
|---|---|---|---|
| 1 | California | $1,553.3B | $39,392 |
| 2 | New York | $730.0B | $36,743 |
| 3 | Texas | $426.1B | $13,616 |
| 4 | Illinois | $261.2B | $20,547 |
| 5 | Florida | $241.5B | $10,334 |
| 6 | Ohio | $238.7B | $20,086 |
| 7 | Wisconsin | $184.7B | $30,983 |
| 8 | Washington | $173.4B | $21,794 |
| 9 | Georgia | $165.0B | $14,755 |
| 10 | Pennsylvania | $149.5B | $11,428 |
California’s lead is structural, not cyclical. CalPERS, CalSTRS, and the University of California Retirement Plan together cover a workforce of millions in the most populous and highest-wage state. New York’s number is anchored by the New York State Common Retirement Fund and the New York City pension systems, which fund some of the most generous retirement promises in American government. Texas is a distant third despite its size — its plans run leaner, and many local Texas employees are covered by Social Security alongside their pensions (Californians and New Yorkers in their state systems often are not).
Per-Capita Leaders and Laggards
Total assets reward population size. To see which states have actually saved the most for their public workers’ retirements, divide by residents:
- California — $39,392 per resident. The Golden State combines a massive pension workforce with strong investment returns at CalPERS and CalSTRS.
- New York — $36,743. Generous benefit formulas plus a long history of consistent funding.
- Wisconsin — $30,983. The Wisconsin Retirement System is consistently ranked among the most fully funded public pensions in the country — one of the few large state plans rated near 100% funded.
- Alaska — $26,701. Small population, but the state inherited generous pension promises from the oil-boom era.
- District of Columbia — $25,239. A city-state with a federal-style workforce and consolidated plan structure.
At the other end:
- Indiana — $7,285 per resident. The lowest in the nation. Indiana’s plans have historically been less generous and less aggressively funded than peers.
- South Carolina — $9,103. Long-running underfunding has left South Carolina with one of the worst funded ratios in the U.S.
- New Hampshire — $9,733. Small public workforce, smaller plans.
- Florida — $10,334. A surprise low ranking given Florida is fifth in total assets — explained by its 23 million residents diluting the per-capita figure.
A high per-capita figure doesn’t automatically mean a well-funded plan, and a low one doesn’t mean a bad one. What it does tell you is how much the state has socked away relative to the population that ultimately backs the promise. States with low per-capita assets but rich benefit formulas are the ones to watch — that’s where the funding gap accumulates.
Where the Money Comes From
In fiscal 2025, state and local pension plans received $315.02 billion in contributions. The split:
- Governments contributed 75.17% — $236.8 billion. That money comes from the same tax base that funds schools, roads, and police — which is why pension funding levels matter for state and local budgets every year.
- Employees contributed 24.83% — $78.2 billion, deducted from public-sector paychecks.
That ratio has been remarkably stable for decades. The political math is simple: shifting more burden to employees requires renegotiating union contracts, and most public-employee unions have resisted larger paycheck deductions.
How the Survey Works
The Annual Survey of Public Pensions covers all defined-benefit public retirement plans — the kind where the employer promises a specific monthly benefit at retirement, calculated from years of service and final salary. Defined-contribution plans (like 401(k) and 457(b) accounts) are not included; the survey is about traditional pensions, not retirement accounts that public employees may have alongside their pension.
Asset values are reported at end of each plan’s fiscal year (usually June 30 for state plans, December 31 for many local plans). The figures reflect market value of holdings — so an 8% rise from 2024 to 2025 reflects both new contributions and investment returns. 2025 was a strong year for public pension investment portfolios, with equity-heavy plans riding broader market gains.
The survey covers 1,948 individual plans across the 50 states and D.C. The unit file behind these state totals is publicly available from the Census Bureau and was the source for every figure in this post.
Conclusion
$6.49 trillion is a large number, but the more interesting story is the dispersion behind it. The same federal system produces pension fortunes that vary 5x per resident from one state to the next — driven by benefit generosity, funding discipline, state population, and decades of investment performance. The map shows you who has saved aggressively for their public workers’ retirements, and who hasn’t. The next decade — as the 1970s baby-boom public-sector workforce moves fully into retirement — will be the real stress test of those choices.
This post uses data from the U.S. Census Bureau's Annual Survey of Public Pensions (May 2026 release, covering fiscal year 2025) and Vintage 2024 state population estimates. State pension asset totals are computed from the public-use individual unit file (item code RZ01 — total cash and securities holdings at end of fiscal year), aggregated by state.
Primary Data Sources:
- U.S. Census Bureau — 2025 Annual Survey of Public Pensions – State + local defined-benefit pension plan financial data, individual unit file, May 2026 release.
- U.S. Census Bureau — Press Release CB25-TPS.31 – National headlines: $6.49T total, 37M participants, $418.25B in benefits paid in 2025.
- U.S. Census Bureau — Vintage 2024 State Population Estimates – State population denominators used to compute per-capita asset figures (NST-EST2024).
Image Sources:
- Colorado State Capitol — Kevy Michaels on Unsplash – Featured image.