Key Takeaways
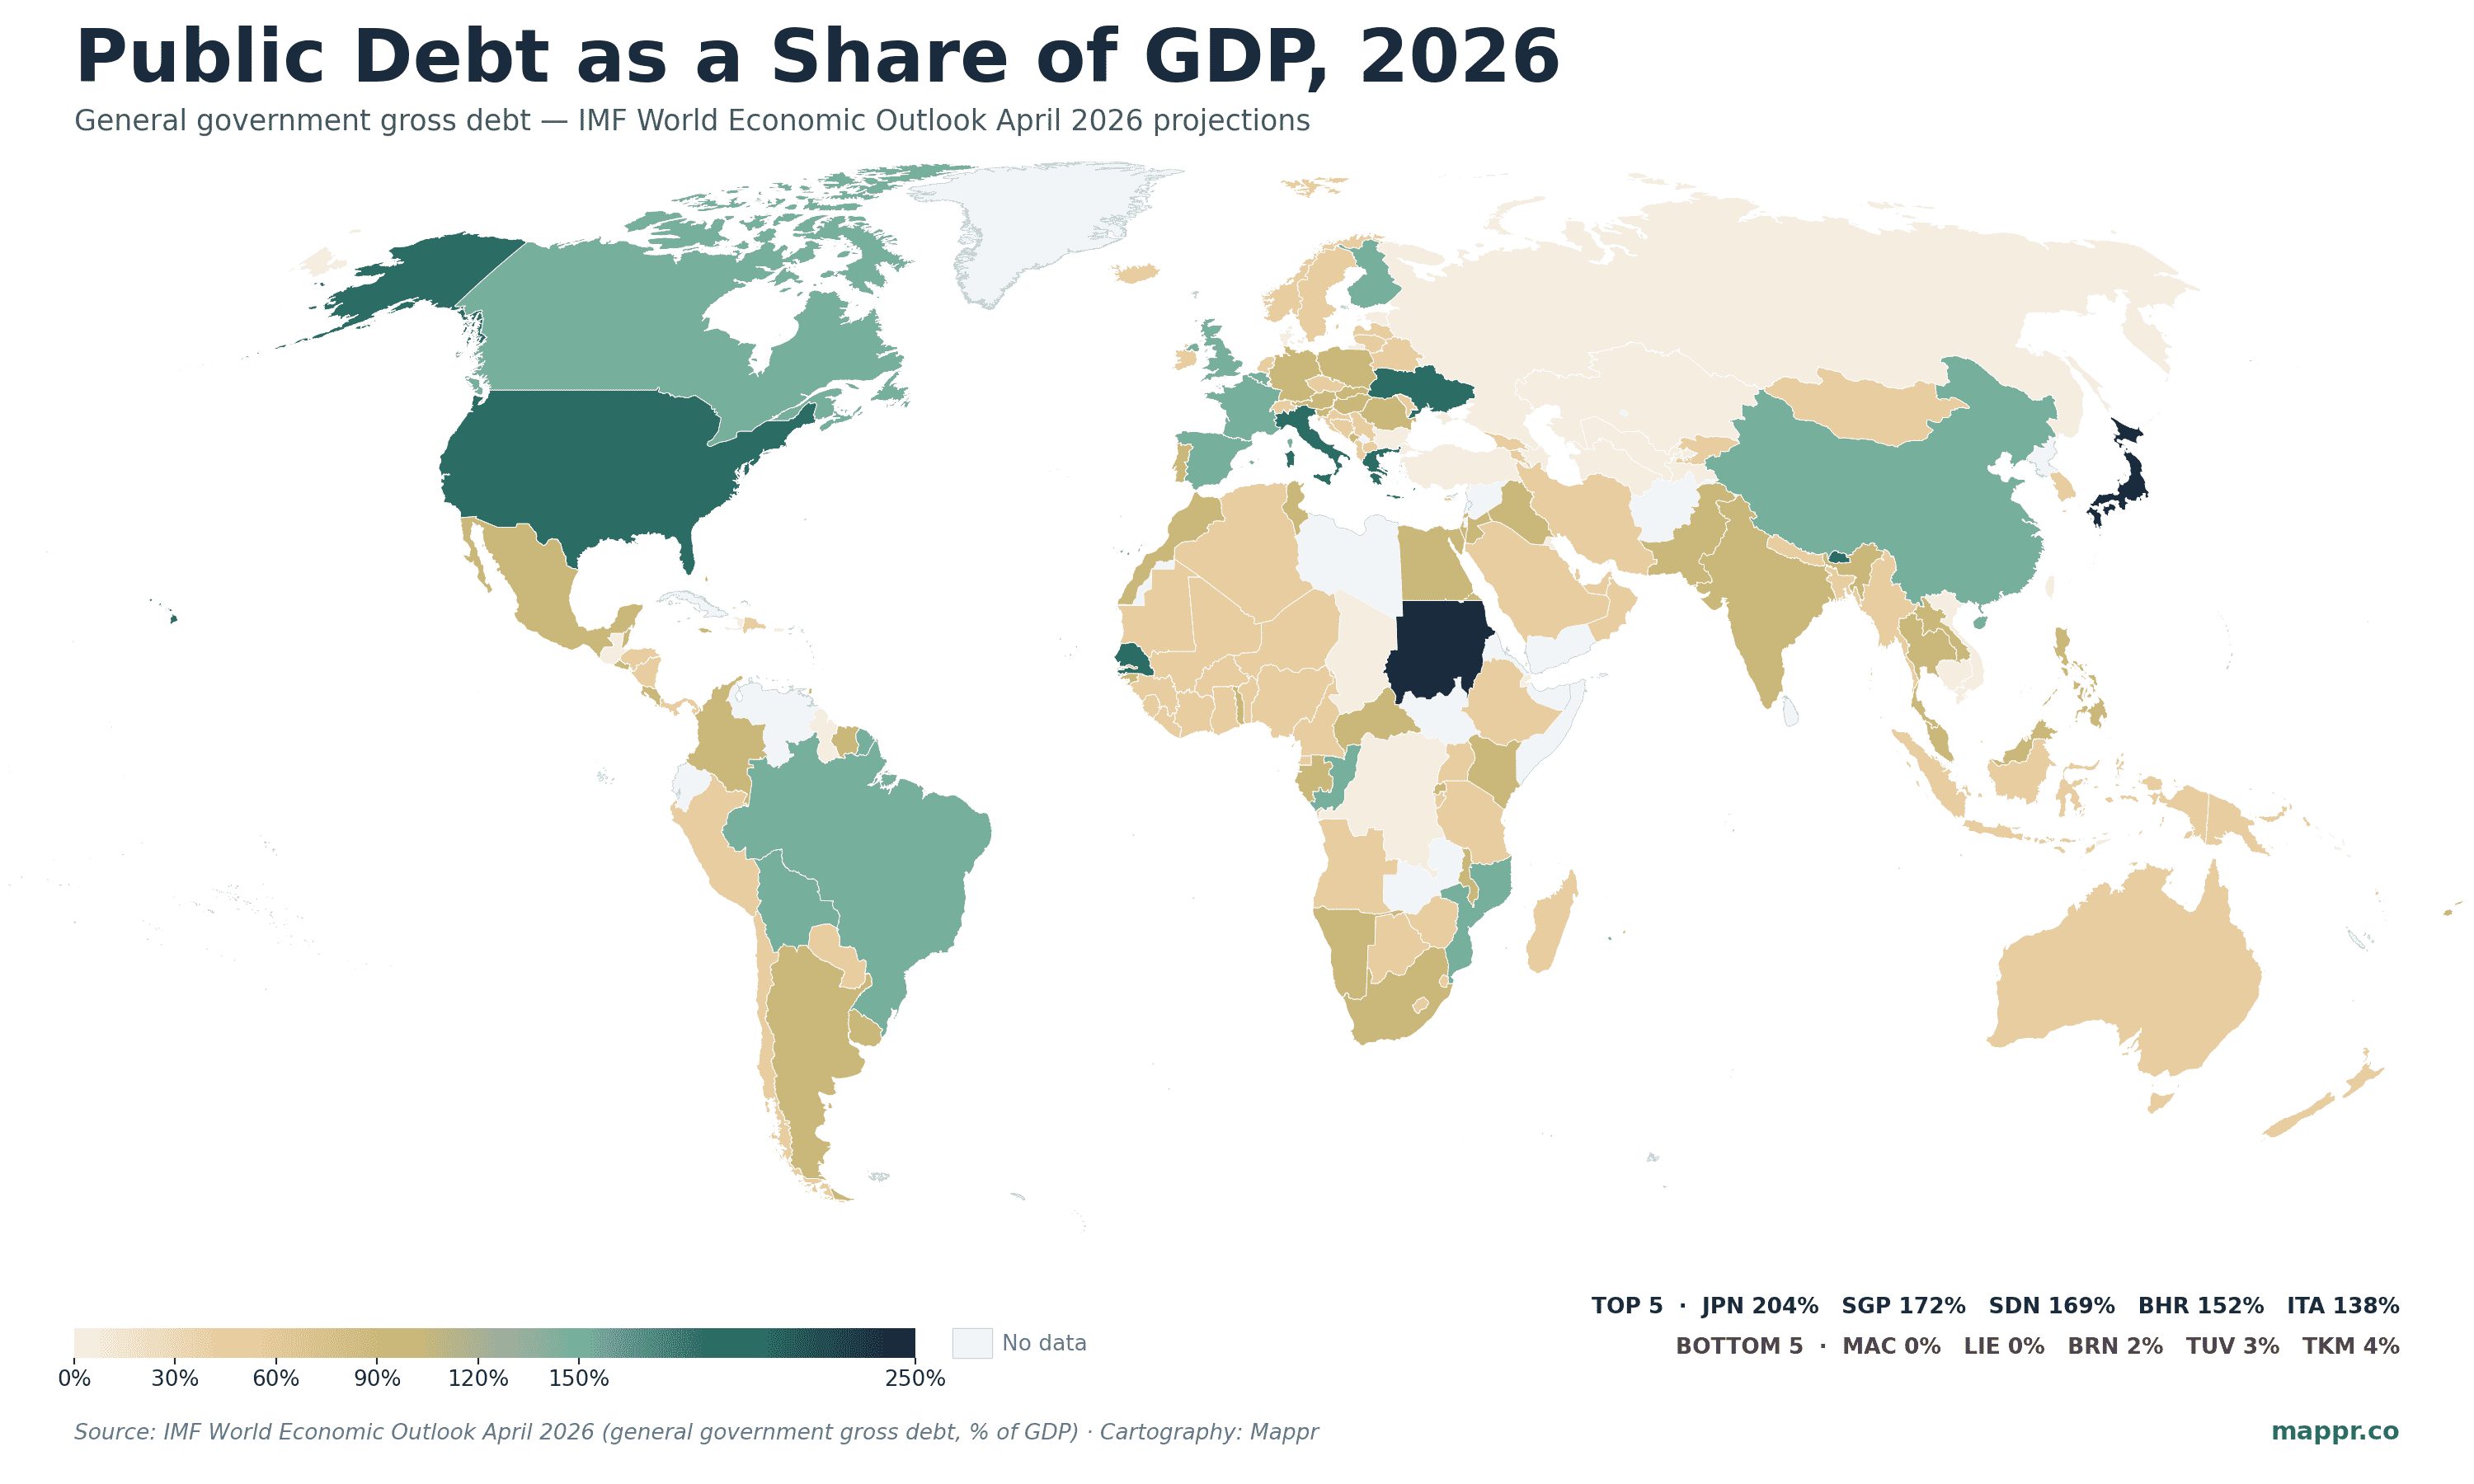
- 23 countries owe more than they produce in a year. General government gross debt exceeds 100% of GDP in 23 countries in 2026, led by Japan at 204%, Singapore at 172%, Sudan at 169%, Bahrain at 152%, Italy at 138%, Greece at 137%, the United States at 126%, and France at 118%.
- US is on the steepest path among G7. IMF projects US public debt to climb from 126% of GDP in 2026 to 142% by 2031 — the largest absolute increase among advanced economies and the trajectory most cited as a fiscal-stability concern in 2026 markets.
- China just crossed the 100% line. China's general government debt is projected at 107% of GDP in 2026 (counting on-balance-sheet local government financing vehicles) and 127% by 2031 — the second-largest rise after the US among the world's ten biggest economies.
- Gulf and post-Soviet petrostates are debt-light. Saudi Arabia (32%), UAE (31%), Qatar (43%), Kuwait (22%), Russia (19%), and Norway (44%) sit well below the global advanced-economy average — sovereign wealth funds and oil-revenue surpluses keep gross debt low even as fiscal positions vary.
The International Monetary Fund’s April 2026 World Economic Outlook dropped in the middle of a year already defined by tariff tensions, inflation hangovers, and renewed recession chatter. Buried in the data tables behind the headline growth forecasts is the most authoritative global picture of how much each country owes — and where those debt trajectories are heading by 2031.
The headline number for editors: 23 economies carry general government gross debt above 100% of GDP in 2026. The list runs from postwar-record Japan (204%) to a cluster of advanced-economy fiscal stragglers — Italy, Greece, France, Belgium, the United States, the United Kingdom, Canada — alongside small island states with limited revenue bases and a few war- or restructuring-driven outliers like Sudan and Ukraine. Below them, the world’s debt geography fans out into surprisingly low ratios for the Gulf petrostates, Russia, and most of post-Soviet Central Asia.
This post maps 2026 IMF debt projections for every country and surfaces where the trajectory is heading by the end of the decade.
The Top 15 Debtors in 2026
Fifteen economies carry public debt above 100% of GDP in the IMF’s 2026 projection. The composition is a mix of high-income chronic debtors (Japan, Italy, Greece, France, US, UK, Belgium, Canada), small island/specialty economies with deliberate financial-engineering reasons for the headline number (Singapore, Maldives, Saint Vincent & the Grenadines, Bhutan), and conflict- or crisis-driven cases (Sudan, Ukraine).
| Country | Debt 2026 (% GDP) | Debt 2031 (% GDP) | Notes |
|---|---|---|---|
| 🇯🇵 Japan | 204.4% | 192.8% | Highest ratio in the developed world for 30+ years; held mostly domestically |
| 🇸🇬 Singapore | 171.9% | 174.7% | Mostly Singapore Government Securities matched against CPF balances — gross figure overstates net |
| 🇸🇩 Sudan | 169.1% | 116.3% | Conflict-driven spike; major restructuring projected via 2031 |
| 🇧🇭 Bahrain | 152.4% | 161.2% | Outlier in the Gulf — long-running fiscal deficits not absorbed by oil revenues |
| 🇮🇹 Italy | 138.4% | 136.1% | Persistent post-1990s structural debt; modest improvement projected |
| 🇬🇷 Greece | 136.9% | 110.9% | Sharpest projected decline in the top 15 (-26pp) post the 2010s bailout era |
| 🇸🇳 Senegal | 132.3% | 121.4% | 2024 fiscal review revealed previously underreported debt; restructuring underway |
| 🇲🇻 Maldives | 129.4% | 131.9% | Tourism-economy vulnerability; trajectory flat |
| 🇺🇸 United States | 125.8% | 142.1% | Steepest projected rise in the developed world (+16.3pp) |
| 🇺🇦 Ukraine | 122.6% | 119.6% | War-driven; trajectory depends on settlement and reconstruction financing |
| 🇧🇹 Bhutan | 120.3% | 124.0% | Hydropower investment loans drive the headline ratio |
| 🇻🇨 St Vincent & Grenadines | 120.1% | 144.7% | Rising — small economy with limited diversification |
| 🇫🇷 France | 118.4% | 120.7% | Recent political paralysis has delayed deficit reduction; small projected rise |
| 🇨🇦 Canada | 110.7% | 103.5% | Higher than commonly assumed (federal + provincial counted together) |
| 🇧🇪 Belgium | 109.2% | 122.3% | Resumed upward trajectory after the 2010s consolidation |
The US Is on the Steepest Trajectory
The single most consequential number in the April 2026 WEO for global financial markets is the United States debt path. The IMF projects US general government debt to rise from 126% of GDP in 2026 to 142% by 2031 — a 16.3-percentage-point increase that is the largest absolute deterioration among advanced economies, exceeding even Italy’s chronic high-water mark.
The drivers are familiar but newly accelerating: the Tax Cuts and Jobs Act extension passed in late 2025 added roughly $4.5 trillion in 10-year debt; tariff revenue projections are running below initial Treasury estimates; and primary deficit projections for 2027–2031 average 6.7% of GDP — well above the 3.5% level historically associated with debt stabilisation. The Congressional Budget Office’s separate January 2026 baseline projects a similar trajectory and reaches 145% of GDP by 2035.
Markets have started repricing the path: the 30-year Treasury yield has averaged 4.9% in Q1 2026, 80 basis points above its 2010s average, and term-premium decompositions point most of that increase to fiscal-supply concerns rather than inflation expectations. The “debt mountain” framing is back in the policy conversation in a way it has not been since the 2011 debt-ceiling crisis.
China Just Crossed the 100% Line
China is the most-watched debt story after the US. The IMF’s broad measure of general government debt — which counts central government, explicit local government debt, and the on-balance-sheet share of local government financing vehicles (LGFVs) — puts China at 106.9% of GDP in 2026, up from 84% in 2022 and projected to reach 126.8% by 2031. The 19.9-percentage-point projected increase is the second-largest in the global top 10 after the US.
The composition matters: most of China’s headline debt is held by state-owned banks and Chinese household savings, and the central government’s own ratio is closer to 25% — the rest is provincial, municipal, and quasi-public liabilities that have been progressively recategorised as “general government” since the 2024 IMF review. The trajectory is driven by demographic pressure on the pension system, slowing growth eroding the GDP denominator, and the late-2025 Beijing fiscal stimulus aimed at stabilising the property sector.
Where Debt Is Lowest: Gulf Petrostates and Post-Soviet Central Asia
The bottom of the global debt distribution is dominated by petrostates with sovereign-wealth-fund buffers and a handful of small economies with unusual fiscal structures.
- Macau (0.0%) and Liechtenstein (0.5%) top the cleanest balance sheets — neither runs a meaningful sovereign debt programme
- Brunei (1.5%), Tuvalu (3.2%), Turkmenistan (3.7%) — small or commodity-rich economies with surplus-funded fiscal regimes
- Russia (19.1%) — heavily sanctioned but maintains low gross debt; projected to rise to 29% by 2031 as war spending continues
- Kuwait (22.3%), UAE (31.4%), Saudi Arabia (32.1%), Qatar (43.3%) — Gulf states with large sovereign wealth funds against the gross debt
- Norway (44.0%) — Government Pension Fund Global ($1.7 trillion) is several times gross debt; net position is deeply positive
- Switzerland (38.3%), South Korea (54.4%), Australia (61.0%), Germany (64.6%) — advanced economies that ran 2010s consolidations and held the line
Where the Trajectory Is Heading: 2026 → 2031
The April 2026 WEO’s six-year projections highlight the divergence between economies on consolidating paths and those still adding debt. The cleanest framing of the trajectory story:
| Trajectory | Country | 2026 → 2031 | Driver |
|---|---|---|---|
| 📈 Biggest rises | 🇨🇳 China | 107% → 127% (+19.9pp) | Property-sector stimulus, demographic pressure |
| 🇺🇸 USA | 126% → 142% (+16.3pp) | TCJA extension, primary deficits 6%+ of GDP | |
| 🇸🇦 Saudi Arabia | 32% → 42% (+10.1pp) | Vision 2030 megaprojects financed via debt | |
| 🇧🇷 Brazil | 97% → 107% (+10.0pp) | Higher real interest rates compounding | |
| 🇷🇺 Russia | 19% → 29% (+10.0pp) | Sustained war-economy spending | |
| 📉 Biggest declines | 🇸🇩 Sudan | 169% → 116% (-52.8pp) | Restructuring + GDP recovery from current contraction |
| 🇬🇷 Greece | 137% → 111% (-26.0pp) | Post-bailout primary surpluses + ECB asset disposal | |
| 🇦🇷 Argentina | 70% → 52% (-18.2pp) | Milei-era fiscal adjustment + IMF programme | |
| 🇯🇵 Japan | 204% → 193% (-11.6pp) | Inflation eroding real debt + nominal GDP growth | |
| 🇮🇹 Italy | 138% → 136% (-2.3pp) | Modest consolidation under Meloni-era fiscal targets |
Why This Map Matters Right Now
Debt-to-GDP is not a fixed danger threshold. Japan has run above 100% for 30 years without a sovereign crisis; Argentina restructured at 70%. What matters is the combination of level, trajectory, currency composition, and holder base: domestically-held debt in your own currency at a falling trajectory is qualitatively different from foreign-currency external debt rising into a refinancing wall.
That said, the 2026 IMF data does point to three currents that are likely to dominate sovereign-debt headlines through the rest of the decade. First, the US trajectory is the central source of global term-premium pressure — every advanced-economy borrower is pricing relative to a benchmark that the IMF expects to deteriorate by 16 points in five years. Second, China’s debt buildup is the largest emerging-market story but unusually opaque, since most of the increase comes from re-categorisation of LGFV liabilities rather than new issuance. Third, a small group of frontier and small-island economies (Maldives, Saint Vincent & the Grenadines, Bhutan, Senegal) is in the danger zone where modest external shocks can flip from manageable to disorderly.
For everyone else, 2026 is a year of trajectory divergence: Greece, Argentina, and Sudan on cleansing paths; the US, China, Saudi Arabia, and Brazil on rising ones; the Gulf wealth funds and post-Soviet petrostates riding low debt as the rest of the world’s borrowing costs creep up.