Key Takeaways
- Most of humanity now has too few babies. In 2024, 131 of the 237 countries and territories tracked by the UN (55%) had fertility below the 2.1 replacement level — and those countries are home to roughly two-thirds of the world's people.
- The global average has halved since the 1960s. Births per woman worldwide fell from about five in the 1960s to 2.2 in 2024 — barely above replacement, and still dropping.
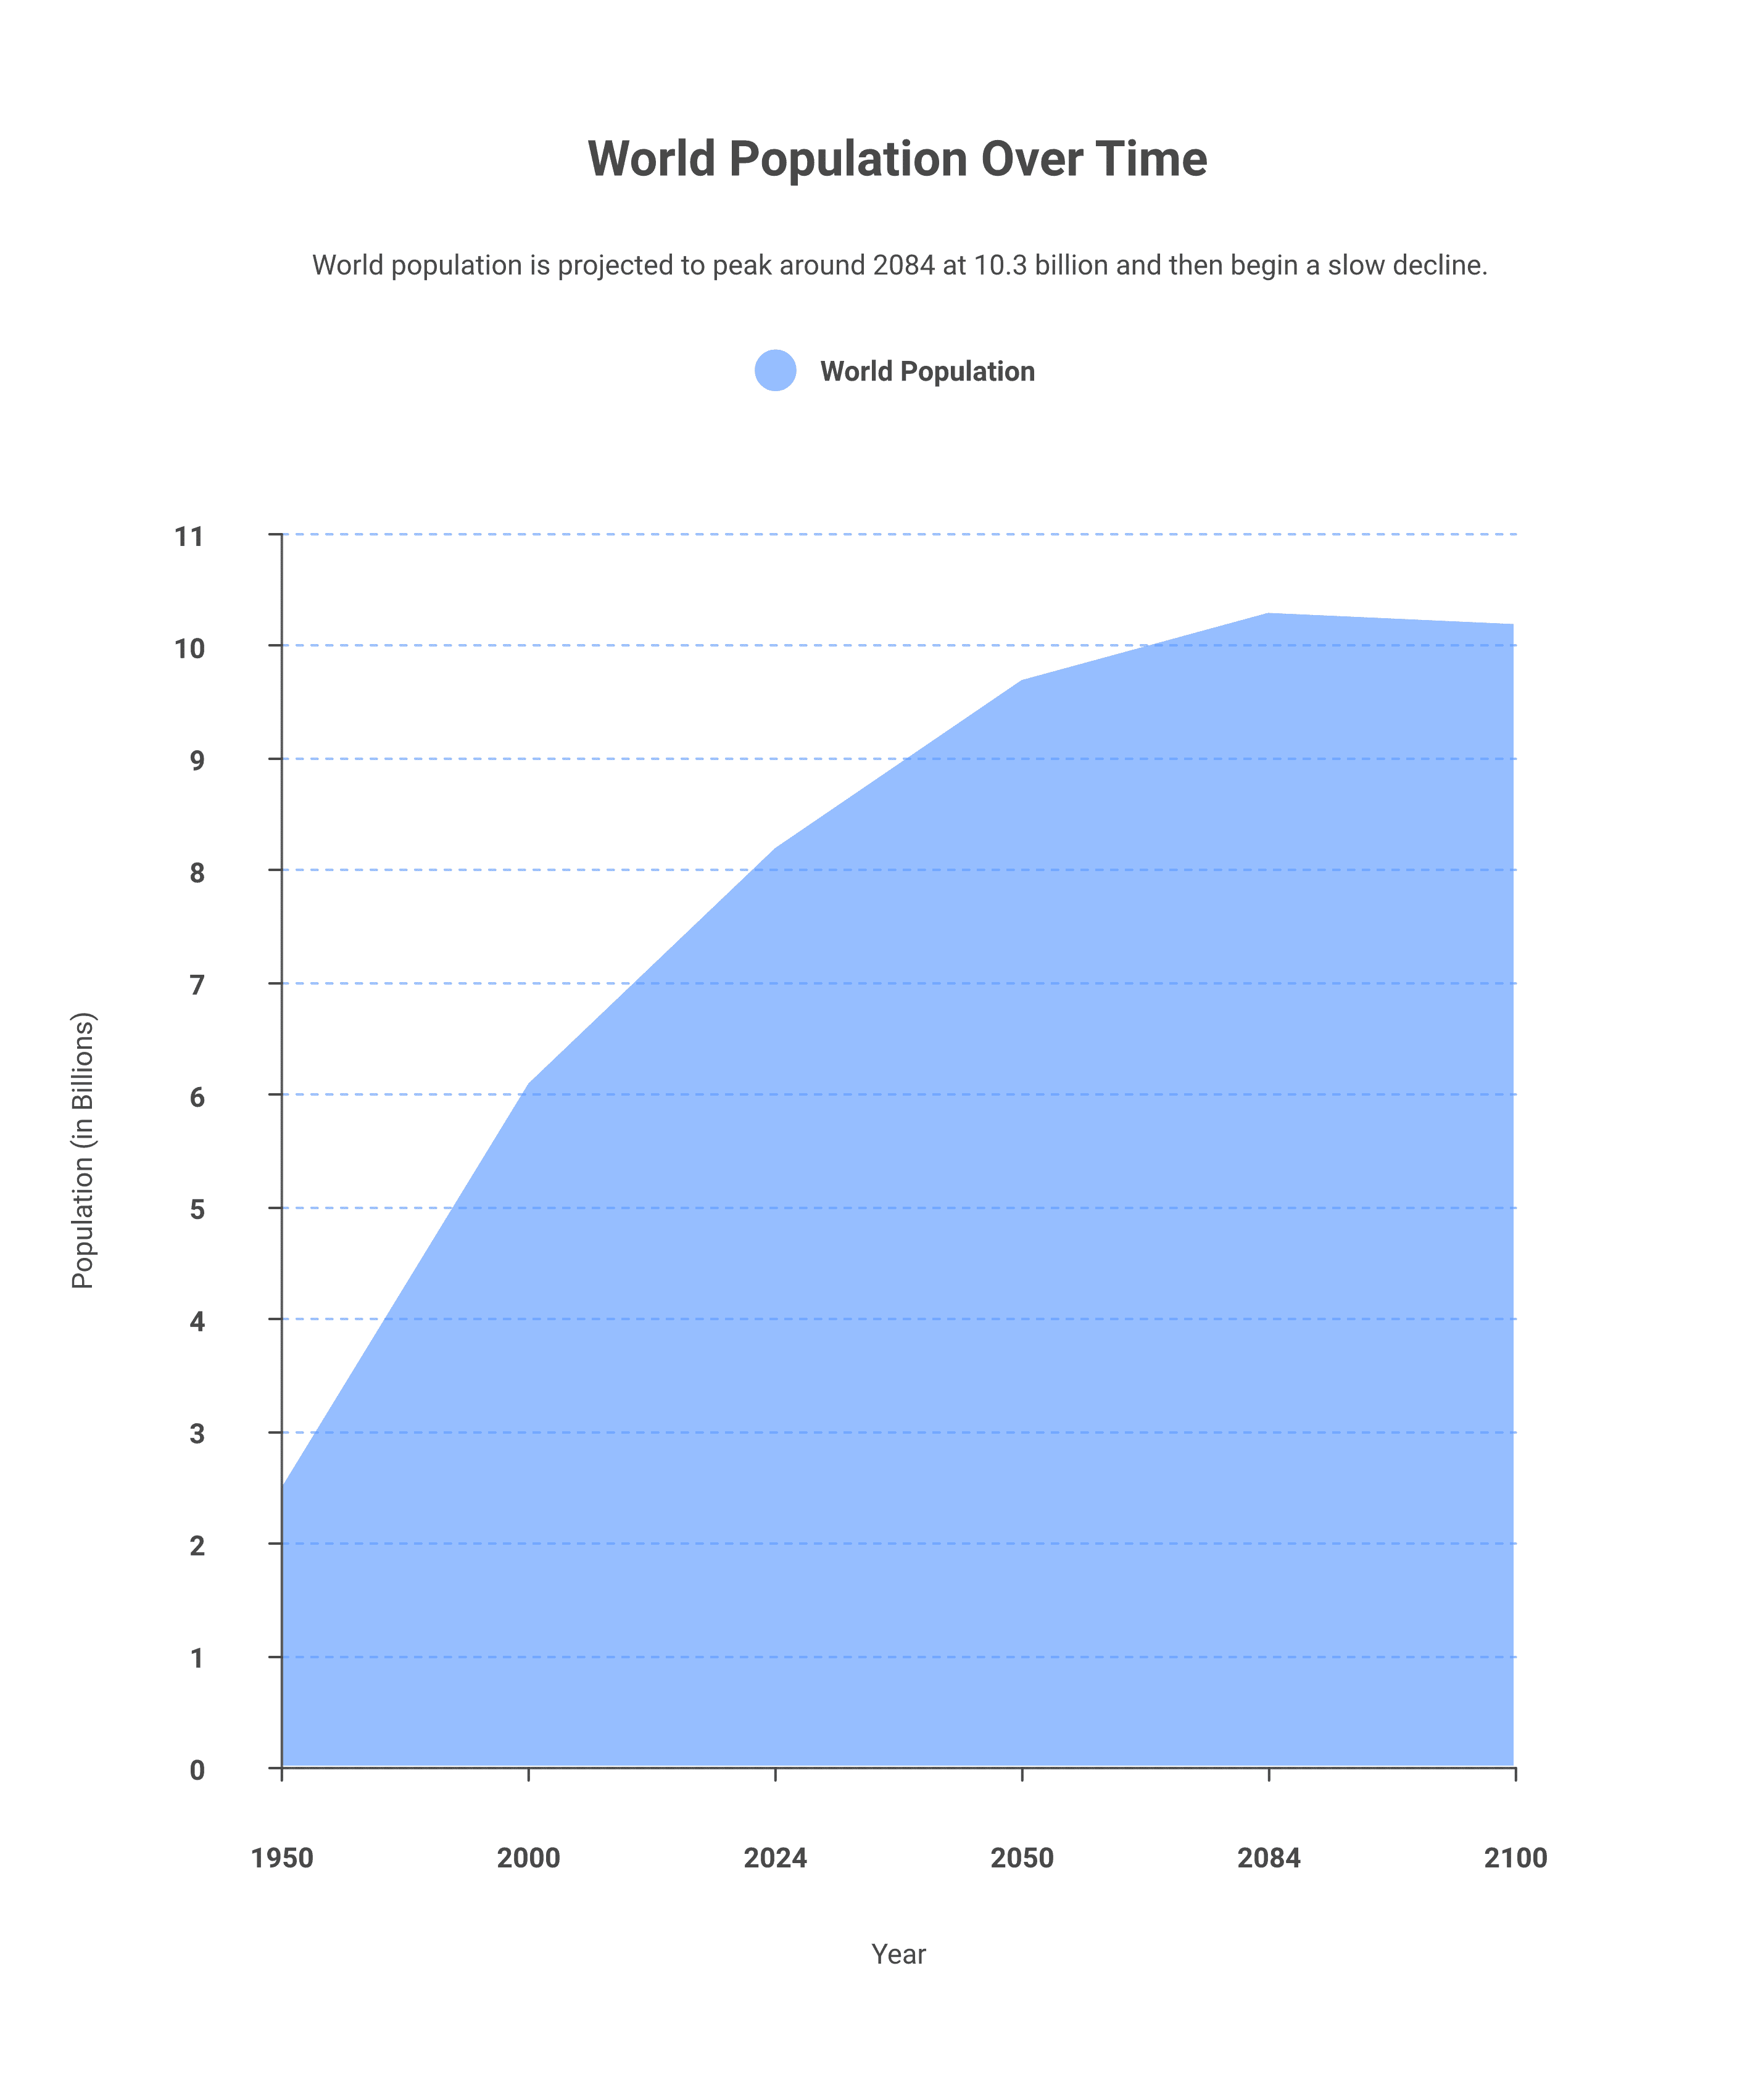
- Population still peaks around 2084. Because of demographic momentum, the world keeps growing from 8.2 billion today to a peak near 10.3 billion in the mid-2080s, then begins a slow decline — the first sustained fall in modern history.
- A planet split in two. East Asia and Europe are far below replacement (South Korea 0.75, China 1.0, Spain 1.1), while Sub-Saharan Africa is still high — Niger, Chad and Somalia all near six births per woman.
- No country has cracked the code. Experts agree that family support, gender equality and immigration help at the margins — but no nation has reliably pulled its fertility rate back up to replacement once it fell below.
The single most important number for the human future this century may not be GDP growth or global temperature. It is 2.1 — the average number of children a woman must have for a population to replace itself. For most of human history that number was never in doubt. Today, most of humanity lives below it.
The global fertility rate has fallen from roughly five births per woman in the 1960s to about 2.2 in 2024, and it is still sliding. The United Nations now counts 131 of 237 countries and territories below replacement, together home to around two-thirds of the world’s population. We mapped the latest figures for every country — and the result is a planet quietly splitting in two. (For the flip side of the story, see our companion map of population growth in every country, 2000–2025.)
Fertility Rates Around the World in 2024
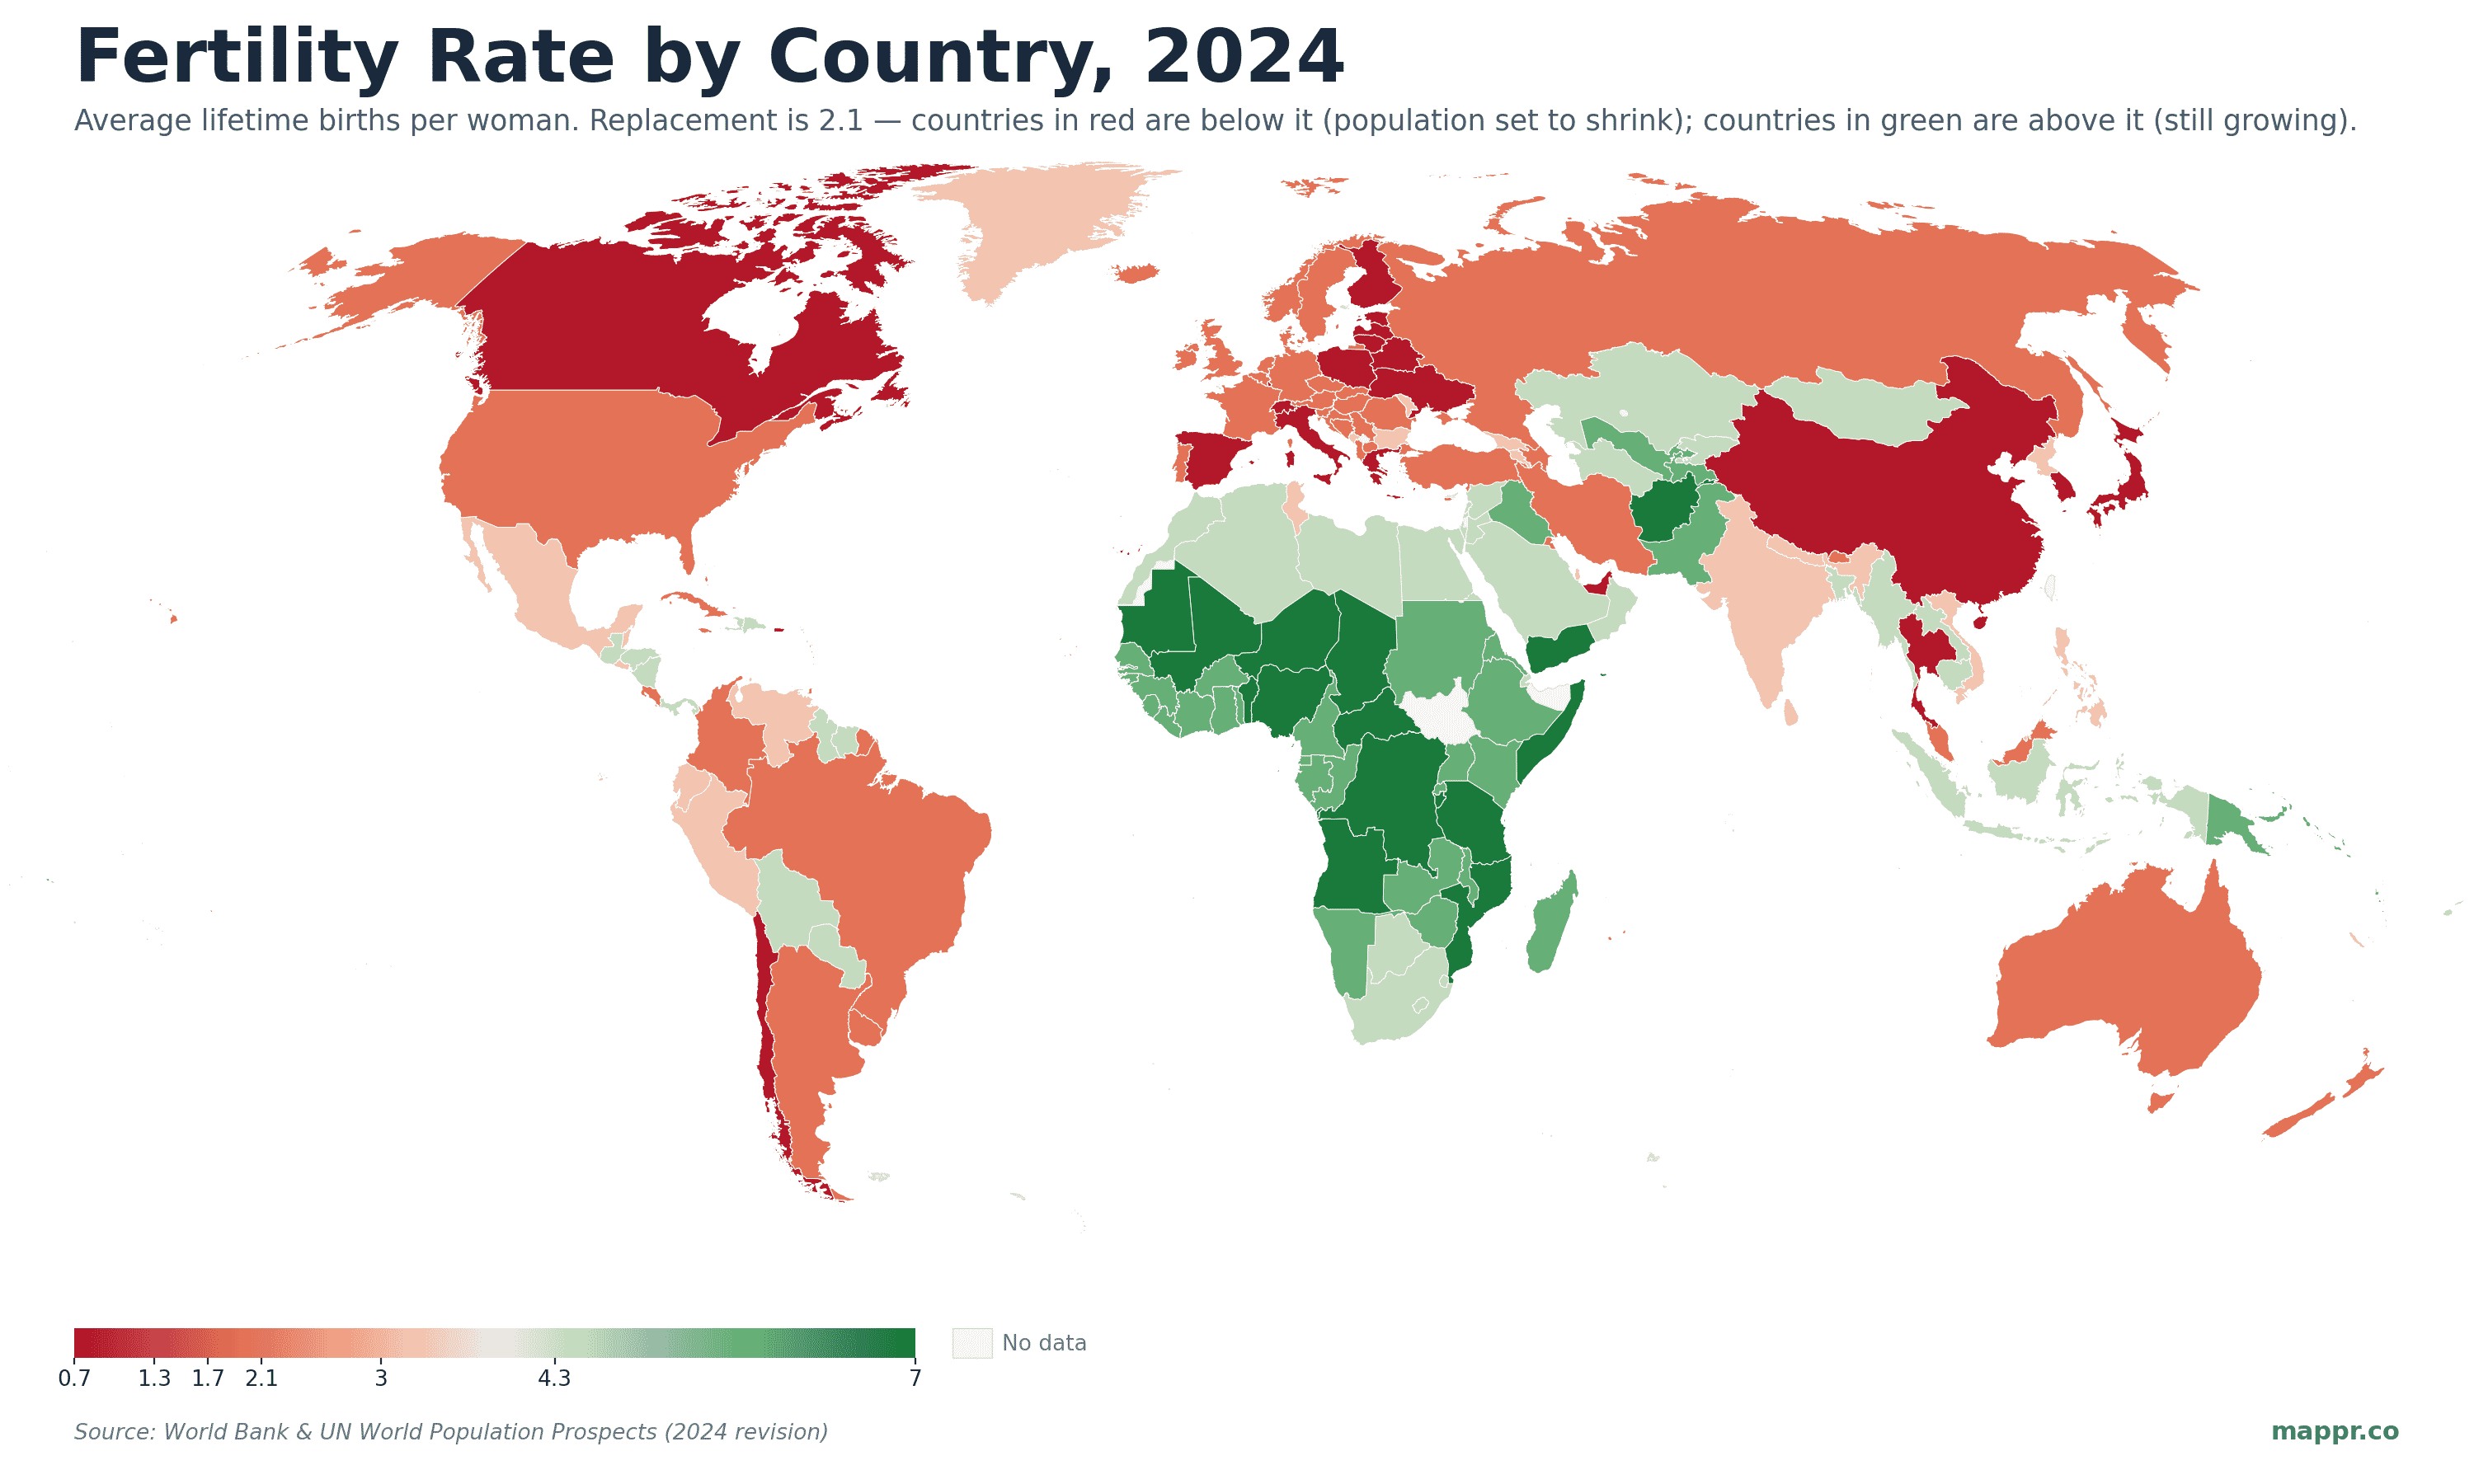
The divide is stark. Almost the entire developed world — Europe, North America, East Asia, Australia — plus China and much of Latin America now sits below replacement (the red countries). Sustained high fertility survives in just one large region: Sub-Saharan Africa, joined by a handful of countries such as Afghanistan. Nearly every green country on the map is African.
Why 2.1 Is the Magic Number
“Replacement-level fertility” is the rate at which each generation exactly replaces the one before it. It is 2.1 rather than 2.0 because not every child survives to adulthood, and slightly more boys are born than girls. Below 2.1, each generation is smaller than the last, and — eventually — the population shrinks.
The word eventually is doing a lot of work. A country can sit below replacement for decades while its population still grows, because of demographic momentum: when a large generation born in higher-fertility times moves through its child-bearing years, births keep outnumbering deaths even though each woman is having fewer children. That lag is exactly why the global headcount keeps climbing despite a sub-replacement world — and why the turning point is still decades away.
The Two Extremes
The lowest: East Asia and Europe
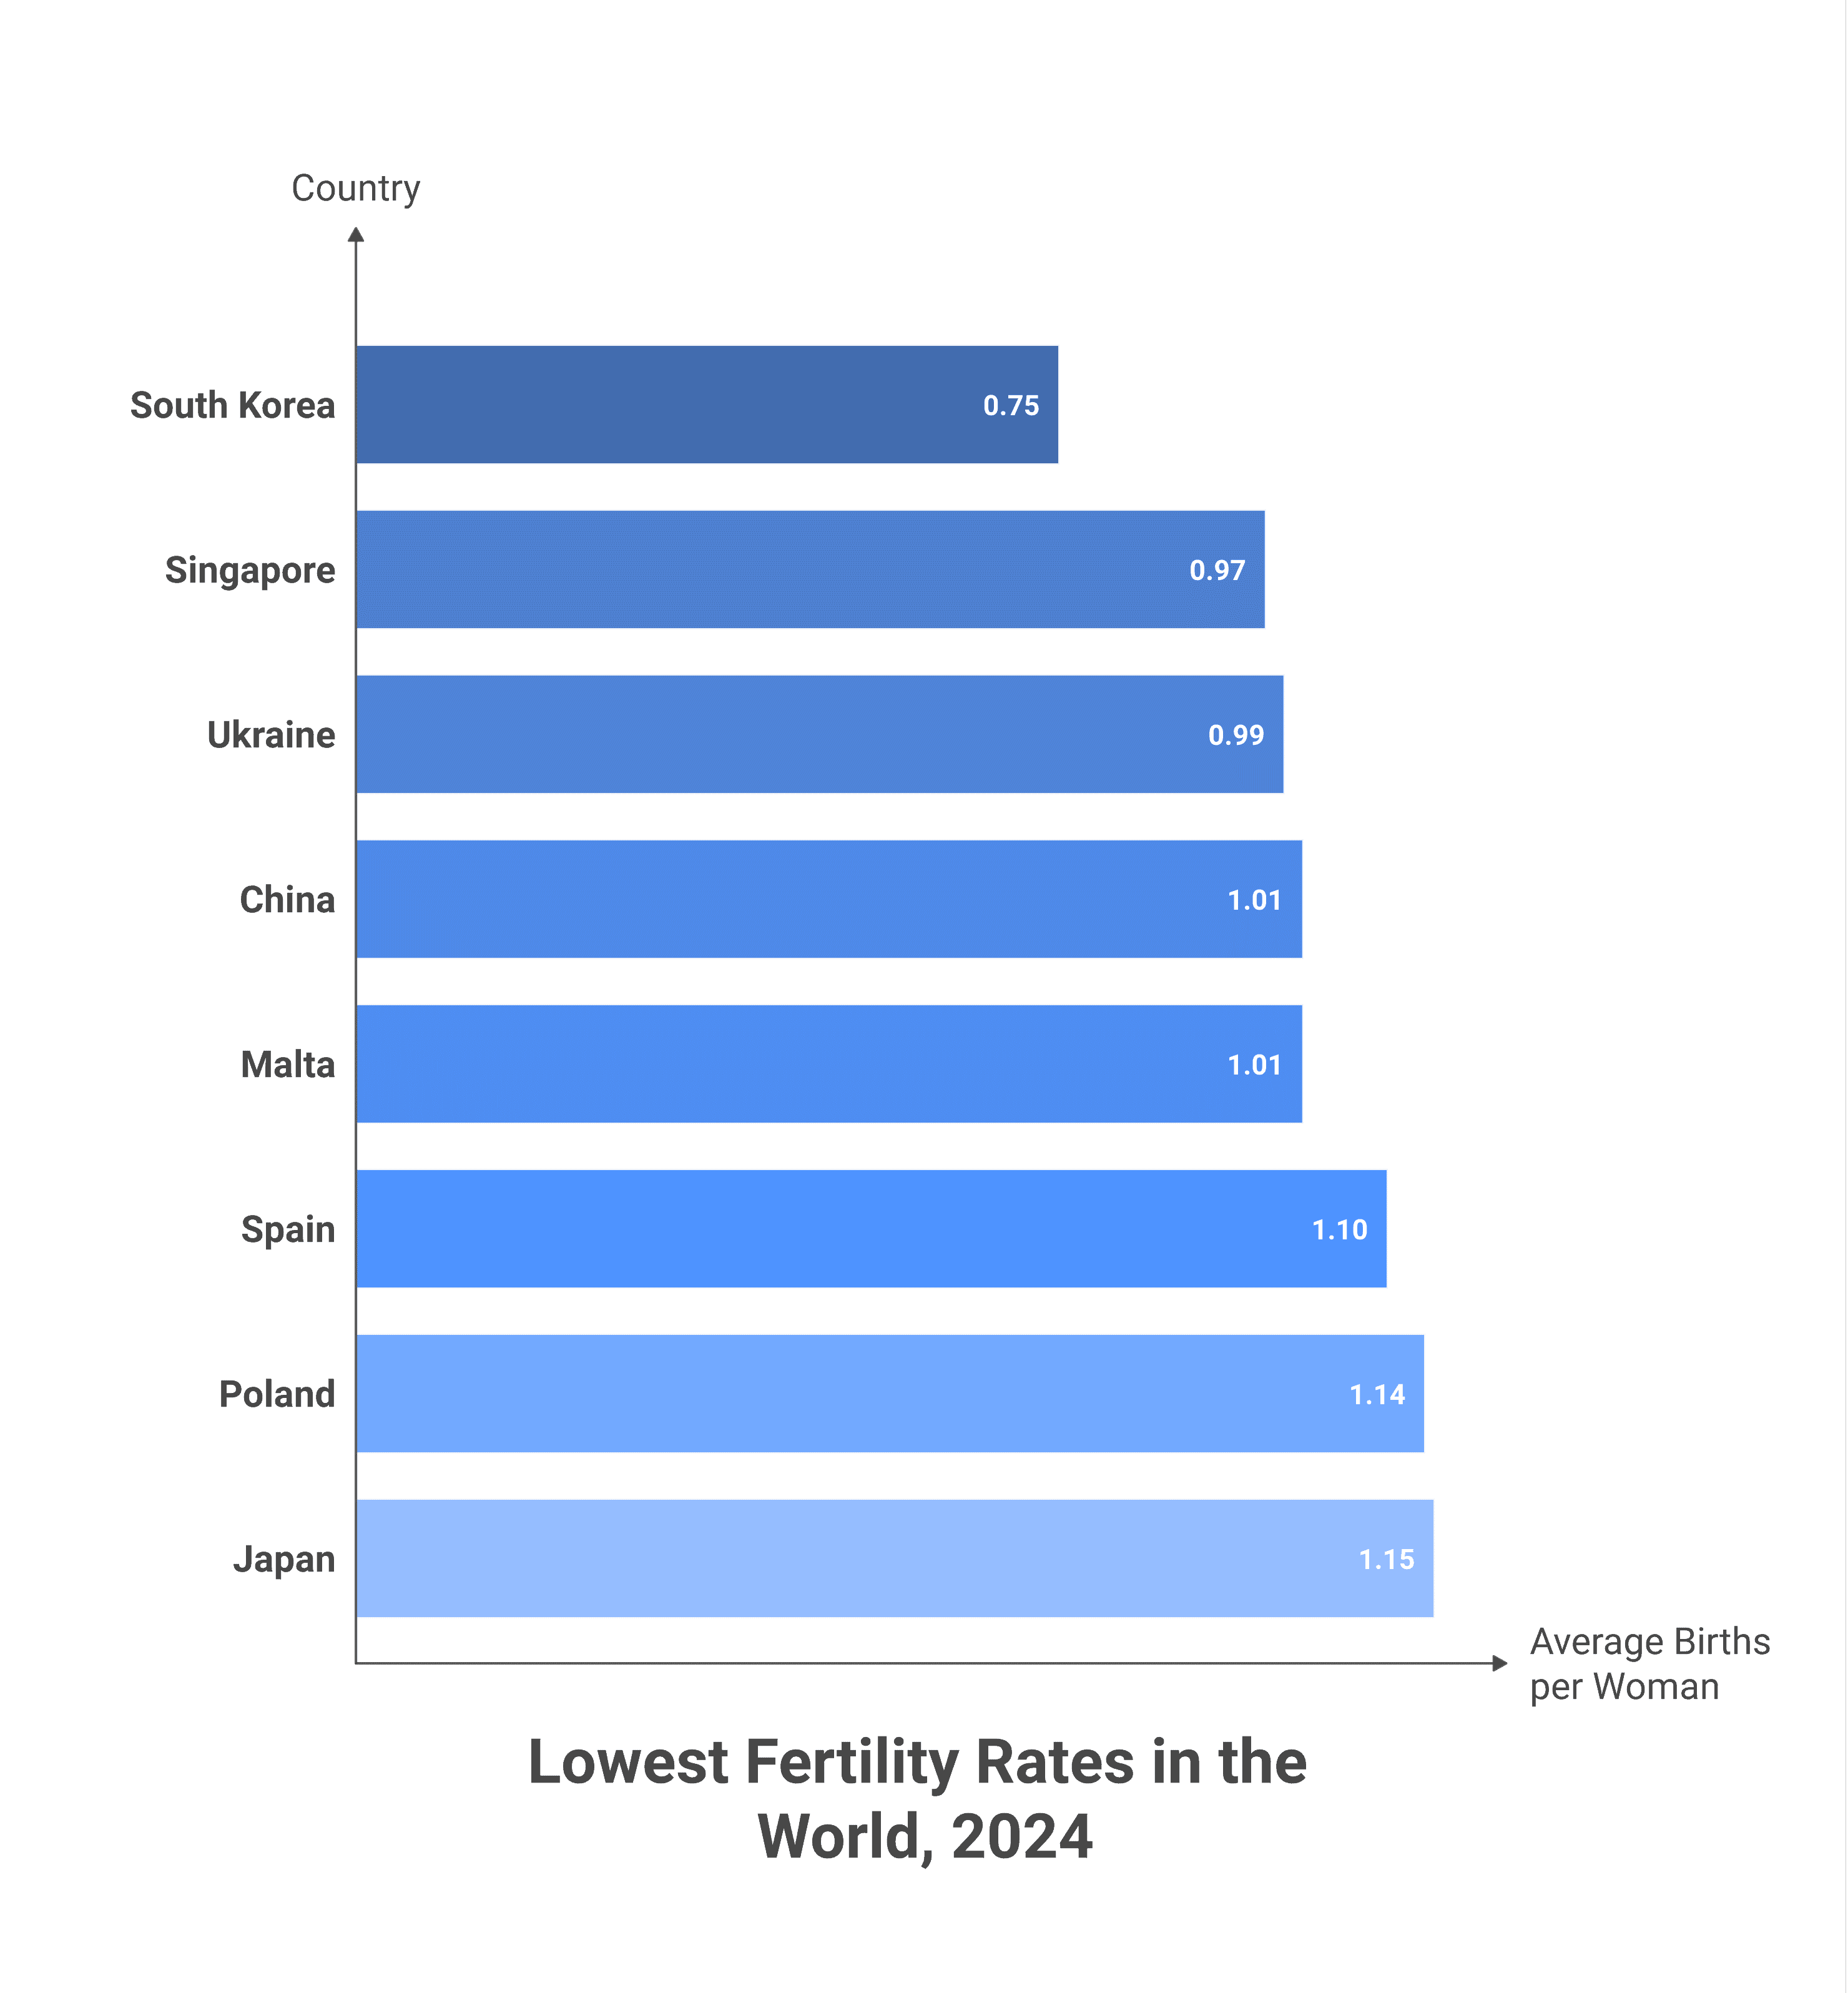
The world’s lowest fertility rates cluster in two regions: the wealthy economies of East Asia and the countries of Southern and Eastern Europe. South Korea has the lowest rate of any sovereign nation on Earth — 0.75, barely a third of replacement. China (1.0), Japan (1.15), Italy (1.18), Poland (1.14) and Spain (1.10) are not far behind. Even the relative “high performers” of the rich world — France (1.61), the United States (1.63) and the United Kingdom (1.55) — are comfortably below replacement. Perhaps the most consequential shift of all: India (1.96), now the world’s most populous country, has also slipped below the line.
| Country | Births per woman (2024) |
|---|---|
| South Korea | 0.75 |
| Singapore | 0.97 |
| Ukraine | 0.99 |
| China | 1.01 |
| Malta | 1.01 |
| Spain | 1.10 |
| Poland | 1.14 |
| Japan | 1.15 |
The highest: Sub-Saharan Africa
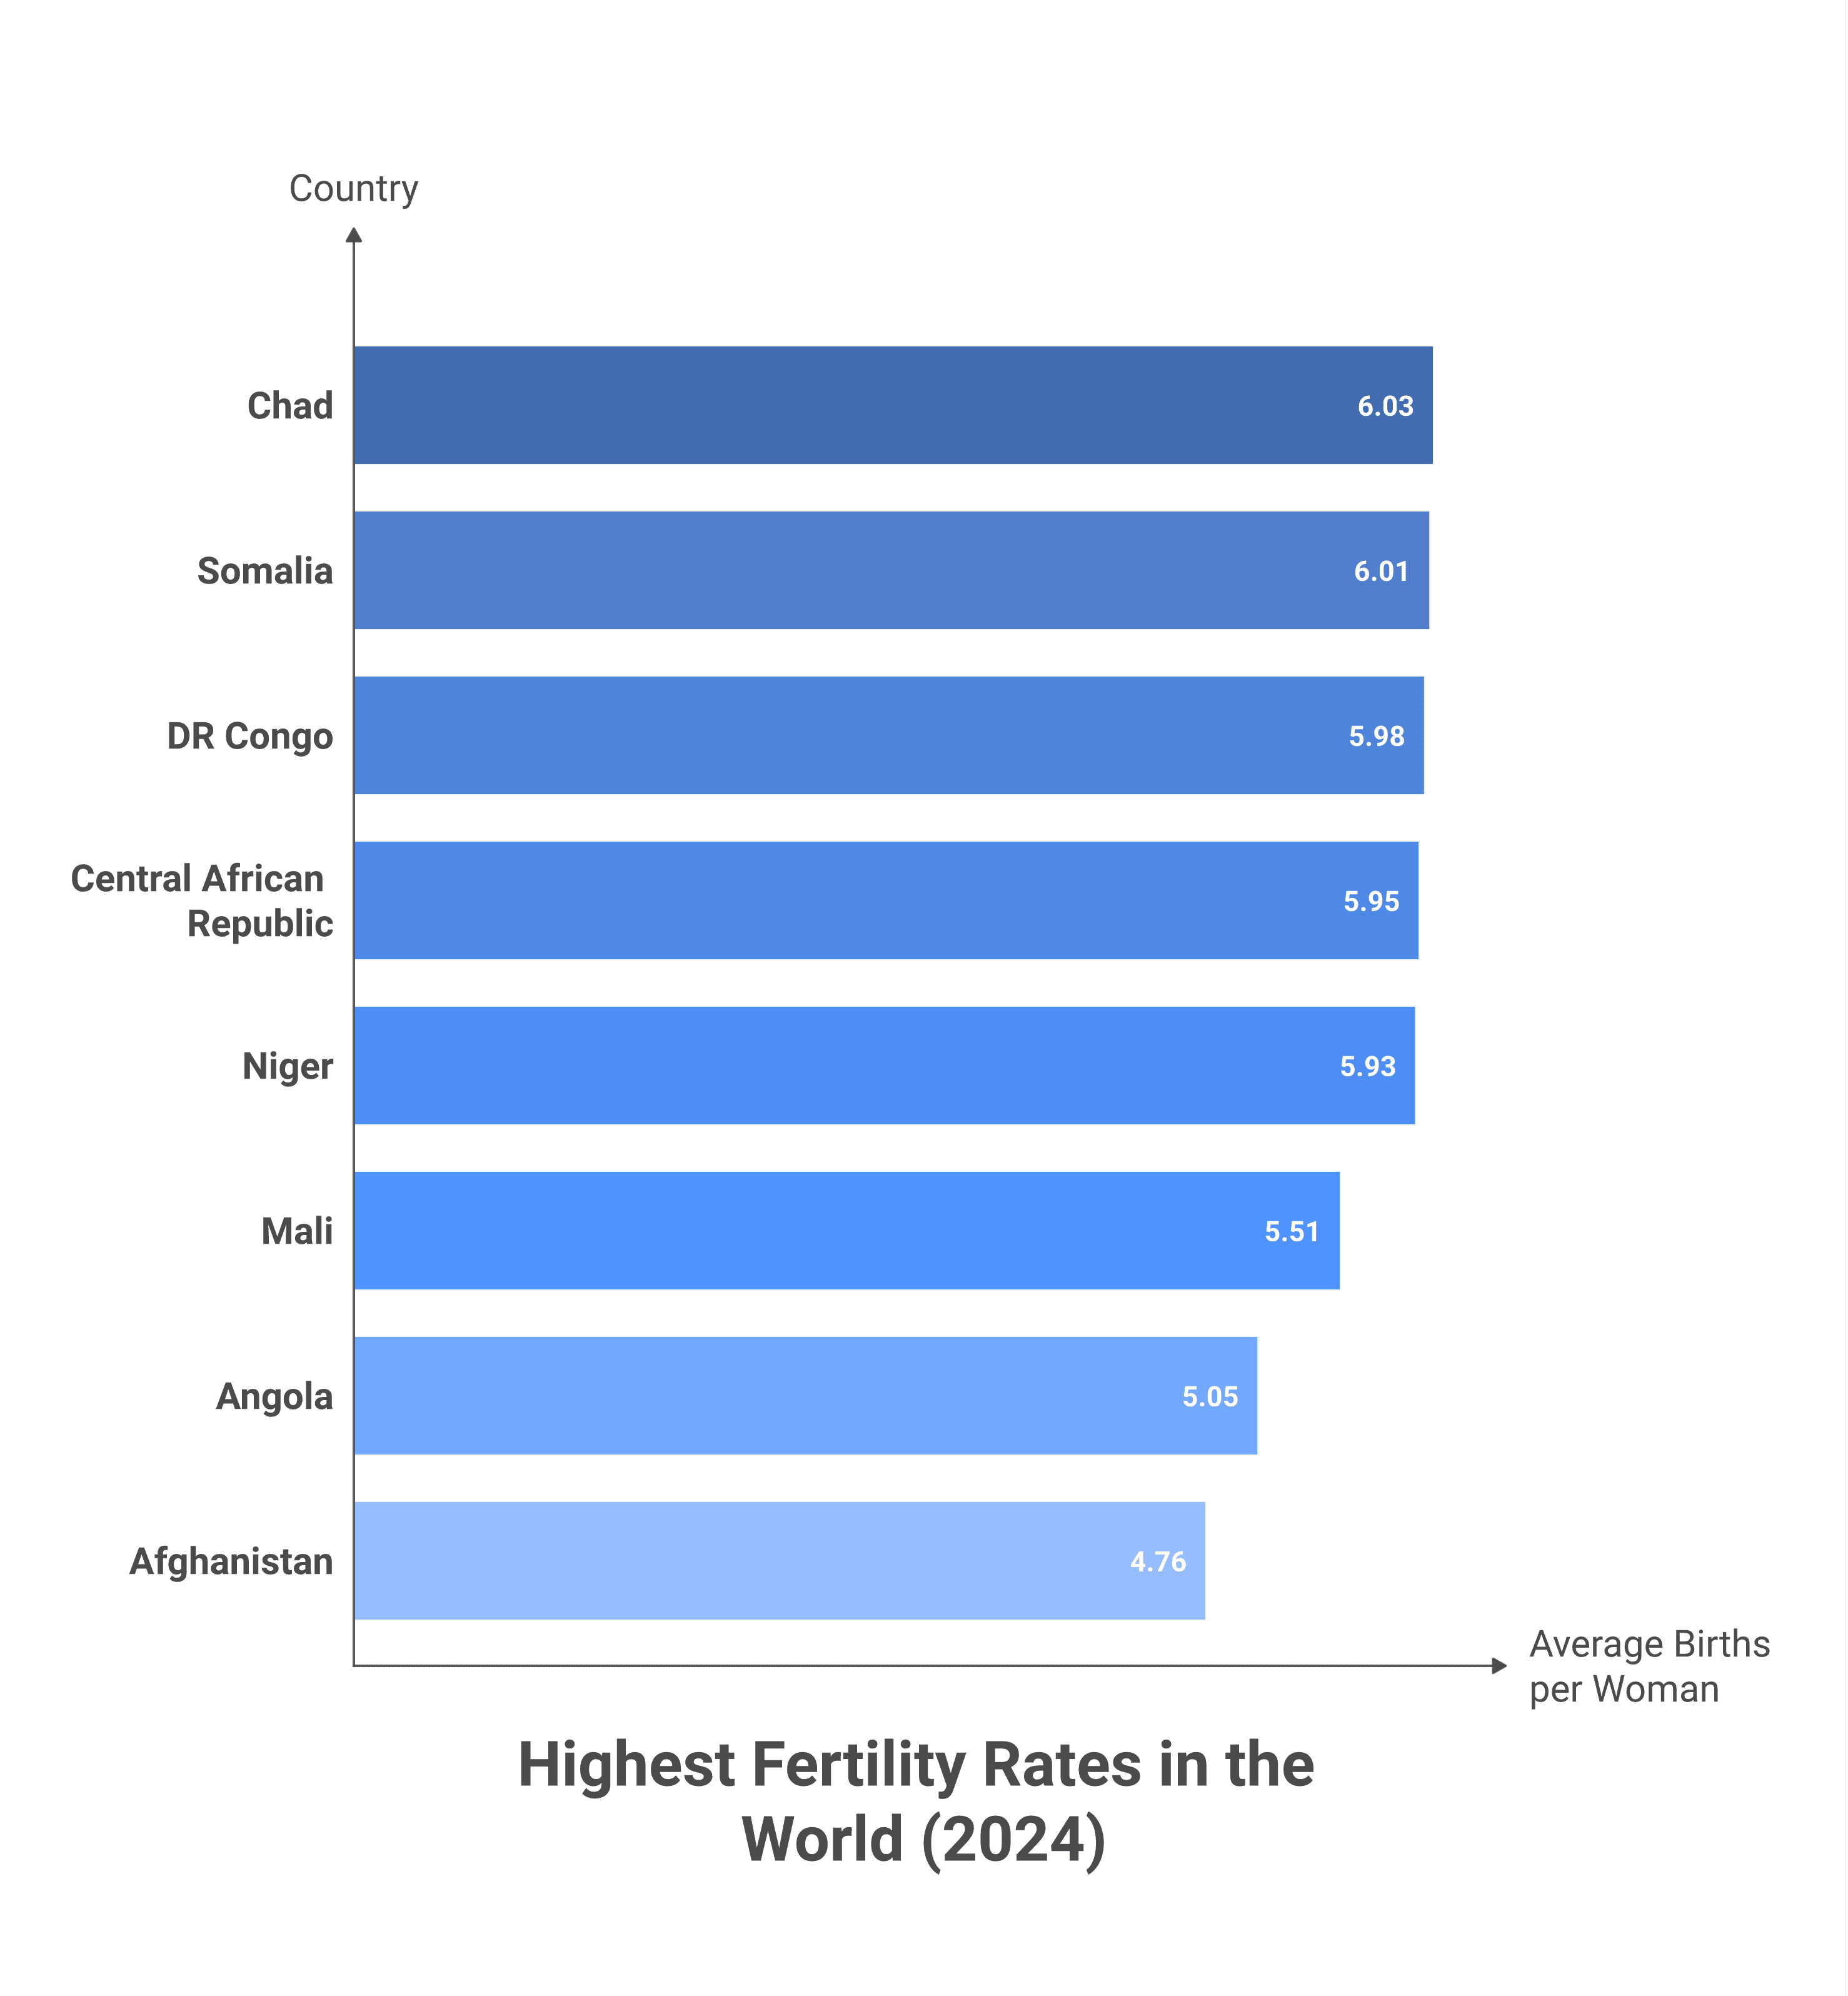
At the other end of the map, fertility remains high across the Sahel and Central Africa. Niger (5.9), Chad (6.0), Somalia (6.0) and the Democratic Republic of the Congo (6.0) top the world. With the sole exception of Afghanistan (4.8), every one of the highest-fertility countries is in Sub-Saharan Africa — which is why the UN now expects almost all of the world’s remaining population growth to come from that single region.
| Country | Births per woman (2024) |
|---|---|
| Chad | 6.03 |
| Somalia | 6.01 |
| DR Congo | 5.98 |
| Central African Rep. | 5.95 |
| Niger | 5.93 |
| Mali | 5.51 |
| Angola | 5.05 |
| Afghanistan | 4.76 |
Why the Population Still Grows — and When It Peaks
If most of the world is below replacement, why are there more people every year? Demographic momentum again. The UN’s 2024 World Population Prospects projects that the global population will keep growing for another six decades — from 8.2 billion in 2024 to a peak of about 10.3 billion in the mid-2080s (around 2084) — before beginning a long, slow decline to roughly 10.2 billion by 2100. It would be the first sustained fall in the human population since the Black Death.
| Year | World population |
|---|---|
| 1950 | 2.5 billion |
| 2000 | 6.1 billion |
| 2024 | 8.2 billion |
| 2050 | ~9.7 billion |
| ~2084 (peak) | ~10.3 billion |
| 2100 | ~10.2 billion |
Some demographers think the peak will come even sooner and lower. A widely cited 2024 study in The Lancet from the Institute for Health Metrics and Evaluation projected that by 2100, 97% of countries — 198 of 204 — will have fertility below replacement. Only six, almost all in Sub-Saharan Africa, are expected to stay above it: Samoa, Somalia, Tonga, Niger, Chad and Tajikistan.
How Worried Should We Be? Expert Voices
Demographers broadly agree on the trajectory; they disagree sharply on what it means. For some, falling fertility is a manageable adjustment. For others, it is the defining challenge of the century — a slow-motion reordering of the economy, the welfare state, and the balance of generations.
The world will be simultaneously tackling a ‘baby boom’ in some countries and a ‘baby bust’ in others. We are facing staggering social change through the 21st century.
— Stein Emil Vollset, lead author, IHME/Lancet Global Burden of Disease fertility study (2024)
The economists Dean Spears and Michael Geruso, whose 2025 book After the Spike made the case for taking depopulation seriously, are blunt about how little anyone actually knows how to reverse it:
No one yet knows how to avoid depopulation — not researchers, not policy experts, not politicians. The issue is still too new.
— Dean Spears, economist, co-author of After the Spike (2025)
Note the careful language. The popular framing of “population collapse” implies something sudden and catastrophic. What the data actually shows is a gradual decline unfolding over generations — slow enough that societies have time to adapt, but persistent enough that, so far, no policy has reversed it.
What Could We Do About It?
Governments worried about shrinking and ageing populations have a familiar menu of options. The evidence on each is sobering.
Support families. The OECD’s 2024 review concluded that the most durable lever is greater gender equality and a fairer sharing of childcare, backed by paid parental leave, affordable childcare, child allowances and — crucially — tackling the cost of raising children, especially housing. But it added a caveat that haunts every pro-natal budget: because of deep changes in what people want from their lives, “it is unlikely that such policies will enable countries to approach replacement fertility rates again.”
Open the doors. Immigration can offset a low birth rate and keep a workforce young — and it is the main reason the United States and Canada are ageing more slowly than Japan or Italy. But it is a fix only for individual countries: in a world where most nations are below replacement, not everyone can import their way out.
Adapt to ageing. Longer working lives, higher productivity, pension reform and bringing more women and older workers into the labour force can cushion the economic blow of a top-heavy age structure — even if they do nothing to raise the birth rate itself.
The uncomfortable through-line is that coercion and cash have both largely failed. As Spears and Geruso put it, “attempting to force fertility has influenced birth rates, especially over the short term, but has never actually had enough power and leverage to shove the world on or off the path of depopulation.” The honest expert consensus, for now, is humility.
A Turning Point on the Map
The fertility map of 2024 is a snapshot of a hinge moment in human history. For the first time, humanity is heading — slowly, unevenly, but unmistakably — toward a future of fewer people rather than more. Whether that turns out to be a crisis to be fought or a transition to be managed is the great demographic question of the century. The one thing the experts agree on is that the trend is real, it is global, and no one has yet found the off-switch.
Data sources and image credits for this map.
Image Sources
- Featured photo (empty baby swing) — Levente Varga via Unsplash – Symbolizing falling birth rates.