Key Takeaways
- Rich countries are borrowing like it's a pandemic, with no pandemic. The IMF's new Fiscal Monitor puts advanced-economy deficits near their largest since COVID: the US at -8.5% of GDP, China at -8.0%, France at -5.4%, with the eurozone aggregate widening to 3.4%.
- The surplus club is almost entirely hydrocarbon-powered. Kuwait (+15.8%), Norway (+13.5%) and Oman (+6.0%) lead; Singapore (+3.7%) is the biggest surplus earned without a drop of exported oil.
- Cheap oil has flipped Saudi Arabia itself into deep deficit. At -6.5% of GDP, the world's most famous petrostate now borrows more heavily (relative to GDP) than France: the Gulf is no longer uniformly green.
- Most of the world now fails the old 3% test. Of 189 economies mapped, the majority run deficits beyond the Maastricht-style 3% line; the IMF's message in Bangkok was blunt: rebuild buffers now, while you still can.
Every October the IMF opens the world’s books. The Fiscal Monitor released October 13 at the Bangkok Annual Meetings carried an unusually blunt warning: advanced economies are running deficits approaching their largest since the pandemic, roughly 5.2% of GDP as a group, with no emergency to show for it. We mapped the underlying country data: general government net lending or borrowing for 2026, across 189 economies.
The Map: Who Borrows, Who Banks
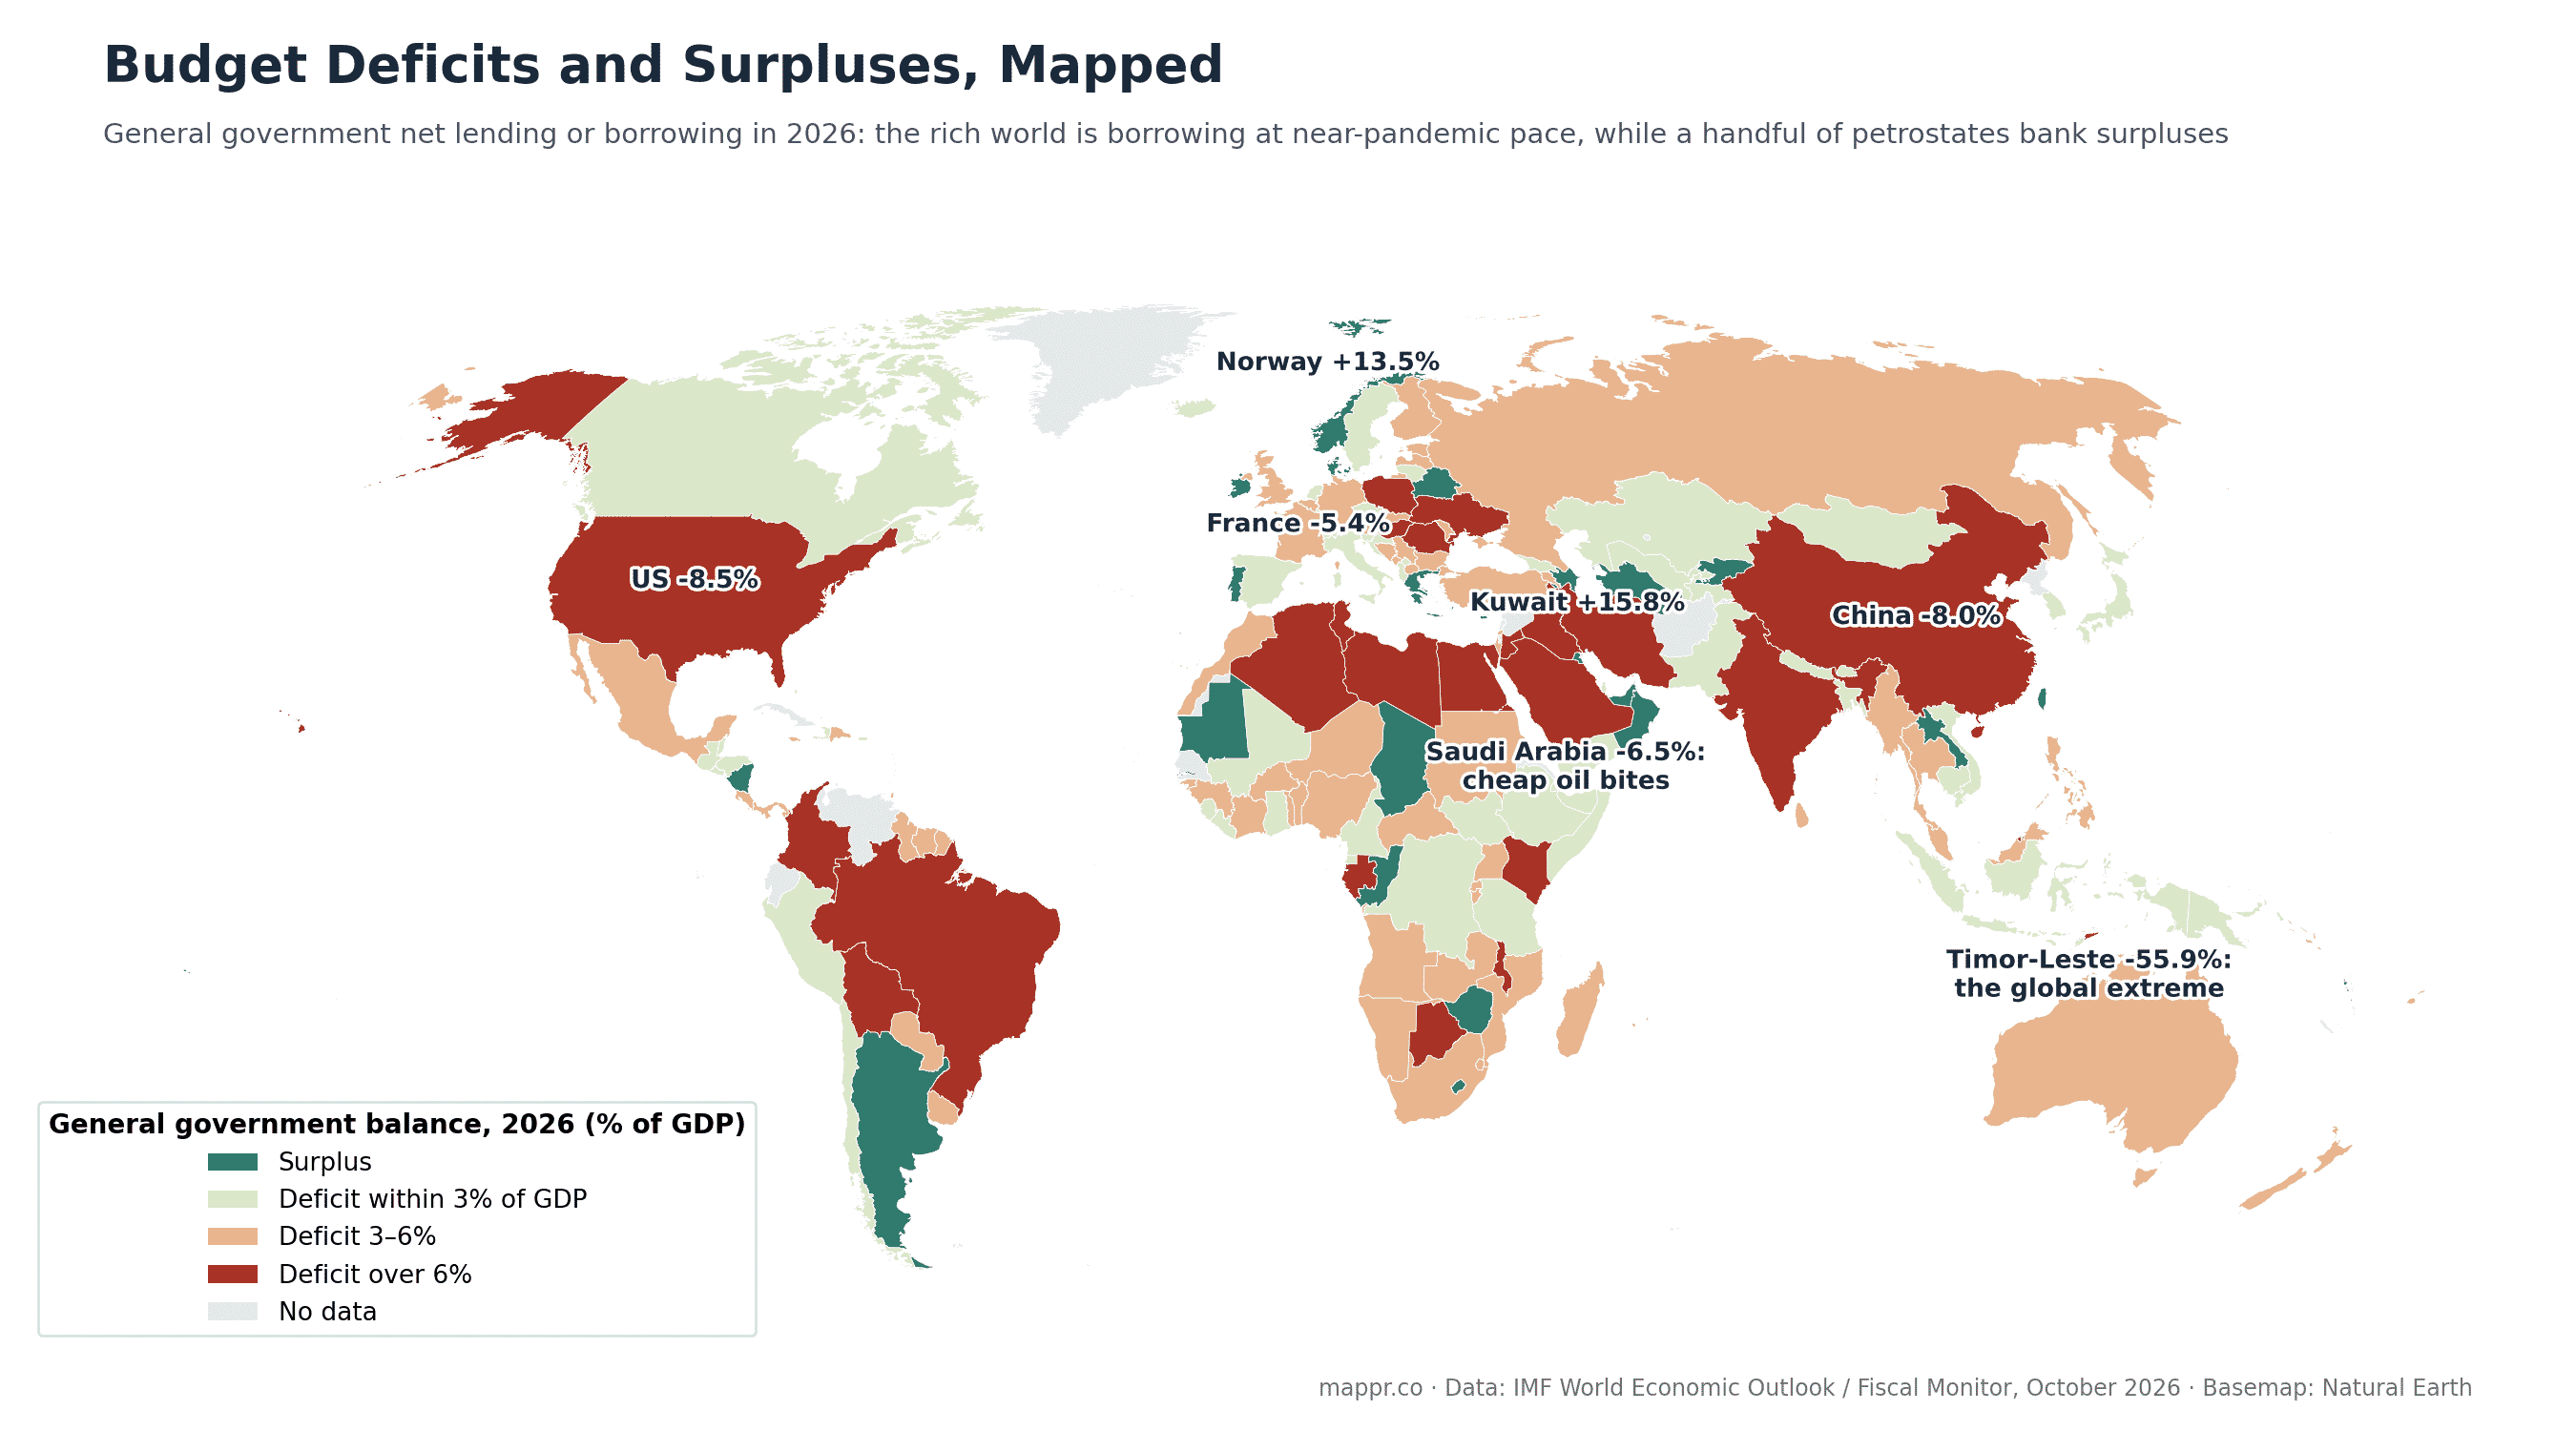
The two tails tell the story. On one side, a thin green club of savers: Kuwait (+15.8%), Norway (+13.5%), Macao, Oman, plus curiosities like Nauru’s fishing-licence surplus and Argentina’s hard-won swing to balance. On the other, the world’s two largest economies dig in deep: the United States at -8.5% and China at -8.0%, each borrowing like a crisis economy at full employment. Europe’s old 3%-of-GDP discipline line, visible as the pale-green band, now reads like nostalgia: France (-5.4%), Germany (-4.3%) and the UK (-3.8%) all sit beyond it.
The Gulf Is No Longer Uniformly Green
The sharpest change from the oil-boom years: Saudi Arabia runs a -6.5% deficit, deeper than France’s, as cheap crude collides with giga-project spending. Bahrain (-11.4%) is deeper still, while Kuwait and Oman stay comfortably in surplus. The region’s fiscal map now depends less on owning oil than on the break-even price each budget was built on.
The Ranking: Deepest Deficits vs Biggest Surpluses
Ranked
The two tails of 2026: deepest deficits, biggest surpluses
General government net lending (+) or borrowing (-), % of GDP, IMF October 2026 projections. US and China added for scale: they are the only major economies near the deep-deficit tail.
| Country | Balance | Note |
|---|---|---|
| 🇹🇱 Timor-Leste | -55.9% | Petroleum-fund drawdown, not collapse |
| 🇱🇾 Libya | -22.5% | |
| 🇰🇮 Kiribati | -16.7% | |
| 🇮🇶 Iraq | -15.1% | |
| 🇧🇳 Brunei | -12.7% | |
| 🇲🇻 Maldives | -11.9% | |
| 🇧🇭 Bahrain | -11.4% | |
| 🇪🇬 Egypt | -11.4% | Heaviest big-economy deficit in Africa |
| 🇺🇦 Ukraine | -11.3% | War financing |
| 🇬🇩 Grenada | -11.1% | |
| 🇺🇸 United States | -8.5% | Deepest G7 deficit |
| 🇨🇳 China | -8.0% | The other giant borrowing at crisis pace |
| 🇰🇼 Kuwait | +15.8% | World's biggest surplus |
| 🇳🇷 Nauru | +14.5% | Fishing-licence windfall |
| 🇳🇴 Norway | +13.5% | Oil-fund powerhouse |
| 🇲🇴 Macao | +8.4% | |
| 🇴🇲 Oman | +6.0% | |
| 🇨🇬 Republic of the Congo | +5.2% | |
| 🇹🇴 Tonga | +4.1% | |
| 🇼🇸 Samoa | +4.0% | |
| 🇦🇿 Azerbaijan | +3.7% | |
| 🇸🇬 Singapore | +3.7% | Biggest non-commodity surplus |
Why the IMF Is Worried Now
Deficits of this size were designed for emergencies: the pandemic, the financial crisis. Running them in a normal year leaves no buffer for the next shock, and it compounds: every year of -8% borrowing feeds the debt stock we mapped in the spring, which already has the US headed past 140% of GDP by 2031. The Fiscal Monitor’s Bangkok message was that the adjustment gets harder every year it is deferred, and with interest rates no longer at zero, the carrying cost of procrastination is real money.
The Full Table: All 189 Economies
Every country’s 2026 fiscal balance, searchable and sortable.
| Country | Balance 2026 (% of GDP) | Status |
|---|---|---|
| Timor-Leste | -55.9 | Deep deficit (6%+) |
| Libya | -22.5 | Deep deficit (6%+) |
| Kiribati | -16.7 | Deep deficit (6%+) |
| Iraq | -15.1 | Deep deficit (6%+) |
| Brunei | -12.7 | Deep deficit (6%+) |
| Maldives | -11.9 | Deep deficit (6%+) |
| Bahrain | -11.4 | Deep deficit (6%+) |
| Egypt | -11.4 | Deep deficit (6%+) |
| Ukraine | -11.3 | Deep deficit (6%+) |
| Grenada | -11.1 | Deep deficit (6%+) |
| Gabon | -10.4 | Deep deficit (6%+) |
| Bolivia | -9.2 | Deep deficit (6%+) |
| Saint Vincent and the Grenadines | -9.2 | Deep deficit (6%+) |
| Algeria | -9.1 | Deep deficit (6%+) |
| Saint Kitts and Nevis | -9.0 | Deep deficit (6%+) |
| Malawi | -8.6 | Deep deficit (6%+) |
| Tunisia | -8.6 | Deep deficit (6%+) |
| United States | -8.5 | Deep deficit (6%+) |
| Brazil | -8.1 | Deep deficit (6%+) |
| China | -8.0 | Deep deficit (6%+) |
| India | -7.5 | Deep deficit (6%+) |
| Hungary | -7.3 | Deep deficit (6%+) |
| Poland | -7.2 | Deep deficit (6%+) |
| Iran | -7.1 | Deep deficit (6%+) |
| Botswana | -6.9 | Deep deficit (6%+) |
| Colombia | -6.9 | Deep deficit (6%+) |
| Kenya | -6.6 | Deep deficit (6%+) |
| Saudi Arabia | -6.5 | Deep deficit (6%+) |
| Romania | -6.2 | Deep deficit (6%+) |
| Jordan | -6.1 | Deep deficit (6%+) |
| Marshall Islands | -6.1 | Deep deficit (6%+) |
| Eswatini | -6.0 | 3–6% deficit |
| Guyana | -5.9 | 3–6% deficit |
| Israel | -5.8 | 3–6% deficit |
| Namibia | -5.8 | 3–6% deficit |
| Uganda | -5.8 | 3–6% deficit |
| Fiji | -5.5 | 3–6% deficit |
| Bulgaria | -5.4 | 3–6% deficit |
| France | -5.4 | 3–6% deficit |
| Zambia | -5.4 | 3–6% deficit |
| Belgium | -5.3 | 3–6% deficit |
| Moldova | -5.0 | 3–6% deficit |
| Myanmar | -5.0 | 3–6% deficit |
| North Macedonia | -5.0 | 3–6% deficit |
| Suriname | -5.0 | 3–6% deficit |
| Jamaica | -4.9 | 3–6% deficit |
| Angola | -4.7 | 3–6% deficit |
| Slovakia | -4.6 | 3–6% deficit |
| Madagascar | -4.5 | 3–6% deficit |
| Hong Kong | -4.4 | 3–6% deficit |
| South Africa | -4.4 | 3–6% deficit |
| Estonia | -4.3 | 3–6% deficit |
| Germany | -4.3 | 3–6% deficit |
| Austria | -4.2 | 3–6% deficit |
| Bosnia and Herzegovina | -4.2 | 3–6% deficit |
| Finland | -4.2 | 3–6% deficit |
| Mexico | -4.2 | 3–6% deficit |
| Philippines | -4.2 | 3–6% deficit |
| Sri Lanka | -4.2 | 3–6% deficit |
| Trinidad and Tobago | -4.2 | 3–6% deficit |
| Mauritius | -4.1 | 3–6% deficit |
| New Zealand | -4.1 | 3–6% deficit |
| Uruguay | -4.1 | 3–6% deficit |
| Armenia | -4.0 | 3–6% deficit |
| Guinea-Bissau | -4.0 | 3–6% deficit |
| Sudan | -3.9 | 3–6% deficit |
| Morocco | -3.9 | 3–6% deficit |
| Solomon Islands | -3.9 | 3–6% deficit |
| Burkina Faso | -3.8 | 3–6% deficit |
| Côte d'Ivoire | -3.8 | 3–6% deficit |
| United Kingdom | -3.8 | 3–6% deficit |
| Costa Rica | -3.7 | 3–6% deficit |
| Guinea | -3.7 | 3–6% deficit |
| Dominican Republic | -3.6 | 3–6% deficit |
| Montenegro | -3.6 | 3–6% deficit |
| Rwanda | -3.6 | 3–6% deficit |
| Burundi | -3.5 | 3–6% deficit |
| Central African Republic | -3.5 | 3–6% deficit |
| Malaysia | -3.5 | 3–6% deficit |
| Tuvalu | -3.5 | 3–6% deficit |
| Niger | -3.4 | 3–6% deficit |
| Panama | -3.4 | 3–6% deficit |
| Serbia | -3.4 | 3–6% deficit |
| Togo | -3.4 | 3–6% deficit |
| Benin | -3.3 | 3–6% deficit |
| Mozambique | -3.3 | 3–6% deficit |
| Nigeria | -3.3 | 3–6% deficit |
| Thailand | -3.3 | 3–6% deficit |
| Australia | -3.2 | 3–6% deficit |
| Latvia | -3.2 | 3–6% deficit |
| Russia | -3.2 | 3–6% deficit |
| Comoros | -3.1 | 3–6% deficit |
| Paraguay | -3.1 | 3–6% deficit |
| Saint Lucia | -3.1 | 3–6% deficit |
| Türkiye | -3.1 | 3–6% deficit |
| Belize | -3.0 | Within 3% |
| Cambodia | -2.9 | Within 3% |
| Croatia | -2.9 | Within 3% |
| Indonesia | -2.9 | Within 3% |
| Italy | -2.9 | Within 3% |
| Sierra Leone | -2.9 | Within 3% |
| Slovenia | -2.9 | Within 3% |
| Bangladesh | -2.8 | Within 3% |
| Mali | -2.8 | Within 3% |
| Qatar | -2.8 | Within 3% |
| DR Congo | -2.7 | Within 3% |
| Czechia | -2.7 | Within 3% |
| Malta | -2.7 | Within 3% |
| Netherlands | -2.7 | Within 3% |
| Guatemala | -2.6 | Within 3% |
| Pakistan | -2.6 | Within 3% |
| Tanzania | -2.6 | Within 3% |
| Canada | -2.5 | Within 3% |
| Mongolia | -2.5 | Within 3% |
| Sweden | -2.5 | Within 3% |
| Tajikistan | -2.5 | Within 3% |
| Kosovo | -2.4 | Within 3% |
| Spain | -2.4 | Within 3% |
| El Salvador | -2.3 | Within 3% |
| Lithuania | -2.3 | Within 3% |
| Cameroon | -2.2 | Within 3% |
| Ghana | -2.2 | Within 3% |
| Albania | -2.0 | Within 3% |
| Cabo Verde | -2.0 | Within 3% |
| Chile | -2.0 | Within 3% |
| Ethiopia | -2.0 | Within 3% |
| Luxembourg | -2.0 | Within 3% |
| Seychelles | -1.9 | Within 3% |
| Georgia | -1.7 | Within 3% |
| Djibouti | -1.6 | Within 3% |
| Nepal | -1.5 | Within 3% |
| Peru | -1.5 | Within 3% |
| Iceland | -1.4 | Within 3% |
| Japan | -1.4 | Within 3% |
| Liberia | -1.4 | Within 3% |
| São Tomé and Príncipe | -1.4 | Within 3% |
| South Korea | -1.3 | Within 3% |
| Uzbekistan | -1.2 | Within 3% |
| Papua New Guinea | -1.1 | Within 3% |
| Antigua and Barbuda | -1.0 | Within 3% |
| Honduras | -1.0 | Within 3% |
| Kazakhstan | -1.0 | Within 3% |
| Somalia | -0.9 | Within 3% |
| Vietnam | -0.8 | Within 3% |
| Barbados | -0.7 | Within 3% |
| Dominica | -0.6 | Within 3% |
| Equatorial Guinea | -0.6 | Within 3% |
| Haiti | -0.6 | Within 3% |
| Bhutan | -0.4 | Within 3% |
| Puerto Rico | -0.4 | Within 3% |
| Yemen | -0.4 | Within 3% |
| South Sudan | -0.3 | Within 3% |
| Switzerland | -0.2 | Within 3% |
| Bahamas | -0.2 | Within 3% |
| San Marino | -0.1 | Within 3% |
| Chad | +0.0 | Surplus |
| Mauritania | +0.0 | Surplus |
| Portugal | +0.0 | Surplus |
| Gambia | +0.0 | Surplus |
| Micronesia | +0.1 | Surplus |
| Palau | +0.1 | Surplus |
| Vanuatu | +0.2 | Surplus |
| Greece | +0.3 | Surplus |
| Taiwan, Province of China | +0.3 | Surplus |
| Argentina | +0.4 | Surplus |
| Belarus | +0.4 | Surplus |
| Turkmenistan | +0.5 | Surplus |
| Denmark | +1.2 | Surplus |
| Laos | +1.3 | Surplus |
| Ireland | +1.4 | Surplus |
| Lesotho | +1.4 | Surplus |
| United Arab Emirates | +1.5 | Surplus |
| Zimbabwe | +2.0 | Surplus |
| Andorra | +2.2 | Surplus |
| Aruba | +2.3 | Surplus |
| Cyprus | +2.3 | Surplus |
| Kyrgyzstan | +2.3 | Surplus |
| Nicaragua | +2.3 | Surplus |
| Liechtenstein | +3.0 | Surplus |
| Azerbaijan | +3.7 | Surplus |
| Singapore | +3.7 | Surplus |
| Samoa | +4.0 | Surplus |
| Tonga | +4.1 | Surplus |
| Congo | +5.2 | Surplus |
| Oman | +6.0 | Surplus |
| Macao | +8.4 | Surplus |
| Norway | +13.5 | Surplus |
| Nauru | +14.5 | Surplus |
| Kuwait | +15.8 | Surplus |
Data and reporting for this article come from the following sources: