How Much is Gasoline in Europe Today?
Compare gasoline prices across the European Union with this table, sorted by price and converted to US dollars per gallon for easy comparison with American fuel costs.
📅 Last updated: May 07, 2026 · Data from: May 04, 2026 · Source: European Commission Oil Bulletin. Updated every Thursday.
| Country | Price (€/L) | Price ($/gal) |
|---|---|---|
| Netherlands | €2.39 | $10.59 |
| Denmark | €2.37 | $10.50 |
| Finland | €2.16 | $9.57 |
| Greece | €2.08 | $9.21 |
| Germany | €2.06 | $9.12 |
| France | €2.05 | $9.08 |
| Portugal | €1.99 | $8.81 |
| Belgium | €1.87 | $8.28 |
| Ireland | €1.80 | $7.97 |
| Luxembourg | €1.80 | $7.97 |
| Austria | €1.79 | $7.93 |
| Italy | €1.79 | $7.93 |
| Latvia | €1.78 | $7.88 |
| Lithuania | €1.78 | $7.88 |
| Slovakia | €1.78 | $7.88 |
| Estonia | €1.77 | $7.84 |
| Romania | €1.74 | $7.71 |
| Sweden | €1.74 | $7.71 |
| Czechia | €1.73 | $7.66 |
| Croatia | €1.70 | $7.53 |
| Hungary | €1.65 | $7.31 |
| Slovenia | €1.62 | $7.17 |
| Cyprus | €1.54 | $6.82 |
| Spain | €1.53 | $6.78 |
| Poland | €1.51 | $6.69 |
| Bulgaria | €1.48 | $6.55 |
| Malta | €1.34 | $5.93 |
Euro-Super 95 (Gasoline/Fuel) prices in the 27 EU Countries. Source: European Commission.
Fuel Prices in Europe Maps
Static Map: Gasoline Prices in the EU

Europe’s pump prices fan out in a familiar pattern: a wealthy, heavily-taxed northern crescent at the top of the table, an indebted Mediterranean middle, and a budget-priced eastern flank — with the small island of Malta, which subsidises fuel as a matter of policy, stranded €1.05 below the Netherlands. The continent’s simple average of €1.81 a litre (€6.85 a gallon) sits roughly twice America’s typical pump price, a gap that reflects excise duties more than crude. Iran’s blockade of the Strait of Hormuz, now in its third month, has tightened the screws on a refining base already running thin.
- The northern bloc: The Netherlands (€2.39), Denmark (€2.37) and Finland (€2.16) anchor the expensive end, where excise and VAT can account for more than half the sticker price.
- The eastern discount: Bulgaria (€1.48) and Poland (€1.51) keep prices low through both lighter taxation and proximity to surviving Russian-grade supply chains.
- The Malta outlier: At €1.34, Malta’s state-run subsidy keeps motorists insulated from the Hormuz shock — for now.
Interactive Map: Gasoline Prices in the EU
Click on any EU country on the map below to view gasoline prices per liter (EUR) and per gallon (USD):
For an American driver accustomed to pumping unleaded at around $3.50 a gallon, Europe is a sobering experience. The EU average of €1.81 per litre translates to €6.85 — roughly $7.40 — per US gallon, more than double the American norm. The dispersion within the bloc, however, is wider than the gap between countries: the Dutch motorist pays €4 more per gallon than the Maltese one. Below, the 27 member states are sorted into five tiers by gallon-equivalent price.
Above €7.50 per gallon — the high-tax north and stretched south
- Netherlands — €2.39/L (€9.05/gal)
- Denmark — €2.37/L (€8.97/gal)
- Finland — €2.16/L (€8.18/gal)
- Greece — €2.08/L (€7.87/gal)
- Germany — €2.06/L (€7.80/gal)
- France — €2.05/L (€7.76/gal)
- Portugal — €1.99/L (€7.53/gal)
€7.00–7.49 per gallon
- Belgium — €1.87/L (€7.08/gal)
€6.50–6.99 per gallon — the broad middle
- Ireland — €1.80/L (€6.81/gal)
- Luxembourg — €1.80/L (€6.81/gal)
- Austria — €1.79/L (€6.78/gal)
- Italy — €1.79/L (€6.78/gal)
- Latvia — €1.78/L (€6.74/gal)
- Lithuania — €1.78/L (€6.74/gal)
- Slovakia — €1.78/L (€6.74/gal)
- Estonia — €1.77/L (€6.70/gal)
- Romania — €1.74/L (€6.59/gal)
- Sweden — €1.74/L (€6.59/gal)
- Czechia — €1.73/L (€6.55/gal)
€6.00–6.49 per gallon
- Croatia — €1.70/L (€6.43/gal)
- Hungary — €1.65/L (€6.24/gal)
- Slovenia — €1.62/L (€6.13/gal)
Below €6.00 per gallon — the eastern and Mediterranean discount
- Cyprus — €1.54/L (€5.83/gal)
- Spain — €1.53/L (€5.79/gal)
- Poland — €1.51/L (€5.72/gal)
- Bulgaria — €1.48/L (€5.60/gal)
- Malta — €1.34/L (€5.07/gal)
From cheapest to dearest, the spread runs €1.05 per litre — €3.98 per gallon. An American filling a 15-gallon tank in Sofia would pay about $91; the same tank in Amsterdam would run close to $147. Excise rates and VAT account for the bulk of that gap; crude itself, after all, costs the same in Sofia and Amsterdam.
EU-Average Gasoline Price Trends

The past twelve months have been unkind to European motorists. Pump prices are up 15.05% year-on-year and 14.25% over the past twelve weeks, a jump driven less by fundamentals than by the geopolitical premium attached to every barrel since Iran shut the Strait of Hormuz in late February. Roughly a fifth of global seaborne oil and LNG normally moves through that channel; with it choked, refiners across the bloc — already operating with thinner spare capacity than in 2022 — have scrambled for non-Gulf cargoes at a markup. Attacks on Qatari LNG infrastructure have squeezed gas-to-power substitution, indirectly tightening the diesel and gasoline crack as well. The mild four-week dip of 0.99% reflects the OPEC+ announcement that seven members, including Saudi Arabia and Russia, will lift output by 188,000 barrels per day from June; markets read this as a partial offset, not a reversal. Last week’s 1.03% uptick suggests that view is already wavering. Brussels, meanwhile, has reopened debate over windfall taxes and the place of refining inside the Carbon Border Adjustment Mechanism — neither of which will lower the number on the pump in the short run.
- Range: €1.590/L (22 December 2025) to €1.893/L (23 March 2026) — a 19% peak-to-trough swing inside five months.
- Momentum: +15.05% year-on-year and +14.25% over twelve weeks; the four-week reading of −0.99% is the only soft patch.
- Volatility: Elevated. Weekly moves have averaged above 1% since the Hormuz blockade, against a long-run norm closer to 0.3%.
Source: European Commission Weekly Oil Bulletin.
Historical Maps: 2017 and 2021
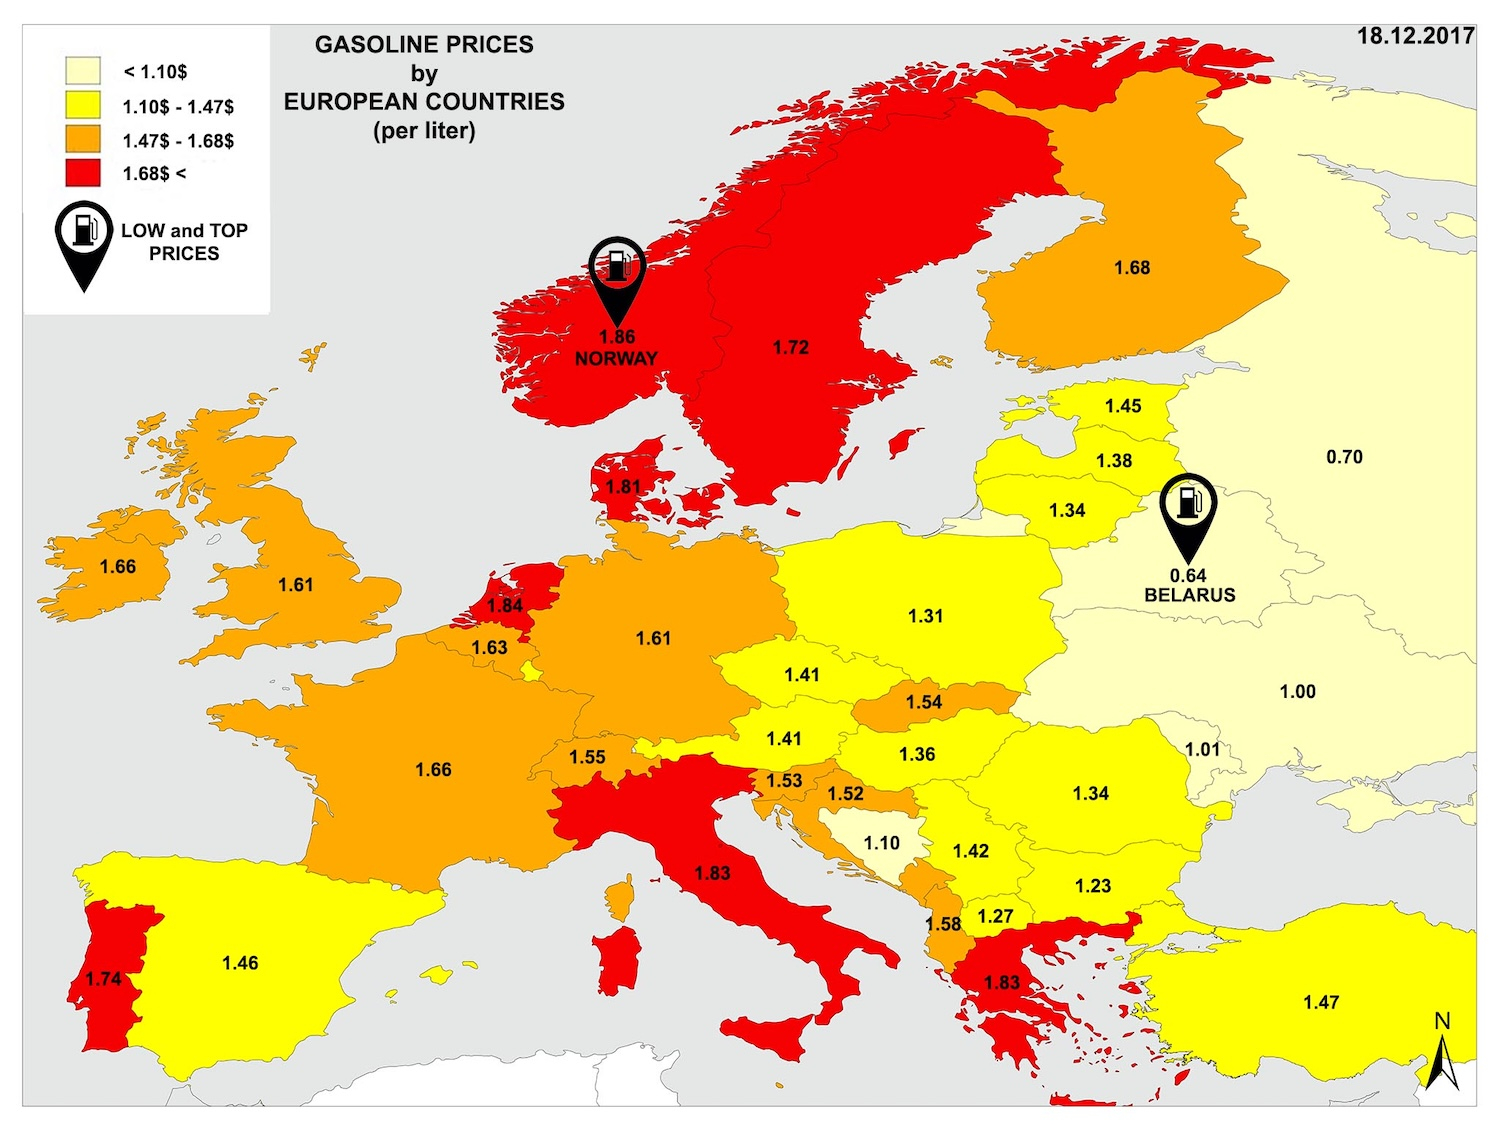
In December 2017, the average gasoline price in Europe was $1.42 per liter. Western European countries like Norway ($1.86) and Italy ($1.84) had the highest prices, while Eastern European nations such as Belarus ($0.64) and Russia ($0.70) experienced significantly lower costs.
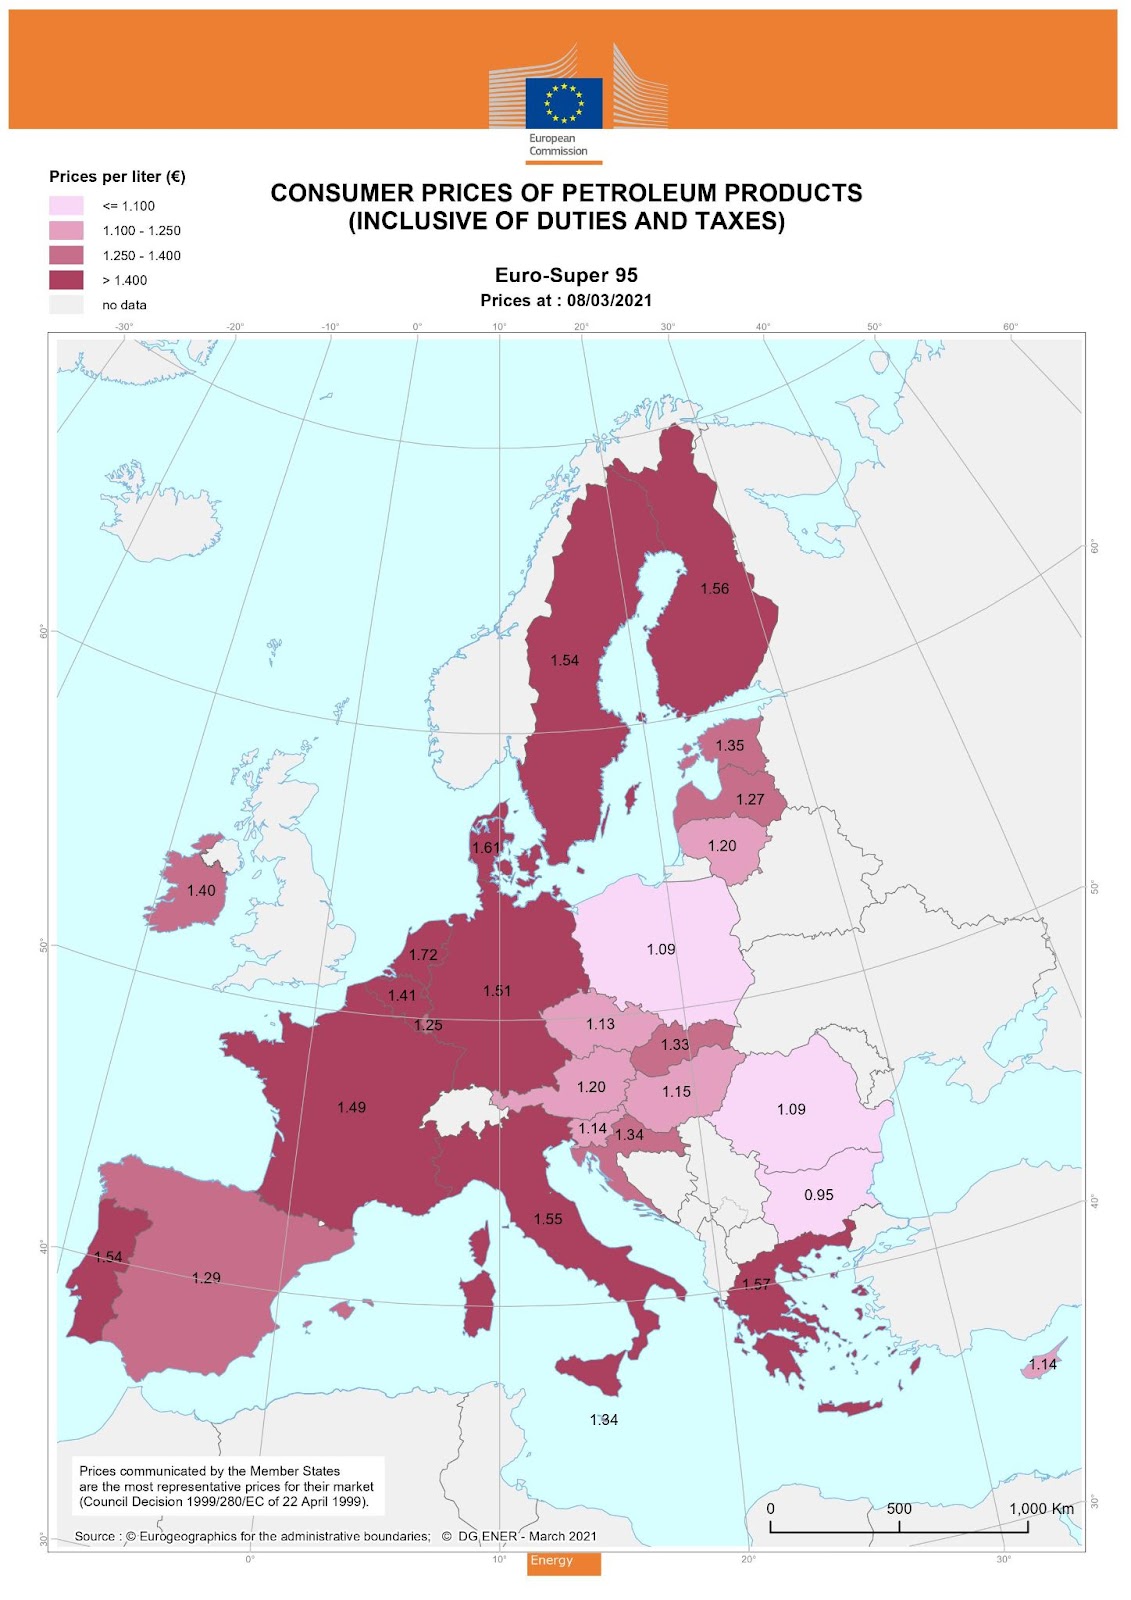
By March 2021, the average price had risen to €1.36 per liter. Western Europe continued to see higher prices, with the Netherlands (€1.72) and Greece (€1.57) among the most expensive, while Eastern Europe maintained lower prices, with Bulgaria (€0.95) and Poland (€1.09) at the lower end.
The data reflects a steady increase in fuel prices across Europe over these four years, particularly in Western Europe.