Key Takeaways
- The Americas and Europe host 74%. OECD-UNSD's 4th MEIP release (March 2026) finds that 74% of the world's 500 largest MNEs by combined revenue are headquartered in the Americas or Europe — almost half in the United States alone.
- Asia accounts for the other 24%. Asia hosts 24% of the top 500 MNEs, anchored by China and Japan. The remaining ~2% sit in the Gulf, Brazil and Australia. Africa is essentially absent at the top of the list.
- 5 cities house ~25% of all MNE HQs. Per Fortune Global 500 2024 — the closest publicly verifiable proxy ranking — Beijing, Tokyo, New York, Shanghai and Seoul together host nearly a quarter of the world's largest companies. London and Paris are just behind.
- Tech + healthcare = 80% of R&D. The OECD-UNSD MEIP 2026 release introduced new MNE Indicators (employees, revenue, profit, R&D). Technology and healthcare sectors account for ~80% of R&D spending across the top 500. Technology and financials together generate ~55% of net profit.
- AI now in 1 in 20 news articles. MEIP's news-database integration with GDELT shows ~3 million articles in 2025 mentioned one of the top 500 MNEs (6% of all GDELT articles). 1 in 20 articles mentioned AI; 29% of those AI articles mentioned a top-500 MNE.
The world’s 500 largest multinational enterprises generate revenue equal to roughly a third of global GDP and employ more than 70 million people directly. They are also one of the most geographically concentrated phenomena in the modern economy — a fact that the OECD and UN Statistics Division’s Multinational Enterprise Information Platform (MEIP) made dramatically more measurable with its 4th release in March 2026.
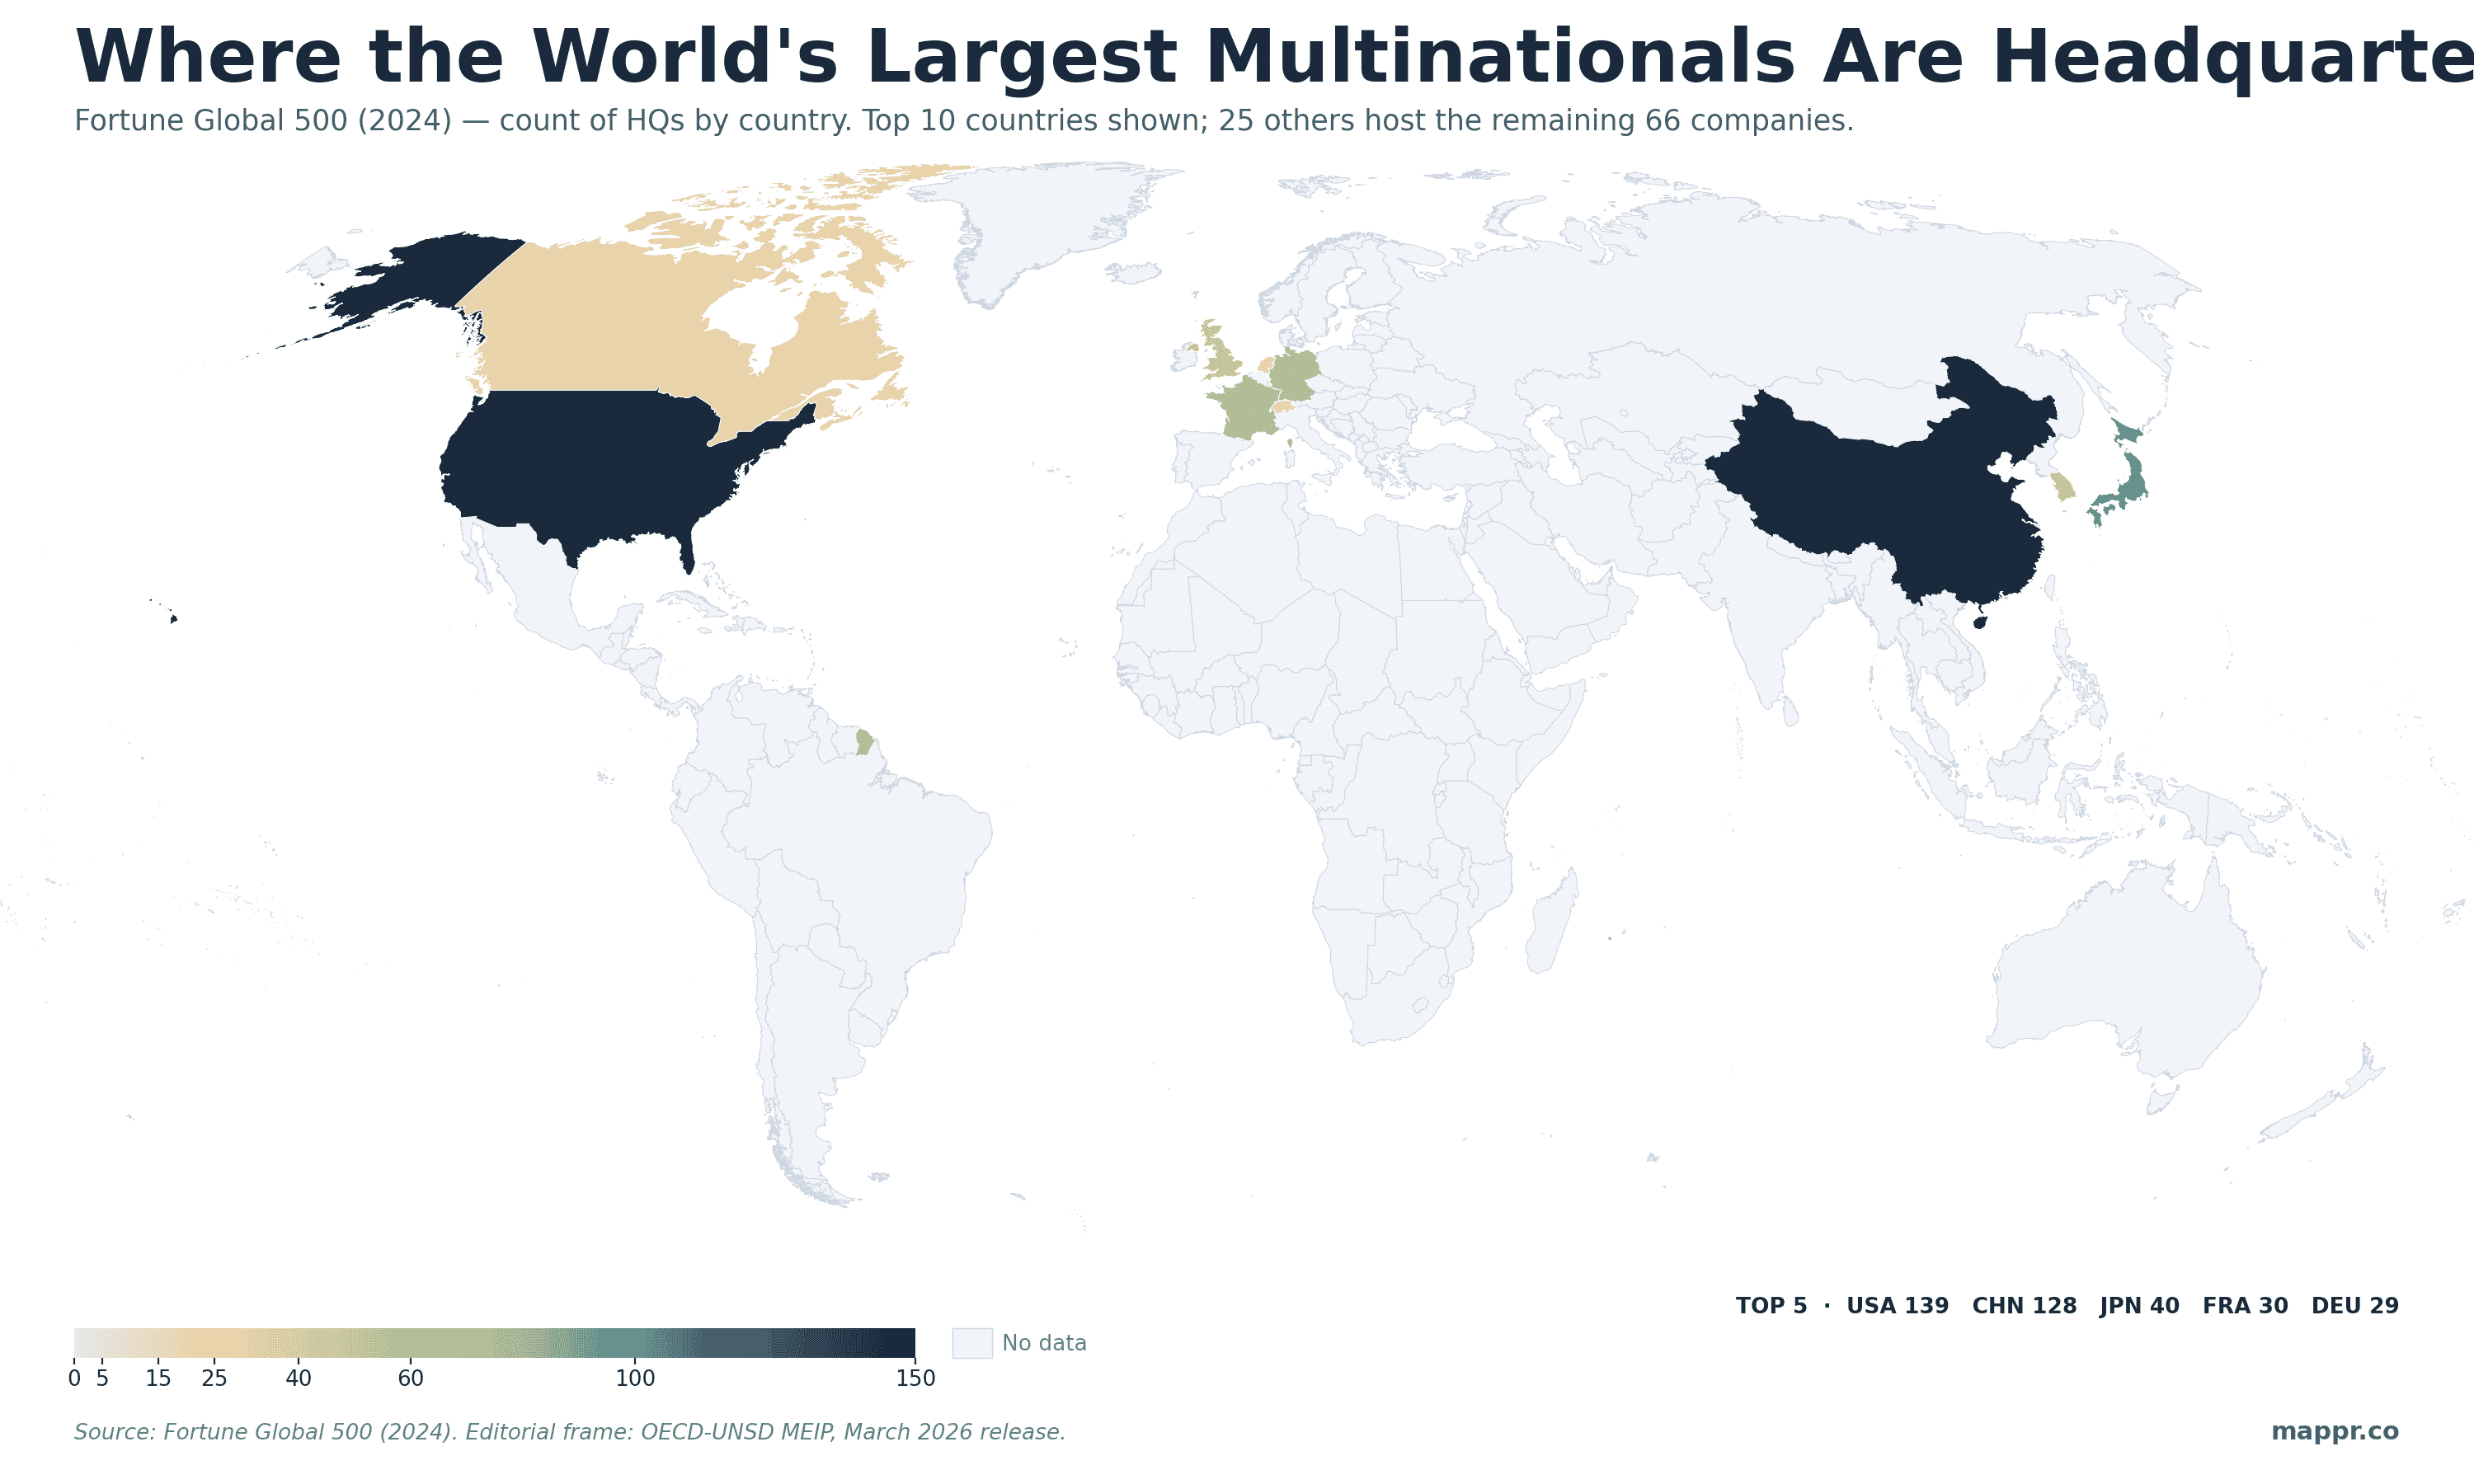
The map above shades countries by the count of Fortune Global 500 (2024) headquarters — the closest publicly verifiable proxy for the OECD-UNSD top-500 universe. The visual story is the same in either ranking: two countries account for more than half of all top-500 MNE headquarters, a Western European cluster sits in the second tier, and most of the world hosts none at all.
What’s New in the OECD-UNSD March 2026 MEIP Release
MEIP is a joint OECD–UN Statistics Division platform that consolidates publicly available data on the world’s 500 largest MNEs — their subsidiaries, ownership links, digital footprint and major corporate events. The 4th release on 18 March 2026 added several substantial new layers:
- MNE Indicators — for the first time, MEIP publishes employees, revenue, net profit and R&D for each of the top 500. The figures are extracted from company filings and annual reports using AI tools, then cross-validated against hybrid sources.
- S&P Capital IQ linkage — MEIP now matches its corporate entities to over 25 million company names from the S&P Data Unlocked initiative, giving users the ability to combine MEIP records with Capital IQ identifiers.
- CommonCrawl-derived ownership signals — MEIP now mines website scripts (Google Analytics IDs, ownership identifiers) across the millions of sites in the CommonCrawl archive, surfacing parent-subsidiary links that don’t show up in any official register.
- News tracking via GDELT — MEIP maps roughly 3 million 2025 news articles to specific top-500 MNEs, enabling time-series analysis of media attention around mergers, acquisitions and controversies.
The OECD describes the top-500 as concentrated “in the Americas, and the United States in particular, and Europe, which together host 74% of the top 500 MNE headquarters and their revenue, compared to 24% in Asia.” The remaining 2% spans the Gulf, Brazil, Australia and a handful of smaller jurisdictions. The MEIP authors put it more bluntly in a 2025 progress note: almost half the top 500 are headquartered in the United States alone.
Top 10 Host Countries (Fortune Global 500, 2024)
OECD-UNSD does not publish its 500-name MEIP roster as a downloadable list — the underlying universe is constructed from Forbes Global 2000 size criteria plus methodological cuts. The closest publicly verifiable companion ranking is the Fortune Global 500, ranked by 2023 revenue and published annually each August. The two universes overlap heavily but not perfectly: MEIP is more inclusive of non-US firms and large state-owned enterprises, while Fortune G500 leans pure-revenue.
The 2024 Fortune Global 500 spans 238 cities in 35 countries and territories. The top 10 host countries between them account for 434 of the 500 — leaving just 66 companies spread across the remaining 25 jurisdictions, most of which appear only once or twice on the list.
| # | Country | Fortune Global 500 HQs |
|---|---|---|
| 1 | 🇺🇸 United States | 139 companies |
| 2 | 🇨🇳 China | 128 companies |
| 3 | 🇯🇵 Japan | 40 companies |
| 4 | 🇫🇷 France | 30 companies |
| 5 | 🇩🇪 Germany | 29 companies |
| 6 | 🇬🇧 United Kingdom | 17 companies |
| 7 | 🇰🇷 South Korea | 15 companies |
| 8 | 🇨🇦 Canada | 14 companies |
| 9 | 🇨🇭 Switzerland | 11 companies |
| 10 | 🇳🇱 Netherlands | 11 companies |
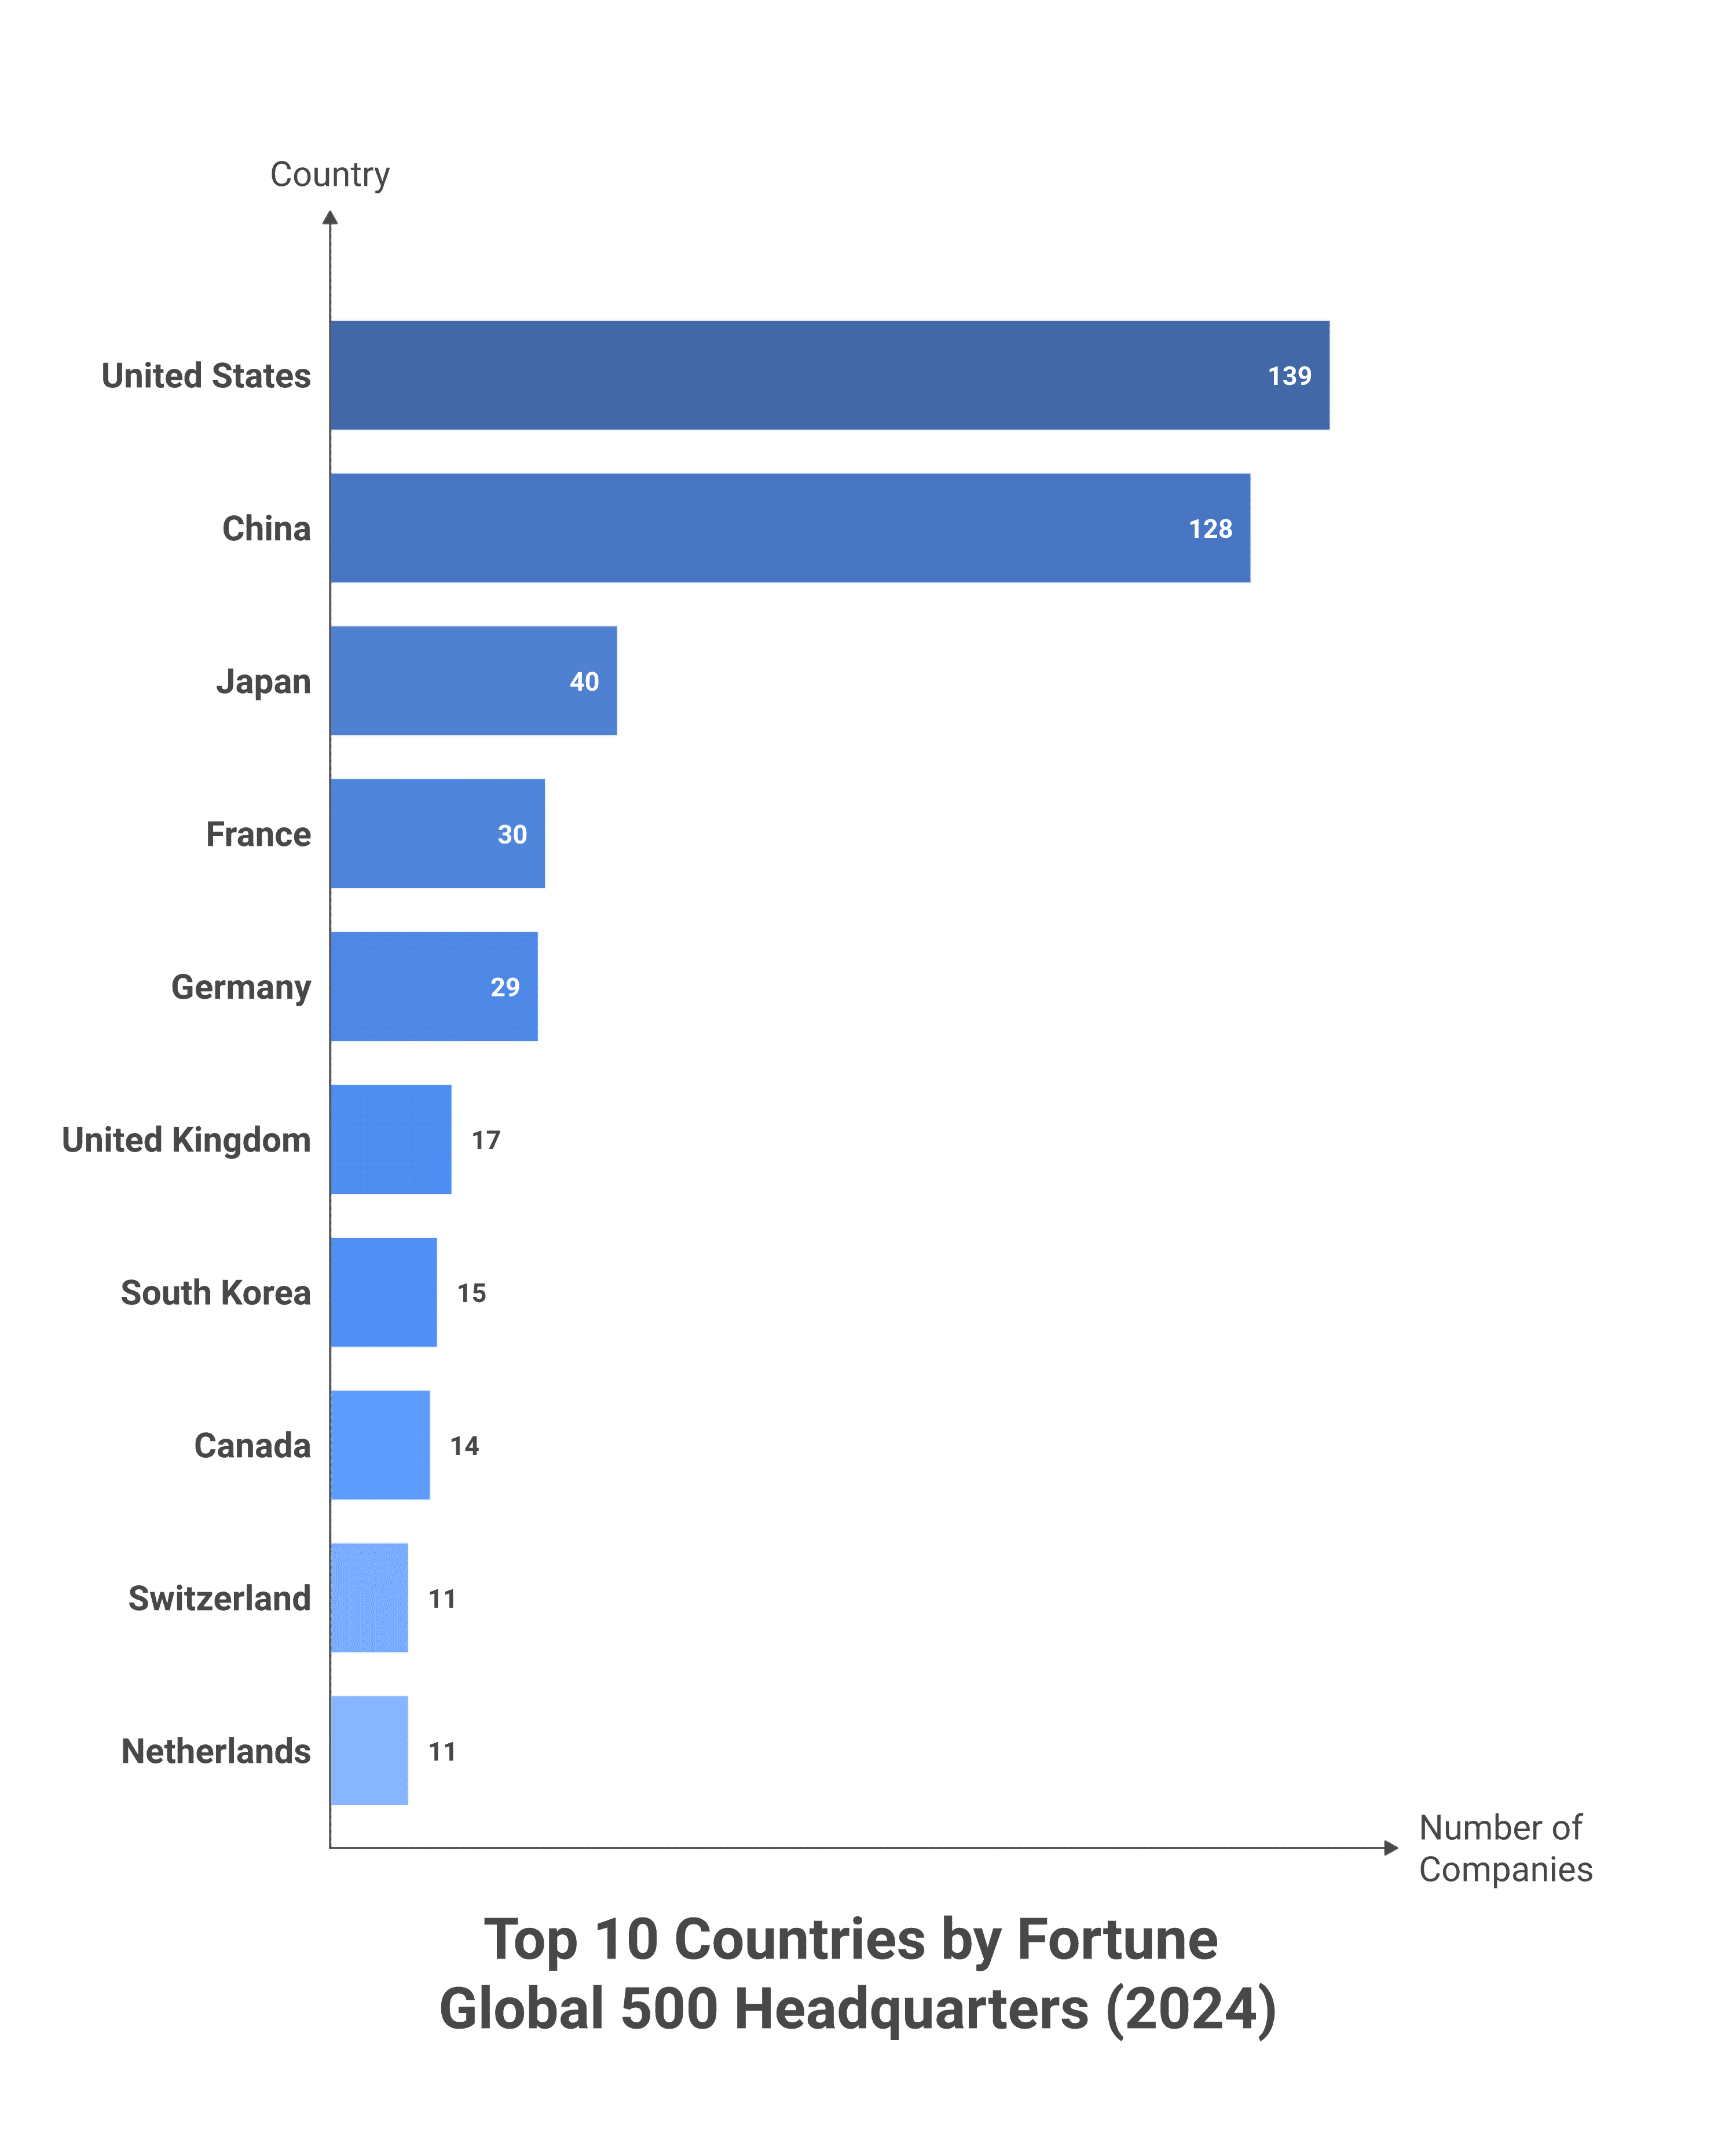
The two-pole structure is now stable. China overtook the US briefly in 2018–2019 by Fortune G500 count, but the 2024 list flips back to American dominance — 139 to 128. Behind those two, Japan (40) and the European G7 trio (France, Germany, UK = 76 combined) form a stable second tier. South Korea (15) is the only non-China Asian economy in the top 10, reflecting the disproportionate weight of its chaebols. Switzerland and the Netherlands, both at 11, punch far above their population weight thanks to financial-services specialisation and tax-friendly holding-company structures.
The Missing Continent
Africa hosts essentially no top-500 MNE headquarters in the standard rankings. Latin America is similarly thin — Brazil’s Petrobras and JBS appear in Fortune’s list, Mexico’s América Móvil makes the cut, but the whole region accounts for a low single-digit share. India is striking by its absence — fewer than ten Fortune Global 500 entries in 2024 (led by Reliance Industries, LIC, Indian Oil and the State Bank of India) despite India being the world’s third-largest economy by PPP. The geography of the top 500 reflects three things rather than economic size alone: where capital aggregates, where 20th-century state-led industrial policy produced national champions large enough to globalise, and where post-war manufacturing scale persisted.
India and Indonesia together generate roughly $7 trillion in nominal GDP — but produce a single-digit number of top-500 MNEs between them, fewer than tiny Switzerland. Capital concentration, not GDP, is what determines whether a country shows up at all on this map.
Sectoral Concentration: Tech, Healthcare and Finance
The MEIP MNE Indicators add-on lets researchers slice the top 500 by sector for the first time. The OECD’s headline cuts:
- R&D spending: Technology and healthcare sectors account for roughly 80% of all R&D among the top 500 — a number that confirms what equity-research desks have been pricing for a decade and that explains why a handful of these firms function as quasi-utilities for the world’s innovation pipeline.
- Net profit: Technology and financial-services sectors generate around 55% of all net profit. The pattern is more skewed than the revenue distribution: technology firms convert each dollar of revenue to profit at multiples of what energy or retail can.
- Revenue per employee: Highest in energy and utilities, followed by healthcare and basic materials. The high-employment / lower-margin sectors (retail, consumer goods) sit at the bottom of this ratio.
The Top 500 Generate Their Own Weather
One of the more striking findings in the MEIP March 2026 release comes from the GDELT integration. Roughly 3 million news articles in 2025 mentioned one of the top 500 MNEs explicitly — about 6% of all articles in GDELT’s global news corpus. Combined, these 500 firms received more news mentions than any individual country.
Artificial intelligence is the topic that scaled fastest into mainstream coverage in 2025. About 1 in 20 articles in GDELT mentioned AI — up from 1 in 30 in 2024. Twenty-nine percent of those AI articles also mentioned one of the top 500 MNEs — a year earlier the share had been 34%, suggesting that AI coverage is broadening beyond the largest firms but that the top 500 still anchor the bulk of the conversation.
The platform also surfaces individual-company spikes corresponding to deals or controversies. The OECD highlights ABB Ltd’s October 2025 sale of its robotics division to SoftBank — a Japanese-headquartered acquirer buying a unit from a Switzerland-headquartered firm — as the kind of cross-border ownership shift that MEIP is now able to track in near-real time, rather than waiting for it to settle into national statistical registers.
Data and references underpinning this map.