Key Takeaways
- World average sits at 71.2%. Roughly 7 in 10 people now use the internet — but the global average masks a 90-point gap between the top of the league and the bottom.
- Three Gulf states hit 100%. Bahrain, Saudi Arabia and the UAE report universal access in the 2024 vintage. Denmark, Kuwait, Monaco and Norway sit just below at 99% or higher.
- Sub-Saharan Africa: 33.6%. Twelve of the bottom 15 countries are in Sub-Saharan Africa. Burundi (8.6%), Uganda (9.0%) and Chad (12.6%) anchor the global floor.
- Gender gap widens at low connectivity. Where access is high, men and women use the internet equally. Where it's low, men outpace women by 10–14 percentage points — Egypt, Iraq, Pakistan and India lead that gap.
- Refreshed by the April 2026 WDI batch. The World Bank's quarterly Digital block added 2024 values for internet access, mobile cellular subscriptions, fixed broadband and fixed telephone lines — released April 8, 2026.
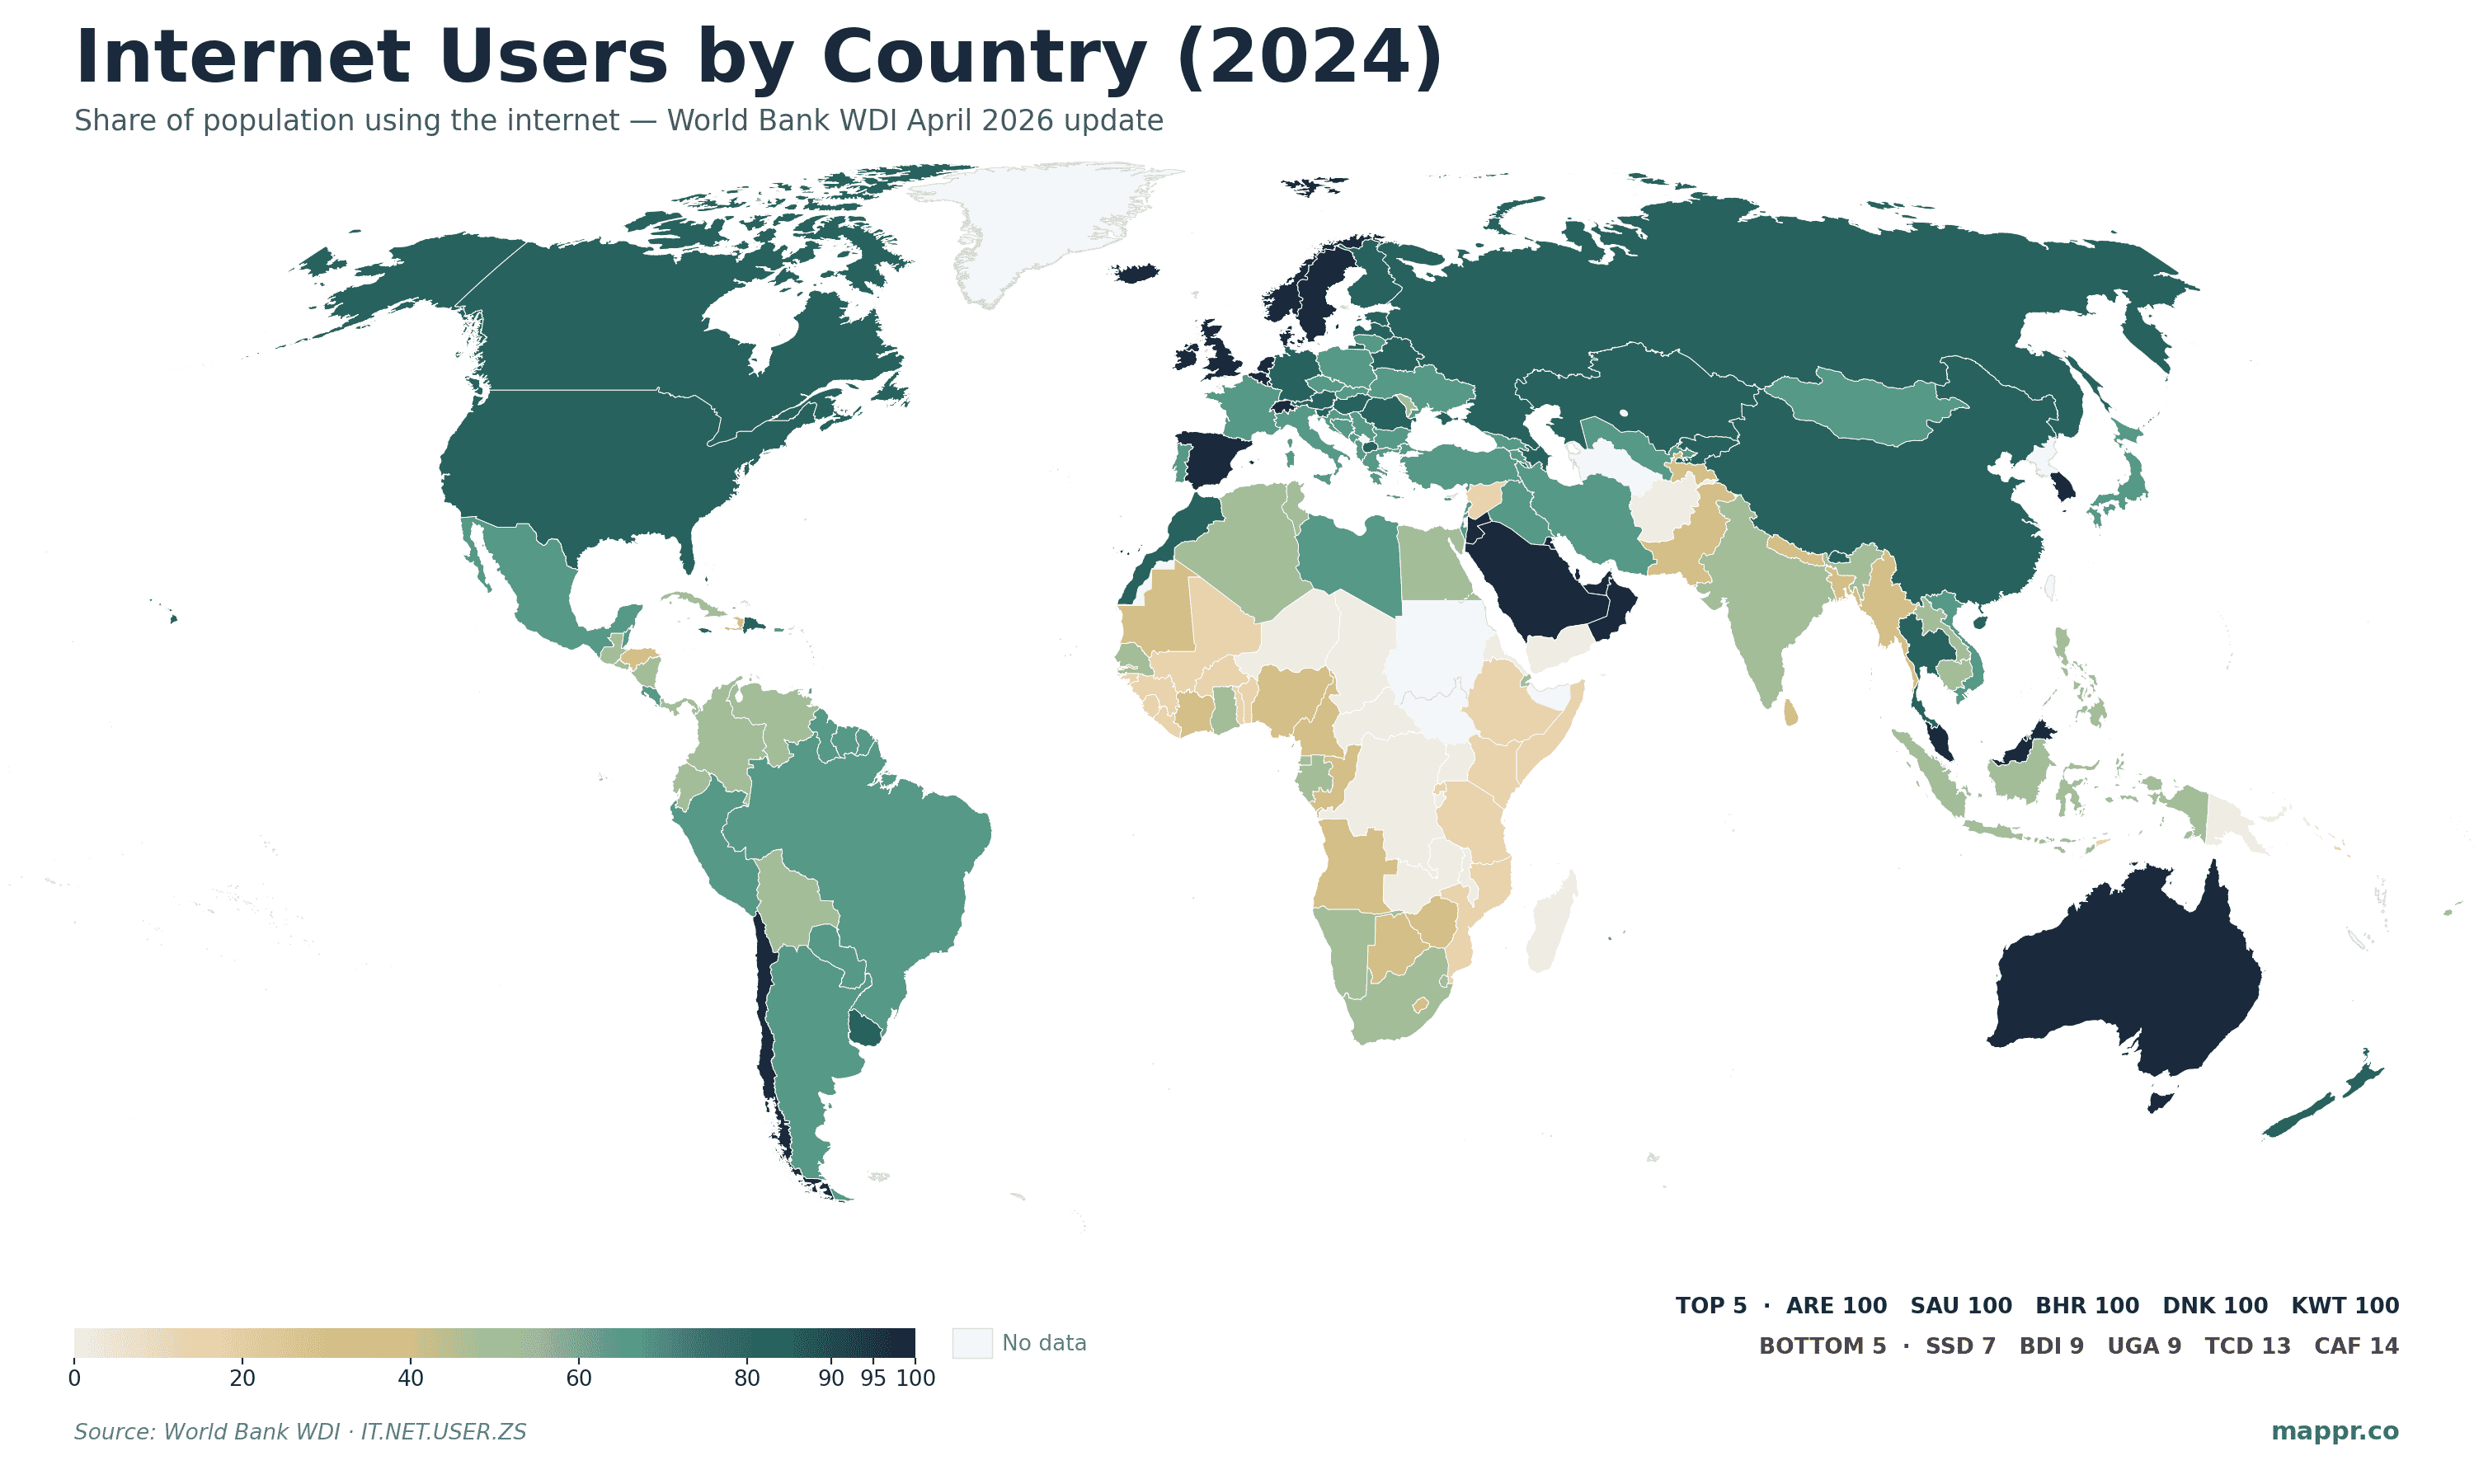
Roughly 71% of the world’s population used the internet in 2024 — up from 69% the year before, per the World Bank’s April 2026 World Development Indicators update. But the global average is the least interesting number on the page. Behind it sit 27 countries with near-universal access, a long middle tier in the 60–90% band, and a bottom group of 14 nations where fewer than one in five people have ever been online.
The choropleth above maps every country shaded by its 2024 internet-use rate, drawing on the IT.NET.USER.ZS indicator. The pattern is geographic and economic: high-income Europe, North America, the Gulf and the Asian Tigers sit darkest; Sub-Saharan Africa, parts of South Asia and a handful of conflict-affected states sit lightest. The split has narrowed since the early 2010s but is still the cleanest single map of the global digital divide.
Where Internet Use Is Universal
Twenty-seven countries report internet access rates of 95% or higher in the 2024 vintage. The top of the table is dominated by two clusters: Gulf petrostates with deep state investment in mobile infrastructure (Bahrain, Saudi Arabia, UAE, Kuwait, Qatar) and the Nordics plus European microstates (Denmark, Norway, Iceland, Luxembourg, Liechtenstein, Monaco, San Marino, Switzerland). Asia’s developed economies — South Korea, Malaysia — round out the top 15.
Three countries hit a clean 100.00 — Bahrain, Saudi Arabia and the United Arab Emirates. The figure is the rounded value the International Telecommunication Union supplies the World Bank; in practice the survey populations are small enough that “everyone surveyed had used the internet in the last three months” rounds to a flat 100. Denmark (99.77%), Kuwait (99.75%) and Norway (99.00%) sit a fraction below.
| # | Country | Internet users (% of population) |
|---|---|---|
| 1 | 🇧🇭 Bahrain | 100.00% |
| 2 | 🇸🇦 Saudi Arabia | 100.00% |
| 3 | 🇦🇪 United Arab Emirates | 100.00% |
| 4 | 🇩🇰 Denmark | 99.77% |
| 5 | 🇰🇼 Kuwait | 99.75% |
| 6 | 🇲🇨 Monaco | 99.04% |
| 7 | 🇳🇴 Norway | 99.00% |
| 8 | 🇱🇺 Luxembourg | 98.76% |
| 9 | 🇱🇮 Liechtenstein | 98.26% |
| 10 | 🇮🇸 Iceland | 98.21% |
| 11 | 🇶🇦 Qatar | 98.09% |
| 12 | 🇲🇾 Malaysia | 98.02% |
| 13 | 🇰🇷 South Korea | 97.90% |
| 14 | 🇸🇲 San Marino | 97.35% |
| 15 | 🇨🇭 Switzerland | 97.34% |
The 30-Percent Floor
At the other end, 21 countries report internet use below 30% and 14 below 20%. The bottom 15 is geographically narrow: twelve of the lowest fifteen are in Sub-Saharan Africa, joined only by Afghanistan (16.1%), Yemen (17.5%) and Papua New Guinea (18.8%). Burundi (8.6%), Uganda (9.0%) and Chad (12.6%) anchor the global floor among countries with current data; South Sudan’s last reported value of 6.7% from 2019 is older but consistent with what national operators publish.
Two structural features show up across the bottom. The first is the infrastructure floor: rural electrification rates under 30%, smartphone-affordability ratios where a basic data plan costs more than a week of median income, and 4G coverage gaps in landlocked or low-density geographies. The second is conflict: Afghanistan, Yemen, Sudan, DR Congo and the Central African Republic all rank in the bottom 20 and all have active or recent armed conflict suppressing both household uptake and network rollout.
| # | Country | Internet users (% of population) |
|---|---|---|
| 1 | 🇸🇸 South Sudan | 6.67% (2019 value) |
| 2 | 🇧🇮 Burundi | 8.60% |
| 3 | 🇺🇬 Uganda | 8.95% |
| 4 | 🇹🇩 Chad | 12.63% |
| 5 | 🇨🇫 Central African Republic | 13.78% |
| 6 | 🇪🇷 Eritrea | 14.35% (2020 value) |
| 7 | 🇳🇪 Niger | 15.56% |
| 8 | 🇦🇫 Afghanistan | 16.09% |
| 9 | 🇿🇲 Zambia | 17.10% |
| 10 | 🇾🇪 Yemen | 17.49% (2019 value) |
| 11 | 🇲🇬 Madagascar | 18.68% |
| 12 | 🇵🇬 Papua New Guinea | 18.81% |
| 13 | 🇲🇼 Malawi | 18.96% |
| 14 | 🇨🇩 DR Congo | 19.67% |
| 15 | 🇲🇿 Mozambique | 20.53% |
The Regional Story
The World Bank’s regional aggregates frame the divide most cleanly. North America averages 94.4% in 2024. Europe sits in the same band — Western European G7 economies are clustered between 88% (France) and 96% (Spain, UK), with Germany at 93.5% and Italy at 89.2%. Latin America and the Caribbean averages 81.7%, East Asia and Pacific 86.6% (anchored by South Korea, Malaysia and a fast-rising China at 92.0%), and South Asia 62.8% (held up by India at 64.9% but with Pakistan at 57.3% and Bangladesh at 53.4%).
Sub-Saharan Africa’s regional aggregate is 33.6% — meaning the typical Sub-Saharan African is still less likely to use the internet than not. The number conceals real variation: South Africa (78.4%), Ghana (72.2%), Senegal (60.1%), Nigeria (41.2%) and the regional middle have moved sharply up since 2018, but the lowest-income agrarian economies (Burundi 8.6%, Malawi 19.0%, Madagascar 18.7%, DR Congo 19.7%) have barely moved off single-digit or low-double-digit access rates and are not closing the gap with the rest of the world.
The MENA aggregate of 61.5% is the most internally divergent of any region. The Gulf reports 98–100% across the board; North Africa runs 65–80%; Yemen, Iraq and Syria sit between 17% and 40%. The category averages out to a number that doesn’t describe any actual country in it.
The Gender Gap Tracks Connectivity, Not Geography
The April 2026 release also refreshed the male and female internet-access splits. The pattern is striking: where access is high, men and women use the internet at near-identical rates; where access is low, men outpace women by 10–14 percentage points. The gender gap is a function of who gets access first when it is scarce, not of any geographic constant.
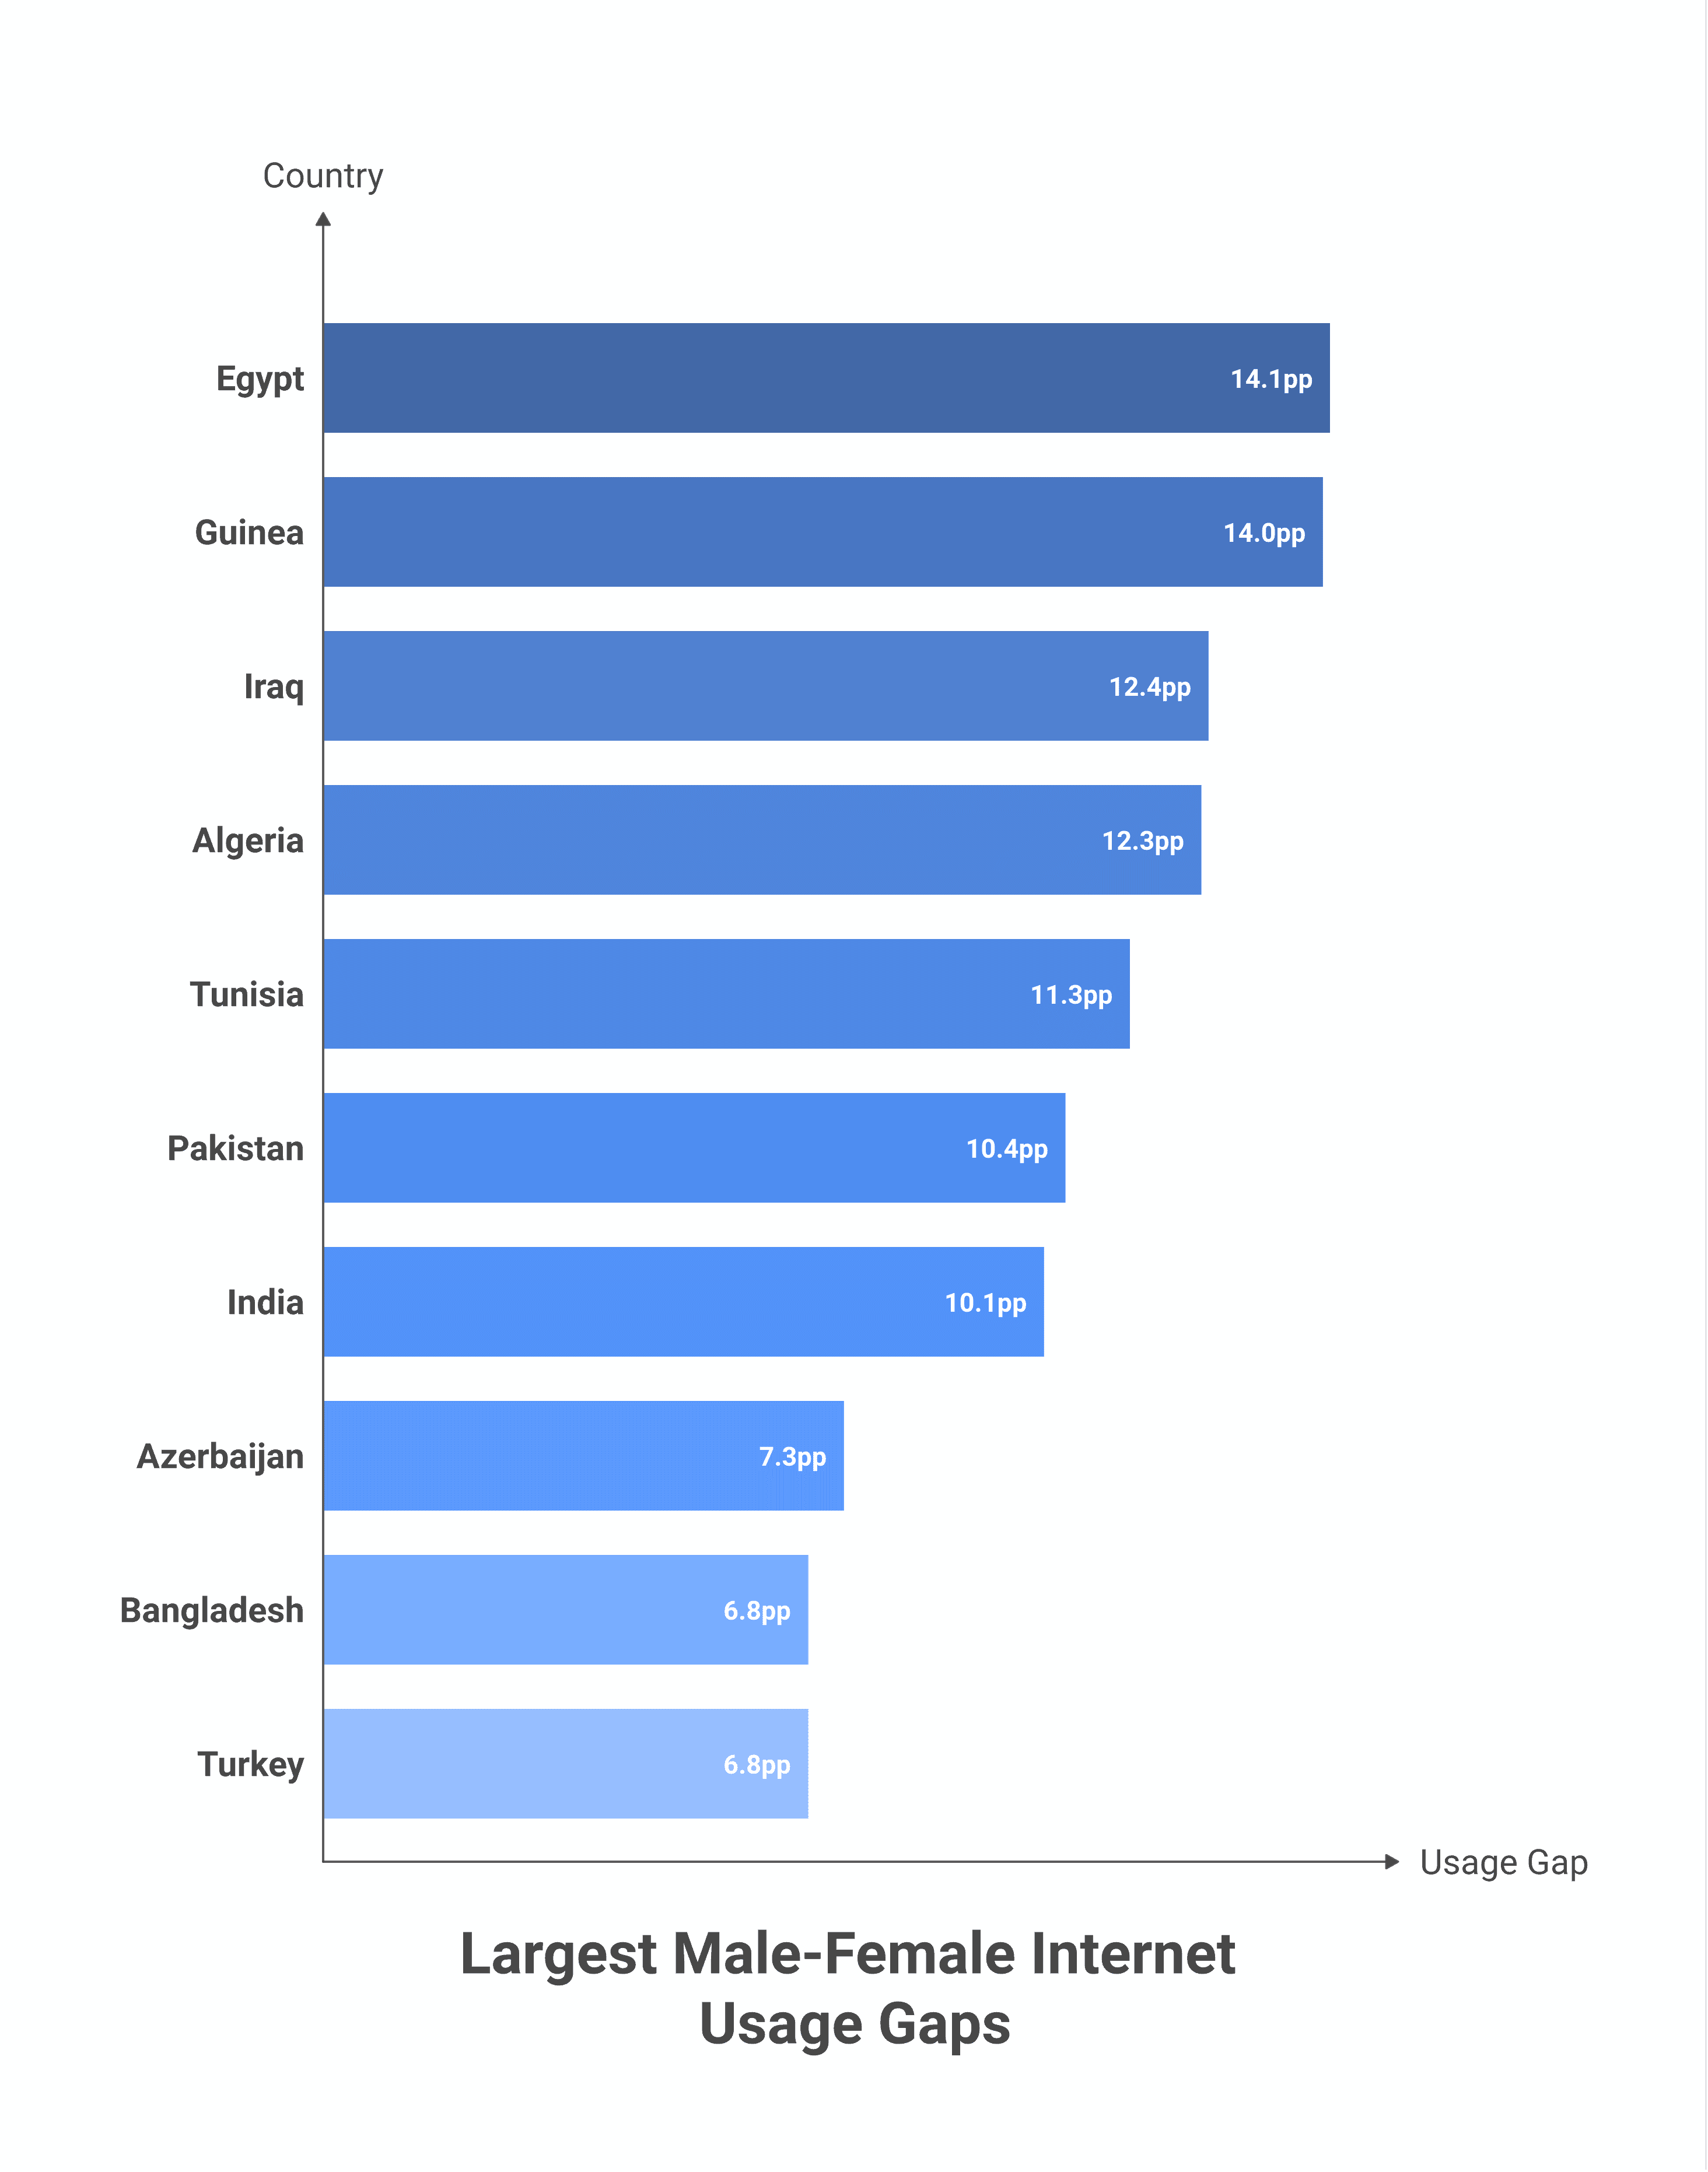
Egypt’s 14.1-point gap (men 79.3%, women 65.2%) is the largest in the database, followed by Guinea, Iraq, Algeria and Tunisia — all MENA or West African economies where gendered patterns of phone ownership and household computing access show up directly. India’s 10.1-point gap and Pakistan’s 10.4-point gap matter most in absolute terms because of population size: 100M-plus women in those two countries who don’t use the internet at the same rate as men of the same age.
The reverse end is unusual. Maldives reports women at 95.5% and men at 76.4% — a 19-point female lead, driven by a male migrant-worker population that skews the household-survey denominator. Cuba, Lesotho and Jamaica report smaller but real female-led gaps. Across the 116 countries with both male and female series, 85 show male-leading gaps, 31 show female-leading gaps, and the median gap is small — most of the world’s internet population is now gender-balanced.
What the April 2026 WDI Update Added
The World Bank refreshes the World Development Indicators four times a year. The April 8, 2026 update touched the full Digital block of the database — internet access (total, male, female), mobile cellular subscriptions (total and per-100), fixed broadband subscriptions (total and per-100) and fixed telephone subscriptions (total and per-100). The new vintage extends 211 countries’ internet-access series to 2024 and adds male/female splits for 116 of them.
The headline movement between 2023 and 2024: most countries added 1–3 percentage points. Tanzania (+2.7pp), Ghana (+1.5pp), Burundi (+1.4pp) and Malawi (+1.0pp) are typical of Sub-Saharan trajectories — small absolute gains on small starting bases. At current rates of change, the bottom dozen Sub-Saharan economies will not reach today’s world-average internet penetration this decade. The gap between the world’s most-connected country and its least-connected has not narrowed materially in the last three releases.
For comparison, the same April 2026 batch refreshed the female labour-force participation series — see Mappr’s full breakdown for the gender-and-economy companion view.
Data and references underpinning this map.
For how those users fare on connection speed, see our map of the fastest internet speeds in the world.