Every year the UBS Global Wealth Report ranks the world by how much wealth its people hold, and every year the headline number flatters almost everyone. The 2026 edition, published on 30 June, found that global personal wealth grew by more than 10% in 2025, the fastest pace in years, and that nearly a million new millionaires were minted, close to half of them in the United States. Yet in most countries the typical person got no richer at all. Median wealth actually fell in the majority of markets UBS tracks.
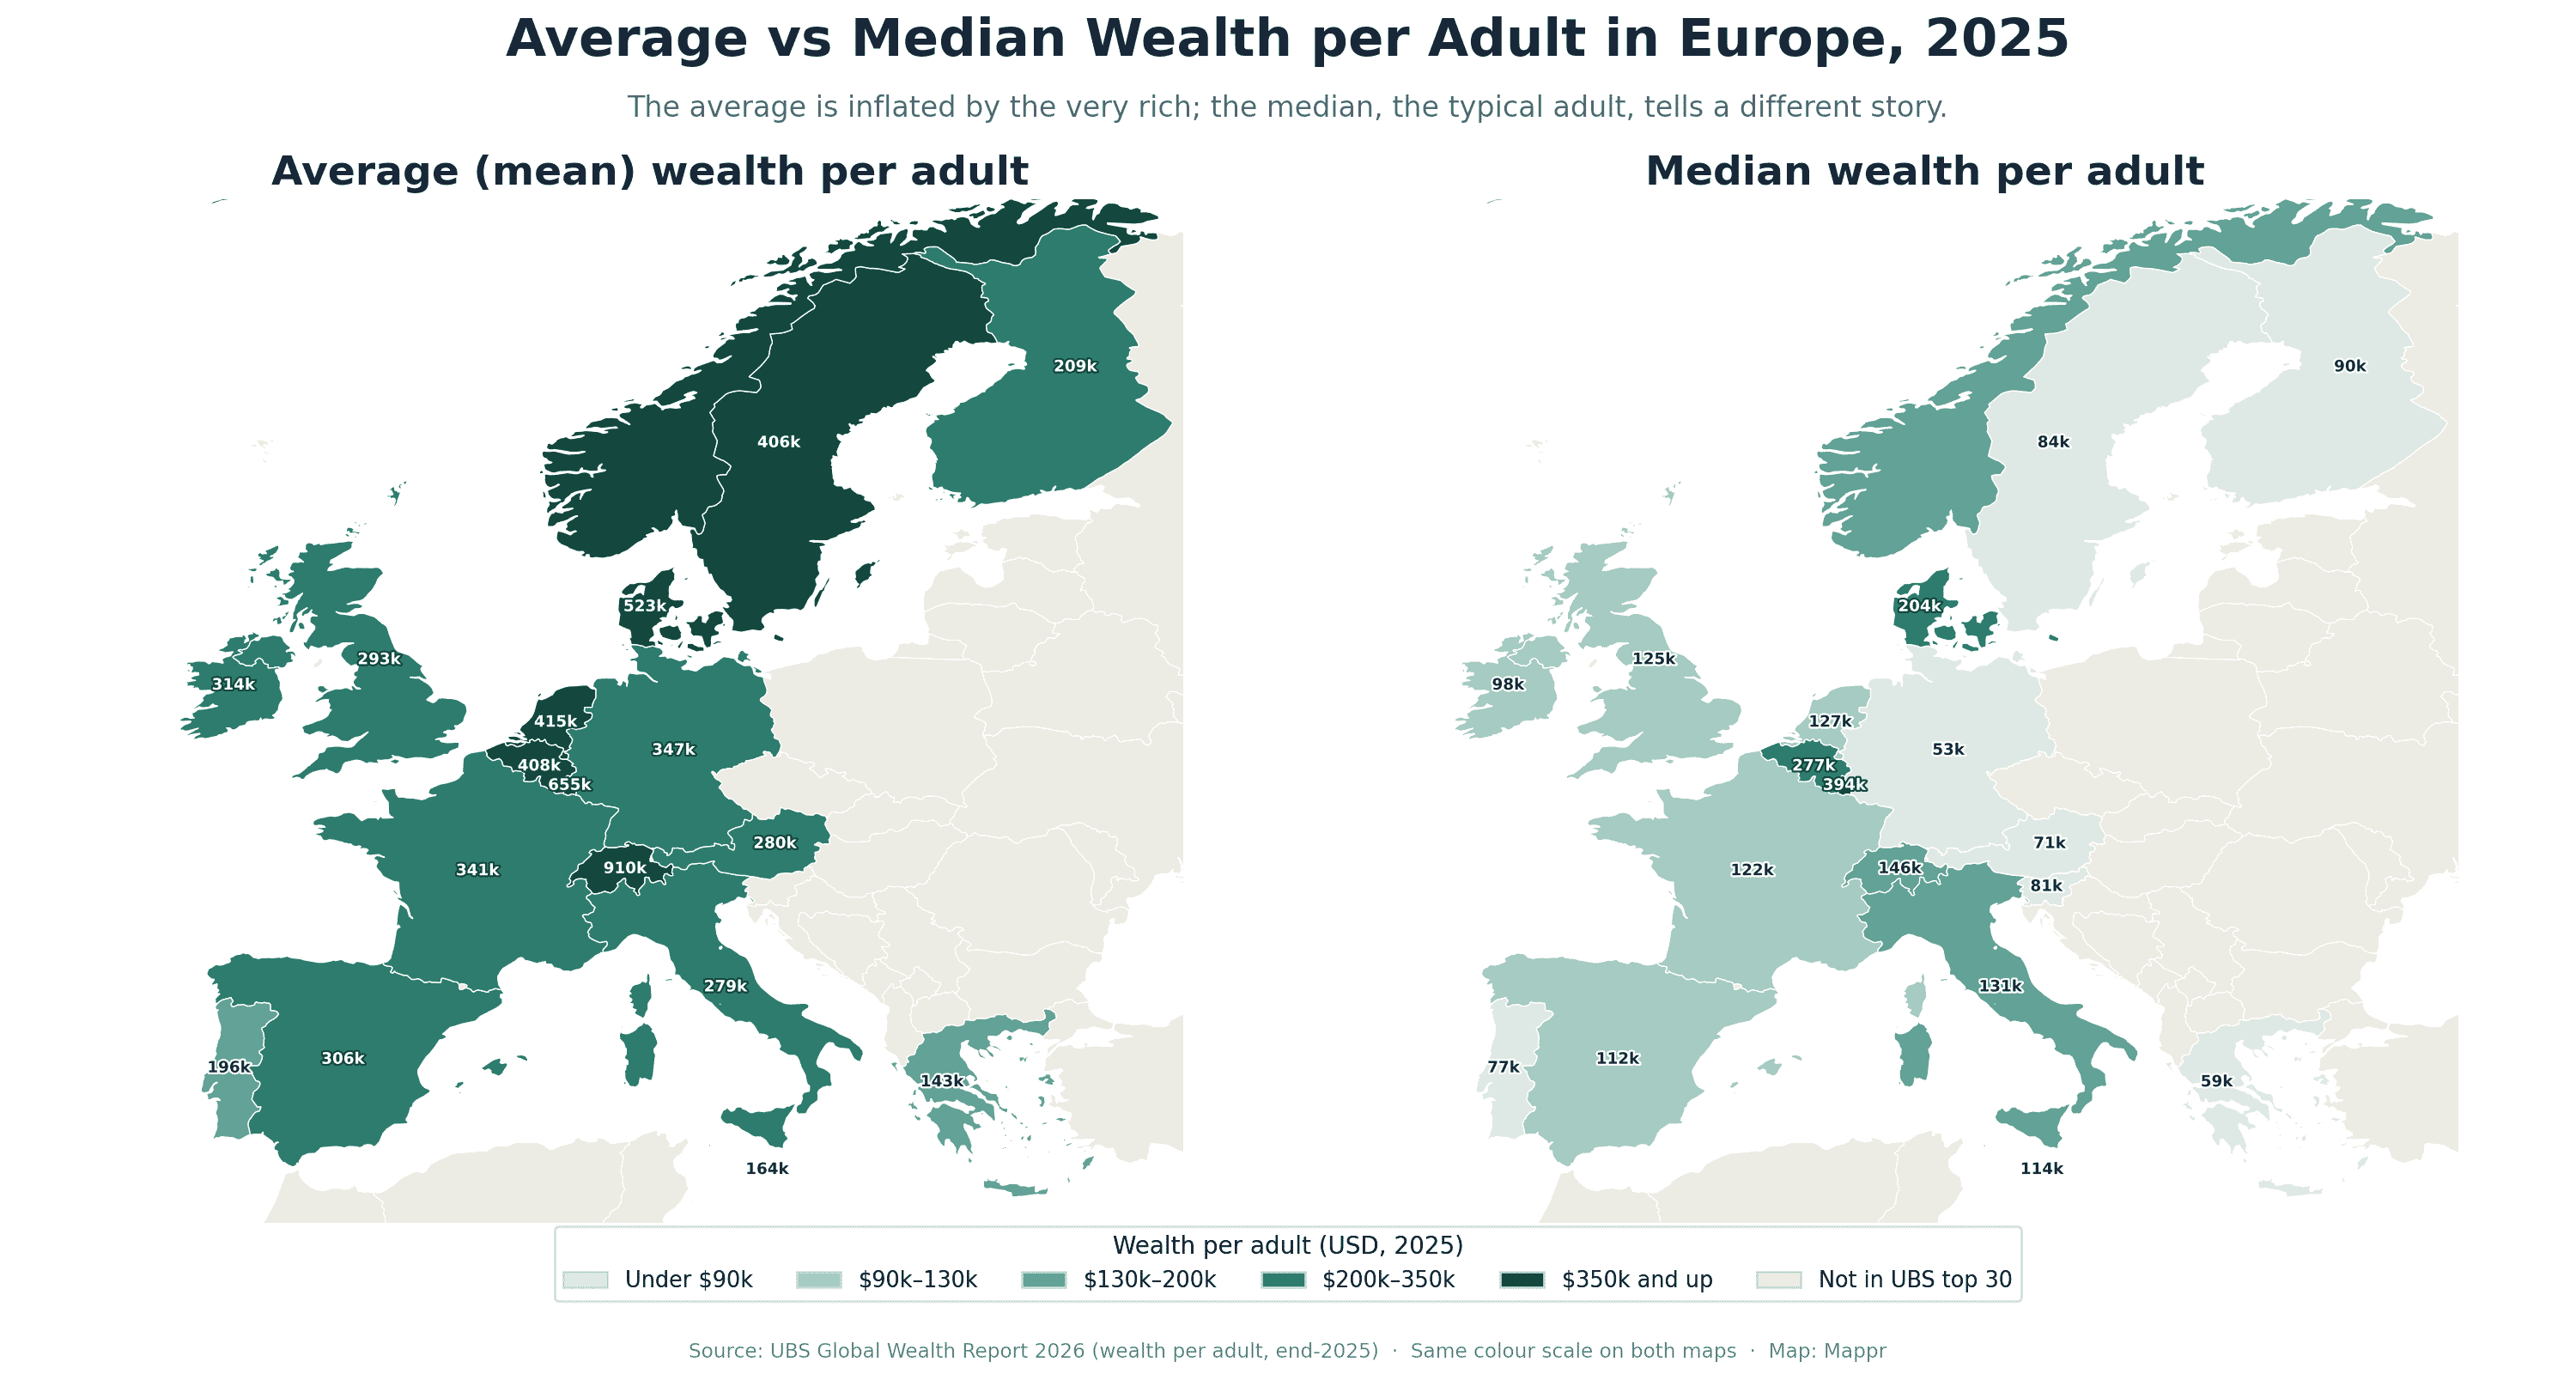
That gap between the average and the median is the whole story, and it produces one genuinely surprising result: measured by the wealth of the person in the middle, the typical Greek adult is now richer than the typical German. Germany’s average wealth per adult is nearly two and a half times higher than Greece’s, and yet flip to the median and Greece edges ahead. The two maps below show why, using the same colour scale so you can watch the wealth drain out of the middle of the distribution.
Key Takeaways
- Greeks are now richer than Germans, by the median. The typical Greek adult holds $59,162 in net worth against the typical German's $53,485, even though Germany's average wealth ($346,613) is nearly two and a half times Greece's ($143,343).
- The average and the median tell opposite stories. The average is pulled up by a rich minority. The median is the person in the exact middle. When the two disagree sharply, wealth is concentrated at the top.
- The United States has the widest gap. America ranks 2nd in the world by average wealth per adult but only 28th by median. Its wealth Gini of 0.77 is the highest of any major developed economy.
- Germany falls furthest of all. Germany is 14th by average but dead last of the top 30 by median. Low home ownership leaves the typical household with little property wealth to fall back on.
- Luxembourg and Belgium spread it best. Luxembourg leads on both measures. Belgium jumps from 11th on the average to 2nd on the median, the picture of broadly shared wealth.
The average tells you about the rich. The median tells you about everyone
The average (or mean) wealth per adult takes a country’s total private net worth and divides it by the number of adults. It is simple, but it has a flaw: a small number of very rich people can drag it upward until it no longer describes anyone in particular. The median fixes that. It is the level at which exactly half the adults are richer and half are poorer, so it tracks the person standing in the middle of the line. When a country’s average sits far above its median, that is the mathematical fingerprint of wealth concentrated at the top.
Switzerland is the clean example. It has the highest average wealth on earth, $910,382 per adult, but its median is $145,555, which drops it from 1st in the world to 8th. Norway, Australia and Denmark barely move between the two measures, a sign their wealth is spread relatively evenly. The countries that tumble are the ones where a wealthy sliver holds a disproportionate share.
Germany’s wealth paradox: rich on paper, thin in the middle
No rich country falls further than Germany. It ranks 14th by average wealth ($346,613) but 30th, last in the top group, by median ($53,485). The typical German adult holds less net worth than the typical Greek, Italian, Spaniard or Portuguese, despite Germany being Europe’s largest and most productive economy.
The main reason is property. Across most of the world a home is the single biggest asset a middle-class household owns, and Germany has one of the lowest home-ownership rates in Europe, around half of households, against roughly 70% or more in Greece, Italy and Spain. A nation of renters builds less household wealth in the middle, even as its companies and its richest citizens prosper. Germany’s wealth Gini of 0.67, well above Greece’s 0.60, confirms a more top-heavy distribution.
The American mirror image
If Germany is the sharpest case in Europe, the United States is the sharpest in the world. America is 2nd by average wealth ($696,277) and only 28th by median ($68,998), a 26-place collapse. Its wealth Gini of 0.77 is the highest of any major advanced economy, ahead even of the levels seen in parts of the Gulf and Latin America. Booming stock markets and a record run of new millionaires lifted the American average in 2025, but the median barely felt it. This is the same pattern as Germany, stretched to a continental scale.
Where wealth is actually shared
The flip side of the ledger is just as instructive. Luxembourg tops both rankings, with the world’s highest median at $394,005. Belgium is the standout: 11th by average but 2nd by median, the profile of a country where wealth reaches deep into the middle class. Japan (24th to 10th), Italy (23rd to 11th) and Malta all climb sharply when you switch to the median, thanks to high home ownership and comparatively flat distributions. These are the places where the average and the median nearly agree, which is exactly what broadly shared prosperity looks like on a chart.
The inequality dial: wealth Gini, 2025 The Gini coefficient runs from 0 (everyone equal) to 1 (one person owns everything). On wealth, the most unequal advanced economies are the United States (0.77) and, surprisingly, Sweden (0.74), whose famously equal incomes hide a concentrated stock of wealth. Germany sits at 0.67 and Switzerland at 0.68. At the other end, Belgium (0.46) and Slovakia (0.38) are the most equal wealth distributions UBS measures. High average wealth and high equality do not go together, a country can be rich and lopsided, or rich and even. |
The full ranking
The table below lists the 29 markets that appear in the top 30 on both measures, with the rank change that reveals how concentrated each country’s wealth really is. A downward arrow means a country slips when you move from the average to the median.
UBS Global Wealth Report 2026
Wealth per adult: average vs median, and the rank swing
Wealth per adult in USD, end-2025. Rank change shows how far a country moves when you switch from the average to the median. The top 29 markets by average wealth.
| Country | Average | Median | Rank change |
|---|---|---|---|
| Switzerland | $910,382 | $145,555 | ▼ 7 |
| United States | $696,277 | $68,998 | ▼ 26 |
| Luxembourg | $654,732 | $394,005 | ▲ 2 |
| Hong Kong SAR | $648,267 | $187,968 | ▼ 2 |
| Australia | $616,306 | $210,783 | ▲ 2 |
| Singapore | $527,217 | $96,434 | ▼ 14 |
| Denmark | $523,344 | $203,771 | ▲ 2 |
| New Zealand | $449,852 | $206,617 | ▲ 4 |
| Norway | $425,391 | $140,003 | 0 |
| Netherlands | $415,287 | $127,407 | ▼ 2 |
| Belgium | $407,920 | $277,166 | ▲ 9 |
| Sweden | $406,406 | $84,039 | ▼ 11 |
| Canada | $399,886 | $147,811 | ▲ 6 |
| Germany | $346,613 | $53,485 | ▼ 16 |
| France | $341,359 | $121,898 | ▲ 1 |
| Taiwan | $332,533 | $113,137 | 0 |
| Ireland | $314,167 | $98,413 | ▼ 2 |
| Israel | $312,108 | $83,843 | ▼ 6 |
| South Korea | $311,260 | $101,739 | ▲ 1 |
| Spain | $306,412 | $111,575 | ▲ 3 |
| United Kingdom | $292,808 | $125,335 | ▲ 8 |
| Austria | $279,989 | $71,378 | ▼ 5 |
| Italy | $279,439 | $131,001 | ▲ 12 |
| Japan | $211,846 | $135,745 | ▲ 14 |
| Finland | $209,135 | $89,695 | ▲ 3 |
| Portugal | $195,761 | $76,978 | 0 |
| Qatar | $188,505 | $95,499 | ▲ 6 |
| Malta | $163,655 | $114,033 | ▲ 13 |
| Greece | $143,343 | $59,162 | ▲ 1 |
The bottom line
Wealth league tables usually reward the same handful of rich, unequal economies. The UBS 2026 numbers are a reminder that how wealth is held matters as much as how much of it there is. The United States and Germany look formidable on the average and ordinary on the median. Greece, Italy and Belgium look modest on the average and quietly comfortable in the middle. When the typical Greek adult overtakes the typical German, it is not because Greece got rich. It is because German wealth, like American wealth, pools at the top and the average was never really describing the person next door.