Key Takeaways
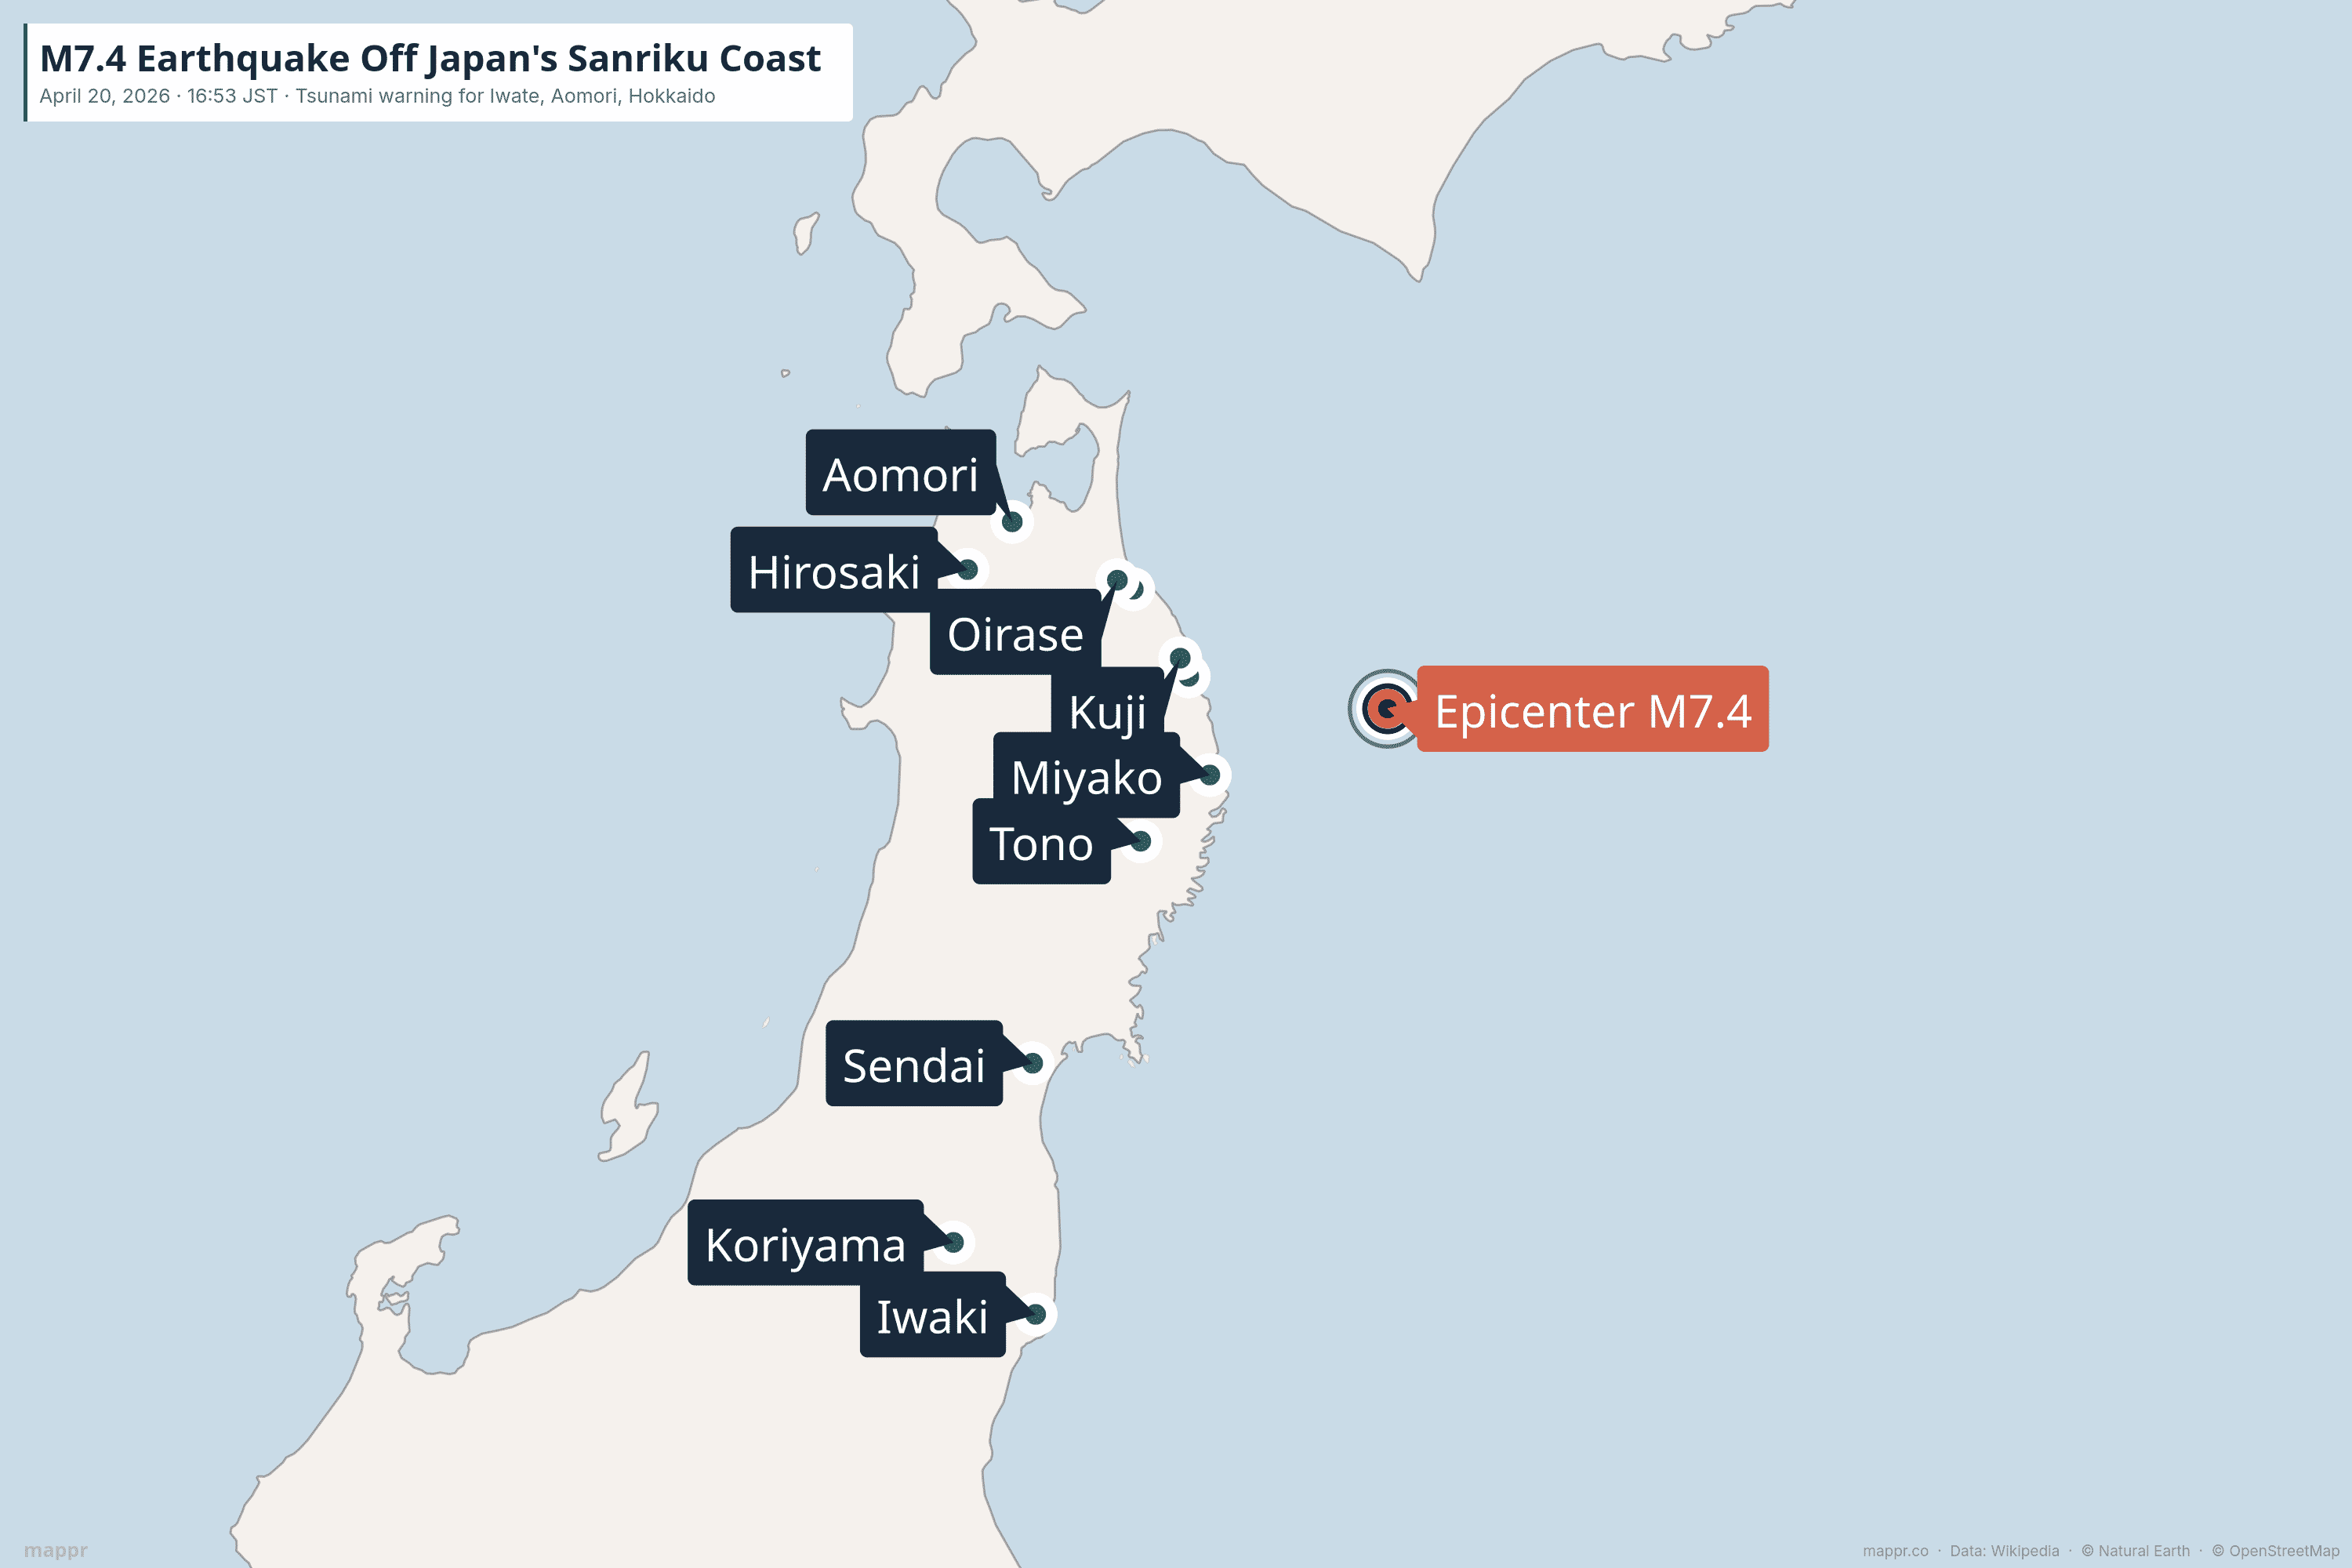
- M 7.4 — 100 km off Miyako, Iwate Prefecture. Struck at 16:53 JST on April 20, 2026. Depth 35 km (USGS) / 10 km (JMA). Same Sanriku-oki fault system that produced the 2011 Tōhoku megathrust.
- Tsunami arrived — peak 80 cm at Kuji Port. JMA's 3 m warning turned out to be conservative. Observed waves: Kuji 80 cm, Miyako 40 cm, Urakawa (Hokkaido) 40 cm, Hachinohe 30 cm, Erimo / Ayukawa 20 cm. All advisories lifted late April 20.
- 2 minor injuries · 0 fatalities. Post-2011 building-code retrofits and rapid coastal evacuations kept the human toll very low. An 80-year-old man in Morioka and a woman in Tōhoku town (Aomori) had minor injuries.
- Tōhoku Shinkansen suspended overnight, resumed April 21. Tokyo–Shin-Aomori line back in service Tuesday morning; Akita Shinkansen partial resumption. A Sanriku Railway train stopped safely in Kōbon Tunnel with 9 passengers; no injuries.
- All nuclear plants report no abnormalities. Tohoku Electric confirmed Onagawa NPP is stable; Fukushima Daiichi + Daini and Higashidōri unaffected. JMA has issued a 7-day elevated-aftershock advisory for Hokkaido / Tōhoku through April 27.
A magnitude 7.4 earthquake struck about 100 kilometres east-northeast of Miyako, Iwate Prefecture, at 16:53 local time (07:53 UTC) on Monday April 20, 2026. The quake hit at a depth of 35 km below the seafloor, according to the US Geological Survey — shallow enough to push a meaningful volume of water and trigger an immediate tsunami warning from the Japan Meteorological Agency.
This is the same stretch of coast — the Sanriku-oki subduction zone — that produced the 2011 Tōhoku earthquake and tsunami that killed more than 18,000 people. Today’s quake is roughly 1/200th of the energy released in 2011 (the Mw 9.0 release was almost 200 times larger), but the geography of the threat is identical: a near-shore offshore rupture sending waves directly at the densely populated coast within minutes.
Interactive Earthquake & Tsunami Warning Map
Click any city to see local shaking intensity (Modified Mercalli, MMI) and population. Click the blue tsunami zones for JMA’s wave-height warning by prefecture. The pulsing red marker is the epicenter.
Tsunami Warning Details
The Japan Meteorological Agency issued a tsunami warning within minutes of the rupture. The initial forecast called for waves of up to 3 metres in Iwate, Aomori, and Hokkaido, with lower-tier advisories for Miyagi and Fukushima. Waves started arriving on the Iwate coast almost immediately. By late evening the warning had been downgraded to advisories, and all tsunami advisories were lifted by roughly 23:53 JST on April 20.
Local governments in Iwate, Aomori, Fukushima, Akita, Miyagi, and Hokkaido issued evacuation orders to coastal residents. The JMA forecast of up to 3 m turned out to be conservative: the highest observed wave was 80 cm at Kuji Port in northern Iwate, with 40 cm each at Miyako and at Urakawa in Hokkaido, 30 cm at Hachinohe, and 20 cm at Erimo and Ayukawa. All five arrivals confirm the rupture generated real seafloor displacement — just at the lower end of what the precautionary forecast modelled.
| Location | Prefecture | Observed peak wave |
|---|---|---|
| 🌊 Kuji Port | Iwate | 80 cm |
| Miyako Port | Iwate | 40 cm |
| Urakawa | Hokkaido | 40 cm |
| Hachinohe Port | Aomori | 30 cm |
| Erimo | Hokkaido | 20 cm |
| Ayukawa Port | Miyagi | 20 cm |
Where the Shaking Was Felt
Despite the offshore epicenter, perceived shaking reached MMI 6 (Strong) in two coastal communities — Noda and Kuji in northern Iwate. The USGS “Did You Feel It?” reports peaked at intensity 7.1 (Very Strong), confirming structural stress in the closest cities.
| City | Population | Shaking (MMI) | Felt as |
|---|---|---|---|
| Noda | 3,852 | MMI 6.1 | Strong |
| Kuji | 32,813 | MMI 6.1 | Strong |
| Hachinohe | 222,799 | MMI 5.8 | Moderate |
| Miyako | 50,855 | MMI 5.7 | Moderate |
| Tono | 25,181 | MMI 5.7 | Moderate |
| Oirase | 24,407 | MMI 5.6 | Moderate |
| Aomori | 425,962 | MMI 5.2 | Moderate |
| Hirosaki | 335,203 | MMI 4.6 | Light |
| Sendai | 1,061,177 | MMI 4.1 | Light |
| Iwaki | 336,111 | MMI 3.9 | Weak |
| Koriyama | 329,706 | MMI 3.8 | Weak |
The single largest exposed urban area was Sendai (1.06 million residents), 200 km south of the epicenter — but it logged only MMI 4.1, equivalent to a noticeable rattle rather than damaging shaking. Closer to the epicenter, Aomori (425,000 residents) and Hachinohe (223,000) recorded the strongest shaking experienced by significant urban populations.
Why the Sanriku Coast Keeps Producing These Quakes
The Japan Trench, just offshore from Iwate Prefecture, is one of the most seismically active subduction zones on Earth. The Pacific Plate dives westward beneath the Okhotsk Plate at roughly 8 cm per year — and the locked sections release that strain in periodic megathrust earthquakes. The 2011 Tōhoku quake (Mw 9.0) ruptured the southern part of this trench. Today’s M7.4 sits in the same fault system but well to the north and at a fraction of the energy.
For perspective, in the past century the Sanriku-oki area has produced four earthquakes above M7.5 — in 1933 (M8.4, killed 3,068 in a tsunami), 1968 (M7.9), 1994 (M7.7), and 2011 (M9.0). A M7.4 is squarely within the expected return period for this stretch of coast — it isn’t a “surprise” event, it’s the kind of quake the region’s building codes and tsunami-evacuation infrastructure were designed for.
Early Impact and Damage Reports
By early April 21 — roughly 12 hours after the rupture — the confirmed picture is:
- No fatalities. Two minor injuries reported — an 80-year-old man in Morioka (Iwate) and a woman in her 20s in Tōhoku town (Aomori).
- Tsunami advisories lifted by ~23:53 JST on April 20 after confirmed arrivals peaked at 80 cm (Kuji) — well below the 3 m forecast.
- Tōhoku Shinkansen resumed service Tuesday morning April 21 between Tokyo and Shin-Aomori after overnight safety inspections. Akita Shinkansen partially resumed except on the Sendai–Morioka segment. A Sanriku Railway train stopped safely in Kōbon Tunnel (between Kuji and Miyako) with 9 passengers on board; all walked out unhurt after inspection.
- 26 non-residential buildings damaged in Aomori Prefecture (schools, restaurants, commercial structures). Around 100 households lost power overnight in Aomori; no widespread outage pattern.
- All three coastal nuclear plant sites — Onagawa (Miyagi), Higashidōri (Aomori), Fukushima Daiichi and Daini — report no abnormalities. Tōhoku Electric noted tide-level changes at Onagawa but no impact on safety or radiation monitoring; the Fukushima decommissioning work continues undisturbed.
- USGS PAGER alert: GREEN — the lowest of four colour-coded loss-estimate tiers. The shallow offshore epicenter, modest magnitude (versus 2011’s M9.0), and post-2011 building-code retrofits kept damage and casualties low.
- JMA issued a 7-day elevated-aftershock advisory for the Hokkaido–Tōhoku offshore region through April 27. The agency estimates roughly a 1% probability of a follow-on quake of M8 or larger — small in absolute terms, but several times the background rate.
What to Watch Next
By the 12-hour mark the picture is already unusually clear: actual wave heights maxed out at 80 cm (well under the 3 m forecast), all nuclear plants are stable, Shinkansen service resumed overnight, and injuries are in the single digits and minor. The remaining watch item is aftershock risk — JMA’s 7-day elevated advisory flags the offshore Tōhoku / Hokkaido zone through April 27 for a modest (~1%) but raised probability of a follow-on M8+ rupture. Historically, Sanriku-oki quakes in this magnitude class can trigger larger slip events in the same system (as 2011’s March 9 M7.3 foreshock preceded the March 11 M9.0). No reason to expect that here, but it’s why the advisory exists.
For continuing updates, the JMA Bōsai map and the USGS event page (linked in the sources below) remain the authoritative feeds. This article reflects the situation as of early April 21, 2026 JST.
Earthquake parameters from the USGS event page; tsunami warning and wave-height observations from the Japan Meteorological Agency (via NHK); post-event impact confirmation cross-referenced from Reuters, The Japan Times, Tōhoku Electric Power.