Key Takeaways
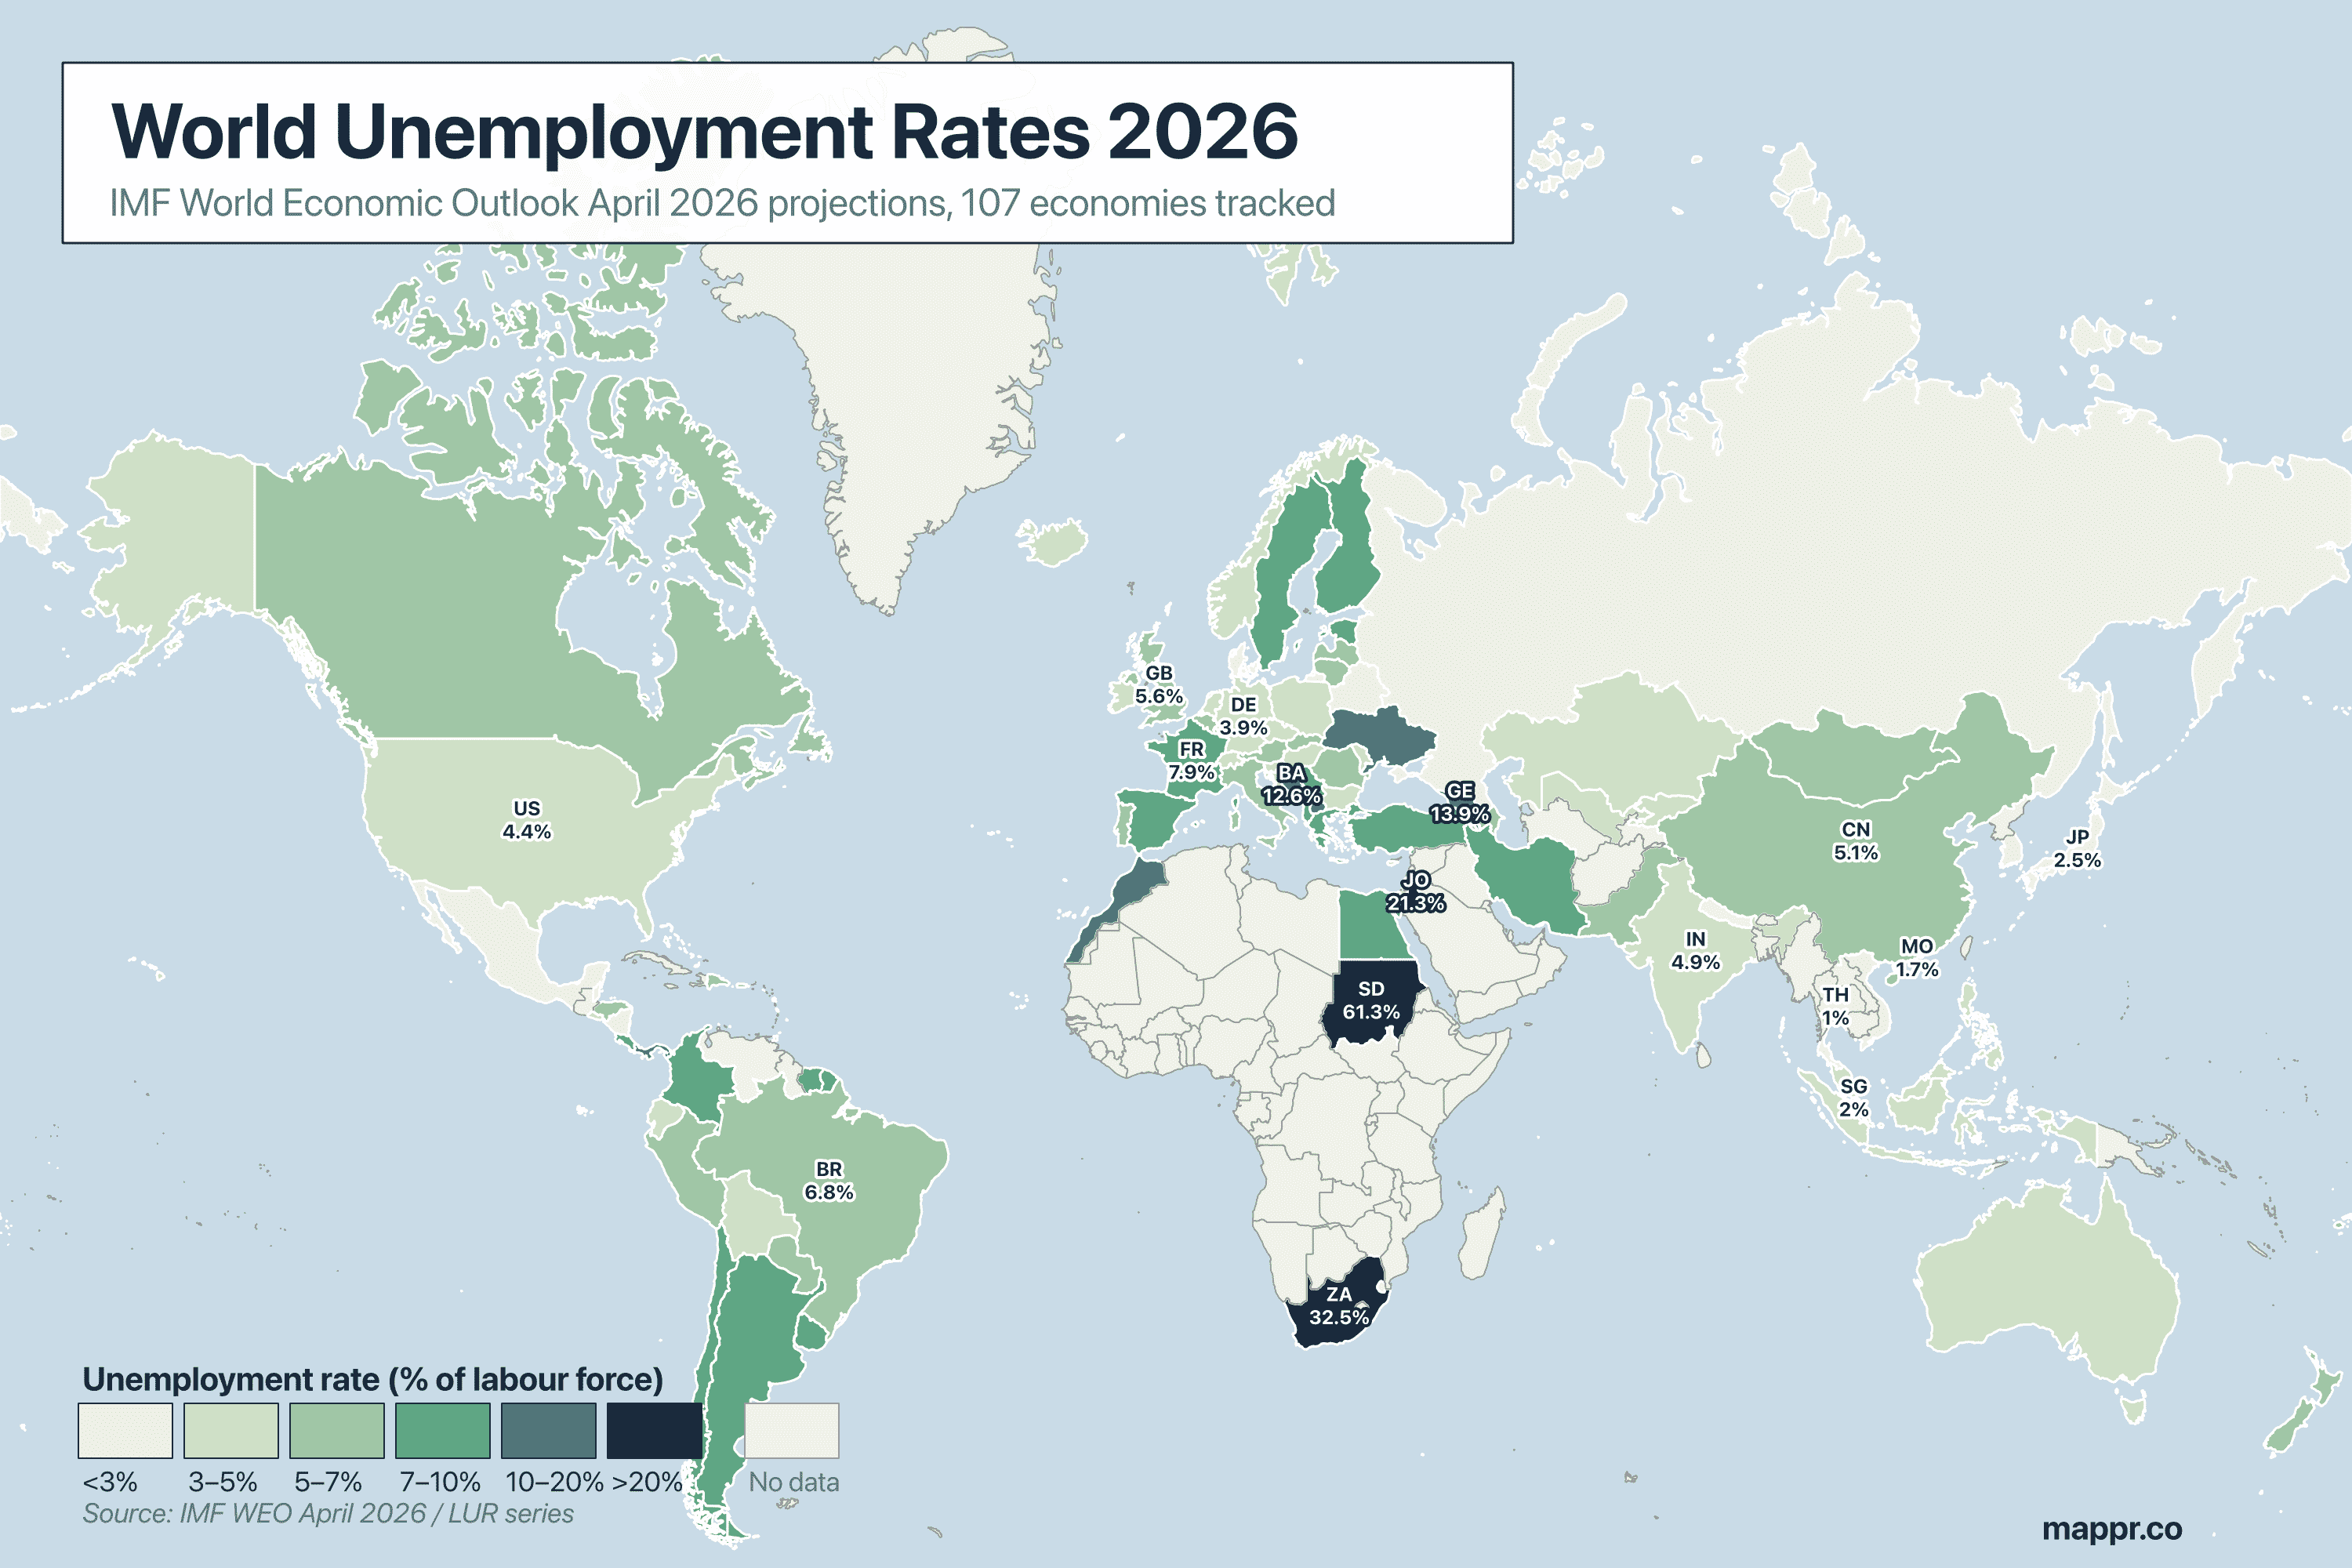
- Sudan — 61.3% unemployment. The highest in the world by a wide margin. Civil-war-driven labour-market collapse has more than doubled Sudan's rate since 2022.
- South Africa — 32.5%, chronic and structural. Decades of post-apartheid economic-transition pressure keep unemployment stuck above 30%, far above any other middle-income economy.
- Thailand — 1.0%, the world's lowest. Reported unemployment is rock-bottom — though a large informal sector keeps the headline figure flattering.
- US 4.4%, Germany 3.9% — below the developed-world median. Both sit well below France (7.9%), Spain (9.8%), and Finland (9.6%) in the IMF's 2026 projections.
- 52 of 107 economies report unemployment under 5%. The median IMF 2026 projection is 5%. Only 3 economies are projected above 20% — a tight distribution clustered around 4–7%.
Unemployment rates don’t tell you whether a country is prosperous — they tell you whether people who want work can find it. In the IMF’s April 2026 World Economic Outlook, the spread runs from 1% in Thailand all the way up to 61.3% in Sudan. That single 60-percentage-point gap captures almost everything that matters about labour markets: conflict, informal employment, structural inequality, demographic pressure, and how tight the job market is in practice.
Across the 107 economies the IMF tracks, 52 sit below 5% — a surprisingly tight club. The median 2026 projection is 5%, right where most advanced economies cluster. But the tails are where the stories live: Sudan’s wartime collapse, South Africa’s three-decade structural unemployment, the persistent single-digit floor in East and Southeast Asia.
Interactive World Unemployment Map
Hover over any country to see its 2026 unemployment projection. The map covers the 94 IMF-tracked economies with an ISO-A2 match — countries rendered in the neutral beige are either not tracked by the IMF (most of sub-Saharan Africa, several Gulf states) or mapped under a small-economy aggregate.
How the IMF Measures Unemployment
The IMF’s LUR (Labor Force, Unemployment Rate) series aggregates national labour-force surveys using ILO definitions: a person is unemployed if they are without work, actively seeking work, and currently available to take a job. The headline rate is the number of unemployed people as a share of the total labour force — so it excludes children, retirees, students, full-time carers, and anyone who has stopped looking.
That framing matters. It means the headline number is best read as a measure of labour-market slack, not of work itself. A country with widespread informal employment (street vendors, subsistence agriculture, undeclared services) will show a very low unemployment rate even when many of those jobs pay poverty wages. Thailand’s 1% is not wealth; it’s a reflection of how unemployment is counted.
The 10 Countries with the Highest Unemployment in 2026
The top of the table is dominated by three stories: war (Sudan), chronic structural unemployment (South Africa), and smaller economies with heavy demographic or regional pressures (Jordan, Georgia, Armenia, Bosnia, North Macedonia).
| Rank | Country | Unemployment Rate (2026) |
|---|---|---|
| 1 | 🇸🇩 Sudan | 61.3% |
| 2 | 🇿🇦 South Africa | 32.5% |
| 3 | 🇯🇴 Jordan | 21.3% |
| 4 | 🇬🇪 Georgia | 13.9% |
| 5 | 🇦🇲 Armenia | 12.8% |
| 6 | 🇧🇦 Bosnia and Herzegovina | 12.6% |
| 7 | 🇲🇦 Morocco | 12.2% |
| 8 | 🇲🇰 North Macedonia | 11.5% |
| 9 | 🇵🇦 Panama | 10.4% |
| 10 | 🇺🇦 Ukraine | 10.2% |
Sudan’s 61.3% is the most extreme figure in the entire dataset — nearly double the next worst, and more than ten times the global median. The jump is almost entirely war-driven: the civil conflict that began in 2023 has shuttered manufacturing in Khartoum, collapsed agricultural markets, and displaced millions. The IMF’s own projection acknowledges enormous uncertainty around the number; the direction of travel, however, is unambiguous.
South Africa at 32.5% is the structural case. Unlike Sudan, the South African rate has sat above 25% for most of the past decade — a legacy of apartheid-era labour-market segmentation, underperforming public education, and an energy crisis that has throttled manufacturing investment. Youth unemployment (ages 15–24) is estimated at above 60%.
Below those two outliers, the list reads like a geography of middle-income stress: 🇯🇴 Jordan (21.3%) faces the combination of a refugee-driven population surge and a small private sector; 🇬🇪 Georgia (13.9%) and 🇦🇲 Armenia (12.8%) are still working through post-Soviet transition pressures compounded by regional war spillover. The surprise in the top 10 is 🇪🇸 Spain at 9.8% — the only Western European economy to make it. Spain’s persistent unemployment problem, rooted in dual labour markets and a thin vocational training pipeline, has proven remarkably resilient even through several cycles of European recovery.
The 10 Countries with the Lowest Unemployment in 2026
The bottom of the table is more varied than it looks. Some countries are at rock-bottom because their labour markets are genuinely tight (Singapore, Japan, South Korea, Switzerland). Others sit there because of statistical definition — informal and subsistence employment swallows whole categories of underemployment.
| Rank | Country | Unemployment Rate (2026) |
|---|---|---|
| 1 | 🇹🇭 Thailand | 1% |
| 2 | 🇦🇩 Andorra | 1.1% |
| 3 | 🇲🇴 Macao SAR (China) | 1.7% |
| 4 | 🇸🇬 Singapore | 2% |
| 5 | 🇻🇳 Vietnam | 2.1% |
| 6 | 🇷🇺 Russia | 2.4% |
| 7 | 🇯🇵 Japan | 2.5% |
| 8 | 🇸🇨 Seychelles | 2.6% |
| 9 | 🇧🇿 Belize | 2.6% |
| 10 | 🇳🇮 Nicaragua | 2.7% |
🇹🇭 Thailand’s 1.0% sits at the top — but almost nobody who studies Thai labour markets would call the economy near full employment. Roughly half of Thai workers are in informal employment, often self-employed in agriculture or the urban service sector, and the headline number undercounts underemployment. The same caveat applies to 🇻🇳 Vietnam (2.1%), 🇲🇽 Mexico (2.7%), and 🇳🇮 Nicaragua (2.7%).
The low figures that do reflect genuinely tight labour markets come from small, high-income economies: 🇦🇩 Andorra (1.1%), 🇲🇴 Macao (1.7%), 🇸🇬 Singapore (2.0%), and 🇨🇭 Switzerland (3.0%). All have demographic profiles skewed toward working-age populations, strong immigration controls, and service-dominated economies with few displaced industrial workers.
Regional Snapshot
🇪🇺 Europe
The European distribution is where the inequality between member states is most visible. 🇪🇸 Spain (9.8%), 🇫🇮 Finland (9.6%), 🇫🇷 France (7.9%), and 🇬🇷 Greece (7.4%) sit near the top of the developed world. At the other end, 🇩🇰 Denmark (2.9%), 🇨🇭 Switzerland (3.0%), and 🇩🇪 Germany (3.9%) are close to full employment. The gap between Spanish and German rates is the largest it has been since the eurozone debt crisis.
🕌 Middle East & North Africa
🇯🇴 Jordan (21.3%) and 🇲🇦 Morocco (12.2%) lead the region. 🇮🇷 Iran (9.2%) is moderate by regional standards; 🇪🇬 Egypt (7.4%) reports a relatively tight figure despite widespread underemployment. The Gulf states (UAE, Qatar, Saudi Arabia) show very low rates, but these are distorted by the exclusion of non-national workers from many labour-force definitions.
🌏 Asia-Pacific
East Asia is the world’s tight-labour-market cluster: 🇯🇵 Japan (2.5%), 🇰🇷 South Korea (2.8%), 🇸🇬 Singapore (2.0%), 🇨🇳 China (5.1%). Southeast Asia shows the informal-economy effect — Thailand 1.0%, Vietnam 2.1%, the Philippines close behind. Australia (4.2%) and New Zealand round out the low-rate cluster.
🌍 Africa
Sub-Saharan Africa shows the widest within-region spread of any continent. 🇸🇩 Sudan (61.3%) and 🇿🇦 South Africa (32.5%) are the global outliers. Most other tracked African economies report single-digit or low-double-digit rates — but the IMF tracks relatively few of them, and informal employment is almost universally higher here than in any other region, so the headline numbers should be read with extra caution.
🌎 The Americas
The range in the Americas is narrower: 🇺🇸 United States (4.4%), 🇨🇦 Canada (6.5%), 🇧🇷 Brazil (6.8%), 🇨🇴 Colombia (9.0%). The standout is 🇵🇦 Panama (10.4%), whose canal-driven economy has been slowing on the back of reduced traffic and construction contraction. Central American economies (Mexico, Nicaragua, Guatemala) report unusually low rates again driven by large informal sectors.
Where the Rich-Country Divergence Lives
If there’s a headline story in the advanced-economy figures, it’s this: the US has quietly moved below most of Western Europe. The American 4.4% projection is below the UK’s 5.6%, Italy’s 6.0%, France’s 7.9%, Finland’s 9.6%, and Spain’s 9.8%. That isn’t primarily an American success story — US labour-force participation has declined over the same period — but it is a stark gap that shapes immigration politics, wage dynamics, and trans-Atlantic comparisons of “economic health”.
Germany at 3.9% is the exception that proves the European rule. Nearly every other major European economy has a structurally higher rate — a product of more rigid labour protections, weaker regional mobility, and, for Spain and Finland particularly, sectoral concentration in industries (construction, forestry, tourism) that are exposed to demand shocks.
Methodology & Data Caveats
- Not every country is tracked. The IMF projects 2026 unemployment for 107 economies. Notable absences include several Gulf states where the national/non-national distinction blurs labour-force counts, and many small African economies where survey infrastructure is limited.
- The informal economy is invisible here. Countries with large informal sectors (Thailand, Vietnam, Mexico, most of sub-Saharan Africa) report low unemployment because informal workers are classified as employed. The headline rate says nothing about the quality or stability of work.
- Projections, not outcomes. The April 2026 WEO is a forecast. Countries in crisis (Sudan, Ukraine) carry the widest uncertainty bands. The October 2026 WEO update will revise.
- Definitions vary. Most tracked countries use ILO-consistent definitions, but national statistical offices sometimes deviate (notably around whether discouraged workers are counted). Year-on-year changes within a country are more reliable than between-country comparisons.
The Bottom Line on Global Joblessness in 2026
The median projection — 5% across 107 economies — is the closest thing to a “world unemployment rate” that exists in public data. But the number that matters more is the spread: 60 percentage points between the highest and lowest, with war, structural inequality, and informal-economy statistical effects accounting for almost all of the gap. Most countries cluster between 3% and 8%. The outliers are where the interesting policy questions live.
For a reader looking to understand labour markets in 2026, the practical takeaway is that headline unemployment rates are a signal, not a measurement. Combined with labour-force participation, youth unemployment, and informal-sector estimates, they form a genuine picture. In isolation, they flatter some economies and unfairly punish others.
All 107 Economies — Searchable Ranking
The full IMF WEO April 2026 unemployment projections for every economy the IMF tracks, sortable by rank, country, or rate. Type in the search box to filter — e.g. “Europe” doesn’t work (not a country) but “Spain” or “Nigeria” does.
| Rank | Country | Unemployment Rate (%) |
|---|---|---|
| 1 | Sudan | 61.3% |
| 2 | South Africa | 32.5% |
| 3 | Jordan | 21.3% |
| 4 | Georgia | 13.9% |
| 5 | Armenia | 12.8% |
| 6 | Bosnia and Herzegovina | 12.6% |
| 7 | Morocco | 12.2% |
| 8 | North Macedonia | 11.5% |
| 9 | Panama | 10.4% |
| 10 | Ukraine | 10.2% |
| 11 | Spain | 9.8% |
| 12 | Finland | 9.6% |
| 13 | The Bahamas | 9.4% |
| 14 | Iran | 9.2% |
| 15 | Colombia | 9% |
| 16 | Suriname | 9% |
| 17 | Serbia | 8.8% |
| 18 | Albania | 8.7% |
| 19 | Sweden | 8.6% |
| 20 | Cabo Verde | 8.5% |
| 21 | Türkiye | 8.3% |
| 22 | Chile | 8.1% |
| 23 | Uruguay | 8% |
| 24 | France | 7.9% |
| 25 | Egypt | 7.4% |
| 26 | Greece | 7.4% |
| 27 | Estonia | 7.3% |
| 28 | Argentina | 7.2% |
| 29 | Costa Rica | 7% |
| 30 | Pakistan | 6.9% |
| 31 | Barbados | 6.8% |
| 32 | Brazil | 6.8% |
| 33 | Honduras | 6.8% |
| 34 | Latvia | 6.7% |
| 35 | Canada | 6.5% |
| 36 | Lithuania | 6.5% |
| 37 | Peru | 6.3% |
| 38 | Belgium | 6.2% |
| 39 | EURO | 6.2% |
| 40 | Italy | 6% |
| 41 | Puerto Rico | 6% |
| 42 | Romania | 6% |
| 43 | Luxembourg | 5.9% |
| 44 | Mauritius | 5.9% |
| 45 | Portugal | 5.9% |
| 46 | Slovak Republic | 5.8% |
| 47 | Austria | 5.7% |
| 48 | United Kingdom | 5.6% |
| 49 | New Zealand | 5.4% |
| 50 | Azerbaijan | 5.3% |
| 51 | Dominican Republic | 5.3% |
| 52 | Paraguay | 5.2% |
| 53 | China | 5.1% |
| 54 | Fiji | 5% |
| 55 | Mongolia | 5% |
| 56 | India | 4.9% |
| 57 | Indonesia | 4.9% |
| 58 | Ireland | 4.8% |
| 59 | ADVEC | 4.8% |
| 60 | Brunei Darussalam | 4.7% |
| 61 | Philippines | 4.7% |
| 62 | Croatia | 4.6% |
| 63 | Cyprus | 4.6% |
| 64 | Kazakhstan | 4.6% |
| 65 | MAE | 4.6% |
| 66 | Bolivia | 4.5% |
| 67 | San Marino | 4.4% |
| 68 | United States | 4.4% |
| 69 | Aruba | 4.3% |
| 70 | El Salvador | 4.3% |
| 71 | Uzbekistan | 4.3% |
| 72 | Australia | 4.2% |
| 73 | Hungary | 4.2% |
| 74 | Iceland | 4.2% |
| 75 | Norway | 4.2% |
| 76 | Trinidad and Tobago | 4.2% |
| 77 | Netherlands | 4.1% |
| 78 | Kyrgyz Republic | 4% |
| 79 | Germany | 3.9% |
| 80 | Slovenia | 3.9% |
| 81 | Liechtenstein | 3.9% |
| 82 | Moldova | 3.8% |
| 83 | OAE | 3.6% |
| 84 | Bulgaria | 3.4% |
| 85 | Poland | 3.4% |
| 86 | Taiwan Province of China | 3.4% |
| 87 | Hong Kong SAR | 3.3% |
| 88 | Israel | 3.2% |
| 89 | Ecuador | 3.1% |
| 90 | Czech Republic | 3% |
| 91 | Malaysia | 3% |
| 92 | Malta | 3% |
| 93 | Switzerland | 3% |
| 94 | Belarus | 2.9% |
| 95 | Denmark | 2.9% |
| 96 | South Korea | 2.8% |
| 97 | Mexico | 2.7% |
| 98 | Nicaragua | 2.7% |
| 99 | Belize | 2.6% |
| 100 | Seychelles | 2.6% |
| 101 | Japan | 2.5% |
| 102 | Russia | 2.4% |
| 103 | Vietnam | 2.1% |
| 104 | Singapore | 2% |
| 105 | Macao SAR (China) | 1.7% |
| 106 | Andorra | 1.1% |
| 107 | Thailand | 1% |
Unemployment figures are drawn from the IMF's World Economic Outlook April 2026 database (LUR series), which aggregates national labour-force surveys. Where the IMF doesn't track a country, no projection is shown.