Key Takeaways
- The great central-bank divergence. The synchronized global easing cycle of 2024–25 is over. In 2026 the world's monetary map has split: a few central banks are hiking again, most of the big ones are on hold with a hawkish tilt, and only a handful are still cutting.
- A divided Fed on hold. On 29 July 2026 the Federal Reserve held its policy rate at 3.50–3.75% on a 9–3 vote. Three regional presidents (Hammack, Kashkari and Logan) dissented, wanting a hike, with inflation running above the 2% target for a fifth straight year.
- The BoE has stopped cutting too. The Bank of England held at 3.75% on 31 July and meets again on 7 August. After easing through 2024–25, its next move is now widely expected to be up, not down, with forecasters penciling in a peak around 4.25%.
- Some are already tightening. The ECB reversed course and raised its deposit rate in June, the Bank of Japan has hiked to 1.00%, and Norway's Norges Bank is in outright hiking mode. That group of tighteners barely existed a year ago.
- The high-rate world is elsewhere. The steepest rates sit in emerging markets fighting inflation or currency pressure: Turkey at 37%, Argentina 29%, Nigeria 26.5%, Russia and Brazil around 14%. Their easing has slowed to a near-standstill.
For most of 2024 and 2025 the world’s central banks moved together, cutting interest rates in near-unison as pandemic-era inflation faded. That era is over. In 2026 the map of global interest rates has fractured into a patchwork of banks hiking, holding and cutting all at once, a split now widely called the great central-bank divergence. The map below shows where every country’s policy rate stands today.
The world’s interest rates, mapped
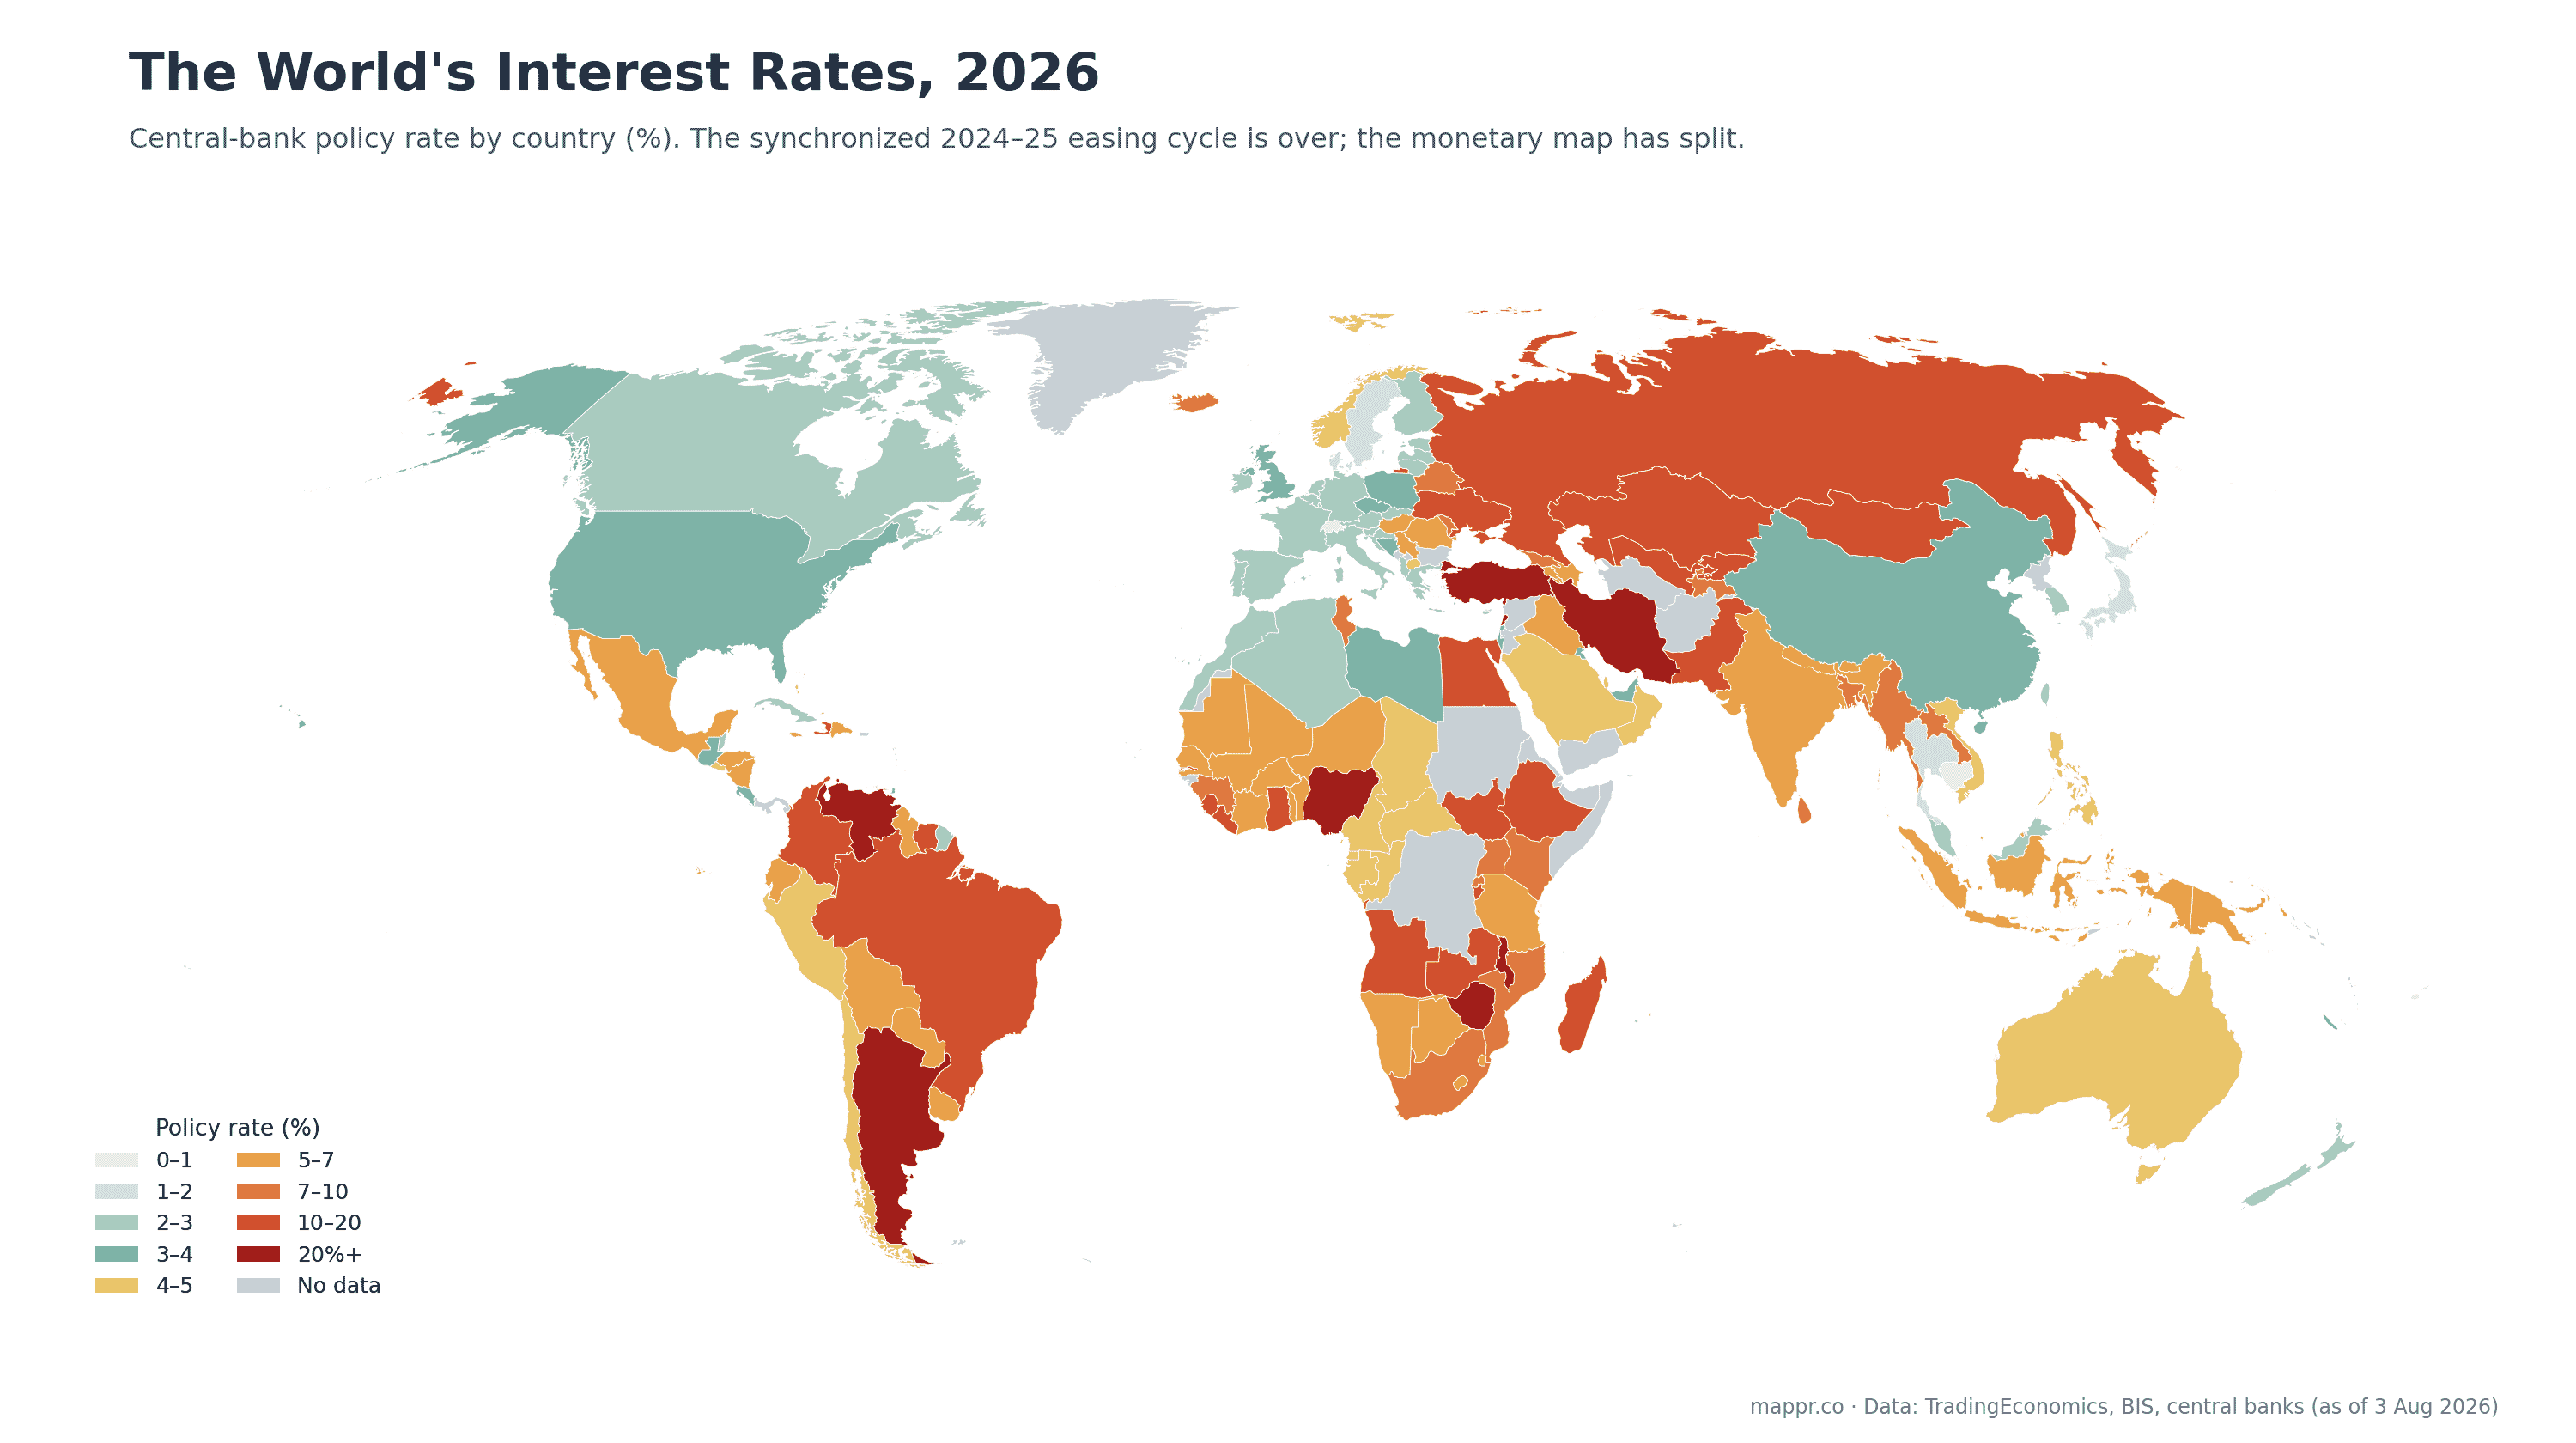
Read as a level map, the pattern is stark. The low-rate world clusters in the advanced economies of Europe and East Asia: Switzerland sits at 0%, Japan at 1%, the euro area near 2%, and Canada and New Zealand around 2.25%. A middle band of 3–5% now holds the big Anglophone economies, the United States, United Kingdom and Australia among them.
The high-rate world is almost entirely emerging markets wrestling with inflation or weak currencies. Turkey’s 37% is in a class of its own, followed by Argentina (29%), Nigeria (26.5%), and Russia and Brazil in the mid-teens. For those economies a high policy rate is less a choice than a defense.
Who is moving which way
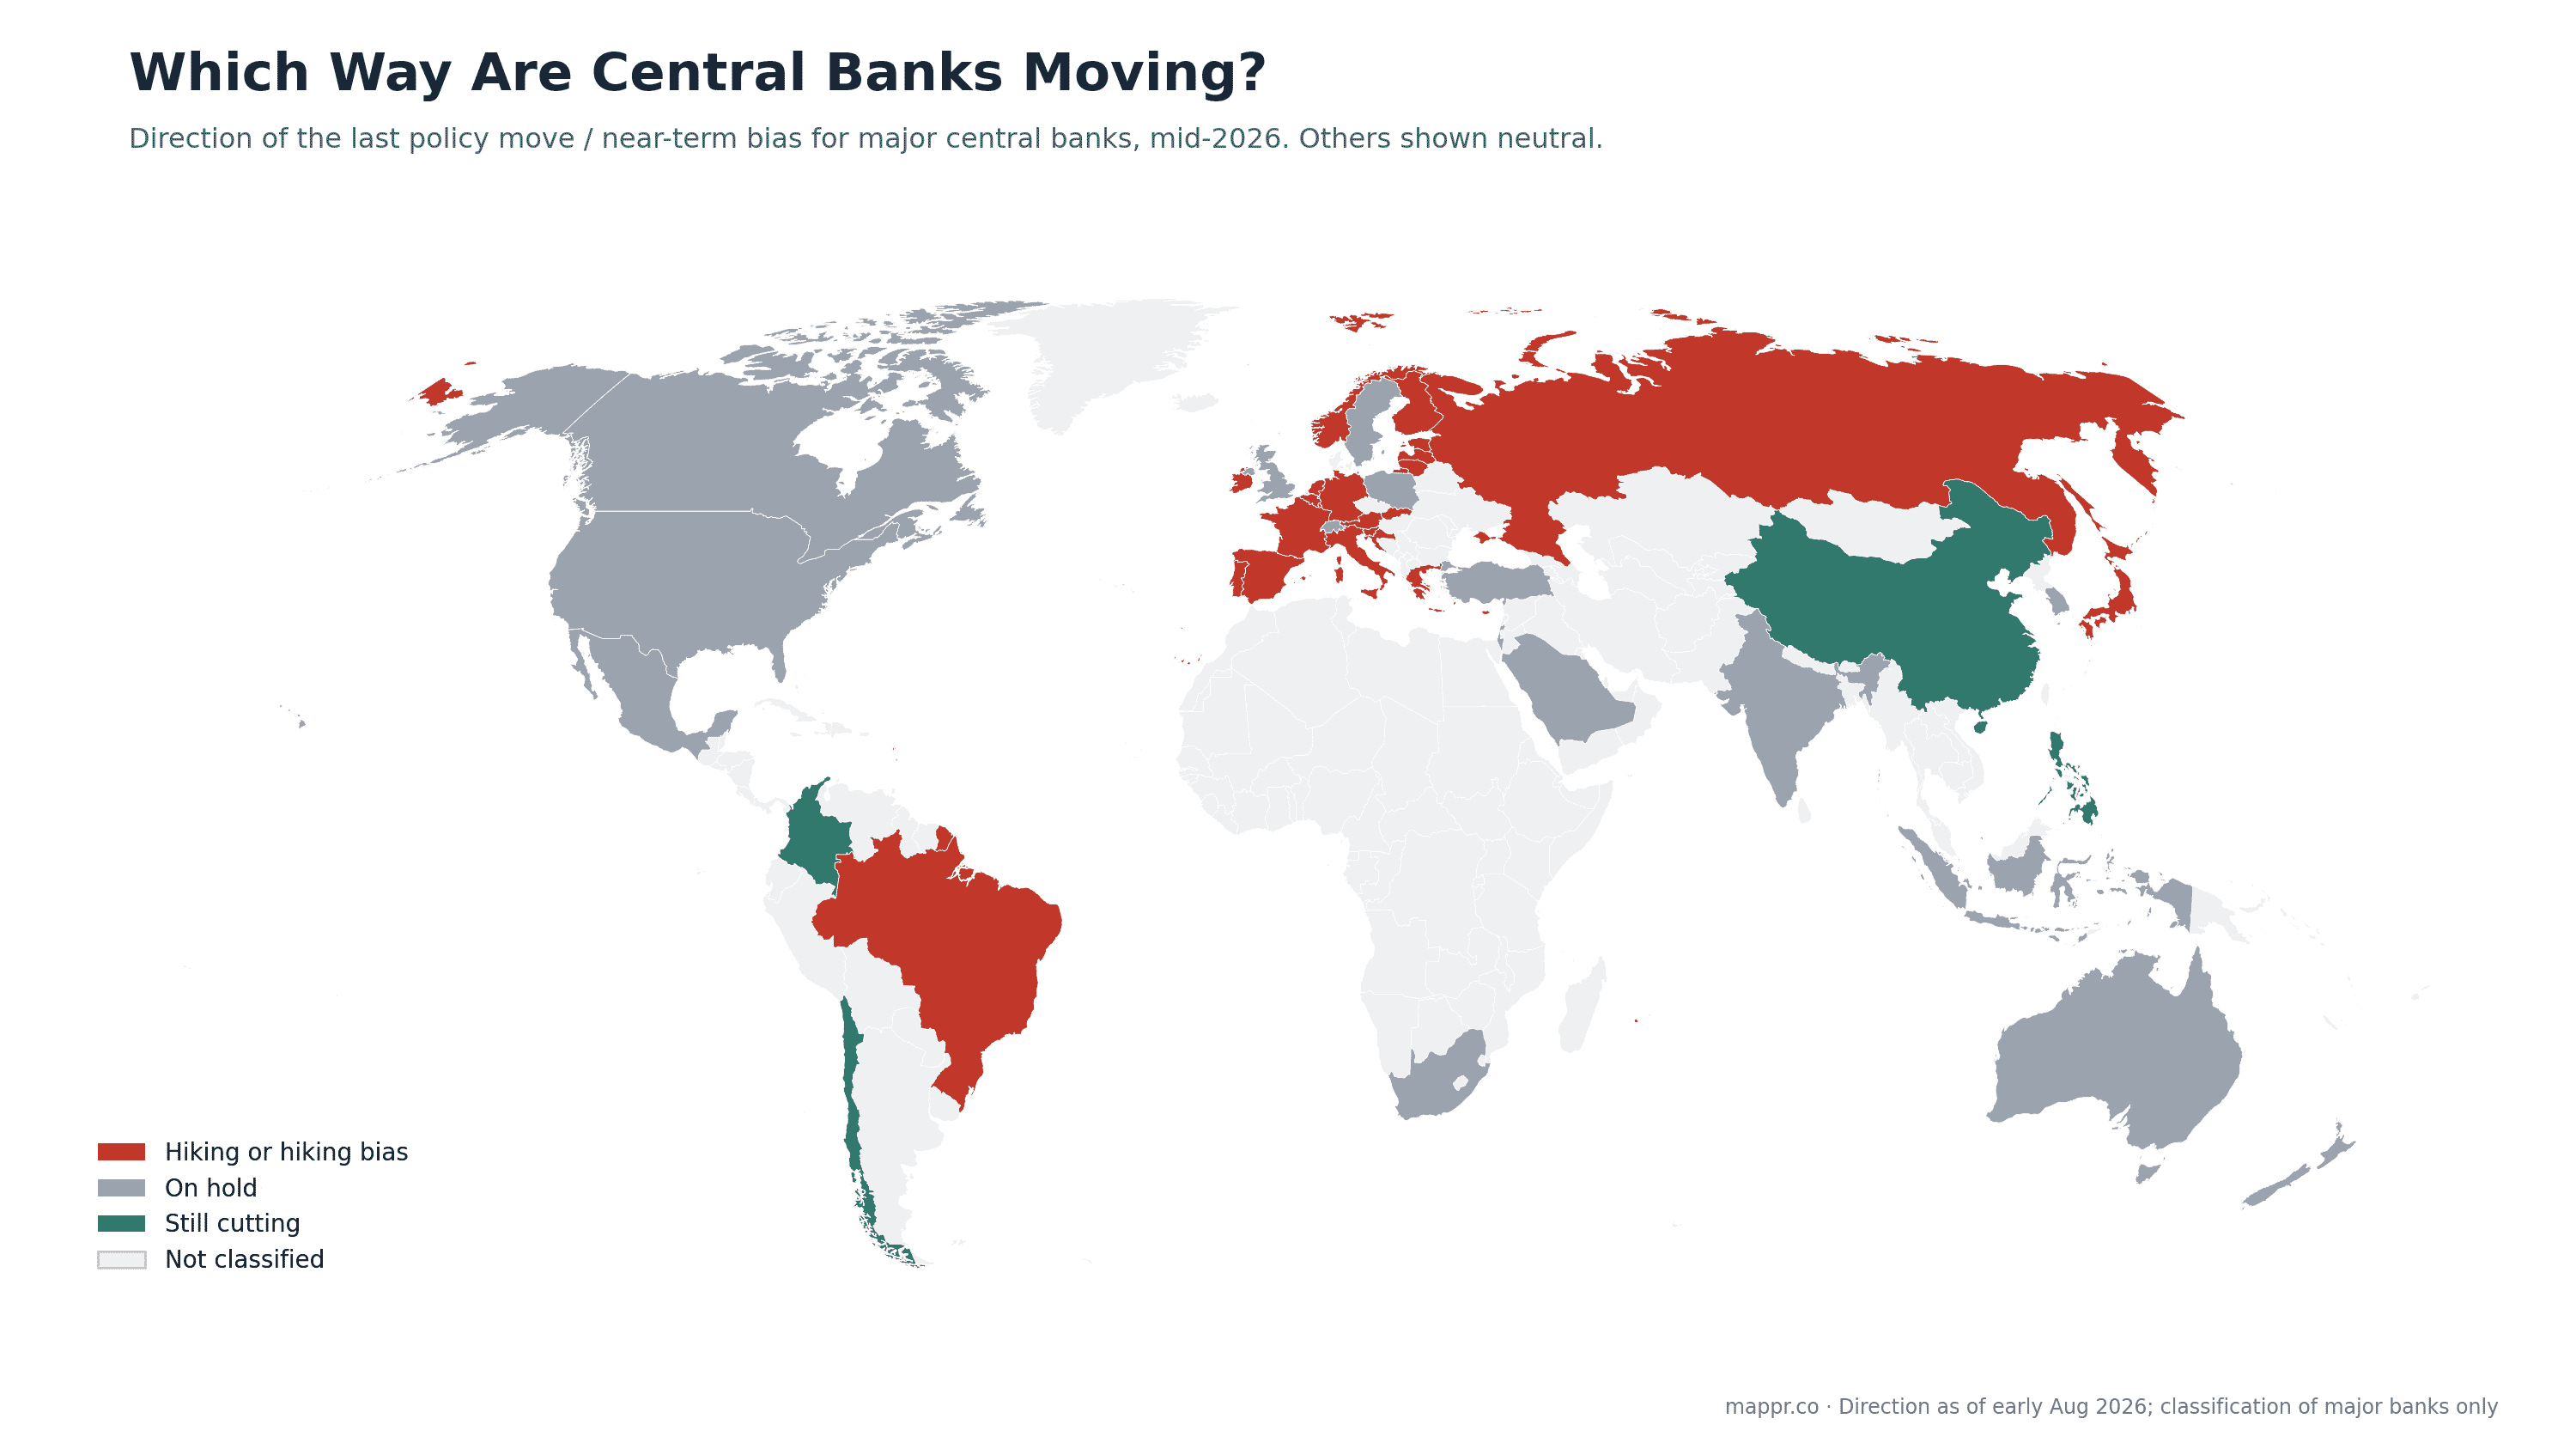
A level map only tells you where rates are, not where they are going. Grouped by direction, the divergence is clearer still. A small but growing club is tightening again: the ECB lifted its deposit rate in June, the Bank of Japan has hiked to 1%, and Norway’s Norges Bank moved up in the spring. A much larger group, including the Fed and the Bank of England, is on hold but leaning hawkish, its members openly debating the next hike rather than the next cut. Only a handful, China and a few Latin American central banks among them, are still cutting.
Who moved this week
The G10, diverging
Where the major central banks stand
Policy rate, most recent move and near-term bias for the G10 central banks, early August 2026.
| Central bank | Policy rate | Last move | Bias |
|---|---|---|---|
| 🇺🇸 United States (Fed) | 3.50–3.75% | Held 29 Jul (9–3) | On hold, hawkish |
| 🇪🇺 Euro area (ECB) | 2.15% | Hiked in June | Tightening |
| 🇬🇧 United Kingdom (BoE) | 3.75% | Held 31 Jul | On hold, hawkish |
| 🇯🇵 Japan (BoJ) | 1.00% | Hiked | Hiking |
| 🇨🇦 Canada (BoC) | 2.25% | Held | On hold |
| 🇦🇺 Australia (RBA) | 4.35% | Held | On hold |
| 🇨🇭 Switzerland (SNB) | 0.00% | Held | On hold |
| 🇸🇪 Sweden (Riksbank) | 1.75% | Held | On hold |
| 🇳🇴 Norway (Norges Bank) | 4.25% | Hiked in May | Hiking bias |
| 🇳🇿 New Zealand (RBNZ) | 2.25% | Held | On hold |
Why the map split
The synchronized easing of 2024–25 worked while every economy faced the same problem: falling inflation and slowing growth. In 2026 the problems stopped rhyming. Renewed energy-price pressure, tied in part to Middle East conflict, has pushed inflation back up in Europe and kept it sticky in the United States and Britain, where it has now run above target for years. That has emboldened the hawks and stalled the cutters.
Emerging markets, meanwhile, never got to relax. Central banks from Ankara to Brasília are holding rates high to defend their currencies and anchor expectations, and even small cuts risk capital flight. The result is the fractured map above: not a single global cycle, but dozens of local ones pulling in different directions.
The immediate signpost is the Bank of England on 7 August, followed by the next meetings of the Fed, ECB and Bank of Japan. Each one is a chance for the map to shift again. For the wider fiscal picture behind these decisions, see our maps of public debt by country and government revenue as a share of GDP. We’ll keep this page updated as the world’s central banks move.