Key Takeaways
- Switzerland is #1 for the 16th year in a row. It scores 66.7 on WIPO's 139-economy index, ahead of Sweden (63.2) and the United States (62.3). South Korea (#4) is Asia's best.
- China is the only middle-income economy in the top 10. At #10, China has broken through the 'innovation glass ceiling', reaching high-income levels on 21 of 25 convergence indicators.
- AI is driving a global R&D rebound. Corporate R&D hit a record ~US$1.5 trillion in 2025 (+5.8% in real terms), and AI took 53% of global venture capital deal value in 2025, rising to 77% in early 2026.
- The climbers keep climbing. India (38th), Viet Nam (43rd), Türkiye (45th), the Philippines (52nd), Morocco (54th, its best ever) and Indonesia (55th) lead the decade's rise of middle-income innovators.
The World Intellectual Property Organization released its Global Innovation Index 2026 on September 29, ranking 139 economies on 79 indicators across seven pillars, from institutions and human capital to knowledge and creative outputs. The headline is continuity at the top and churn underneath.
Switzerland is the world’s most innovative economy for the 16th consecutive year, and the podium (Switzerland, Sweden, United States) is unchanged. The more interesting stories are an AI-fuelled rebound in global R&D spending, China’s consolidation inside the top 10, and a widening gap between the middle-income climbers and the research-heavy frontier.
The Map: Innovation Scores Across 139 Economies
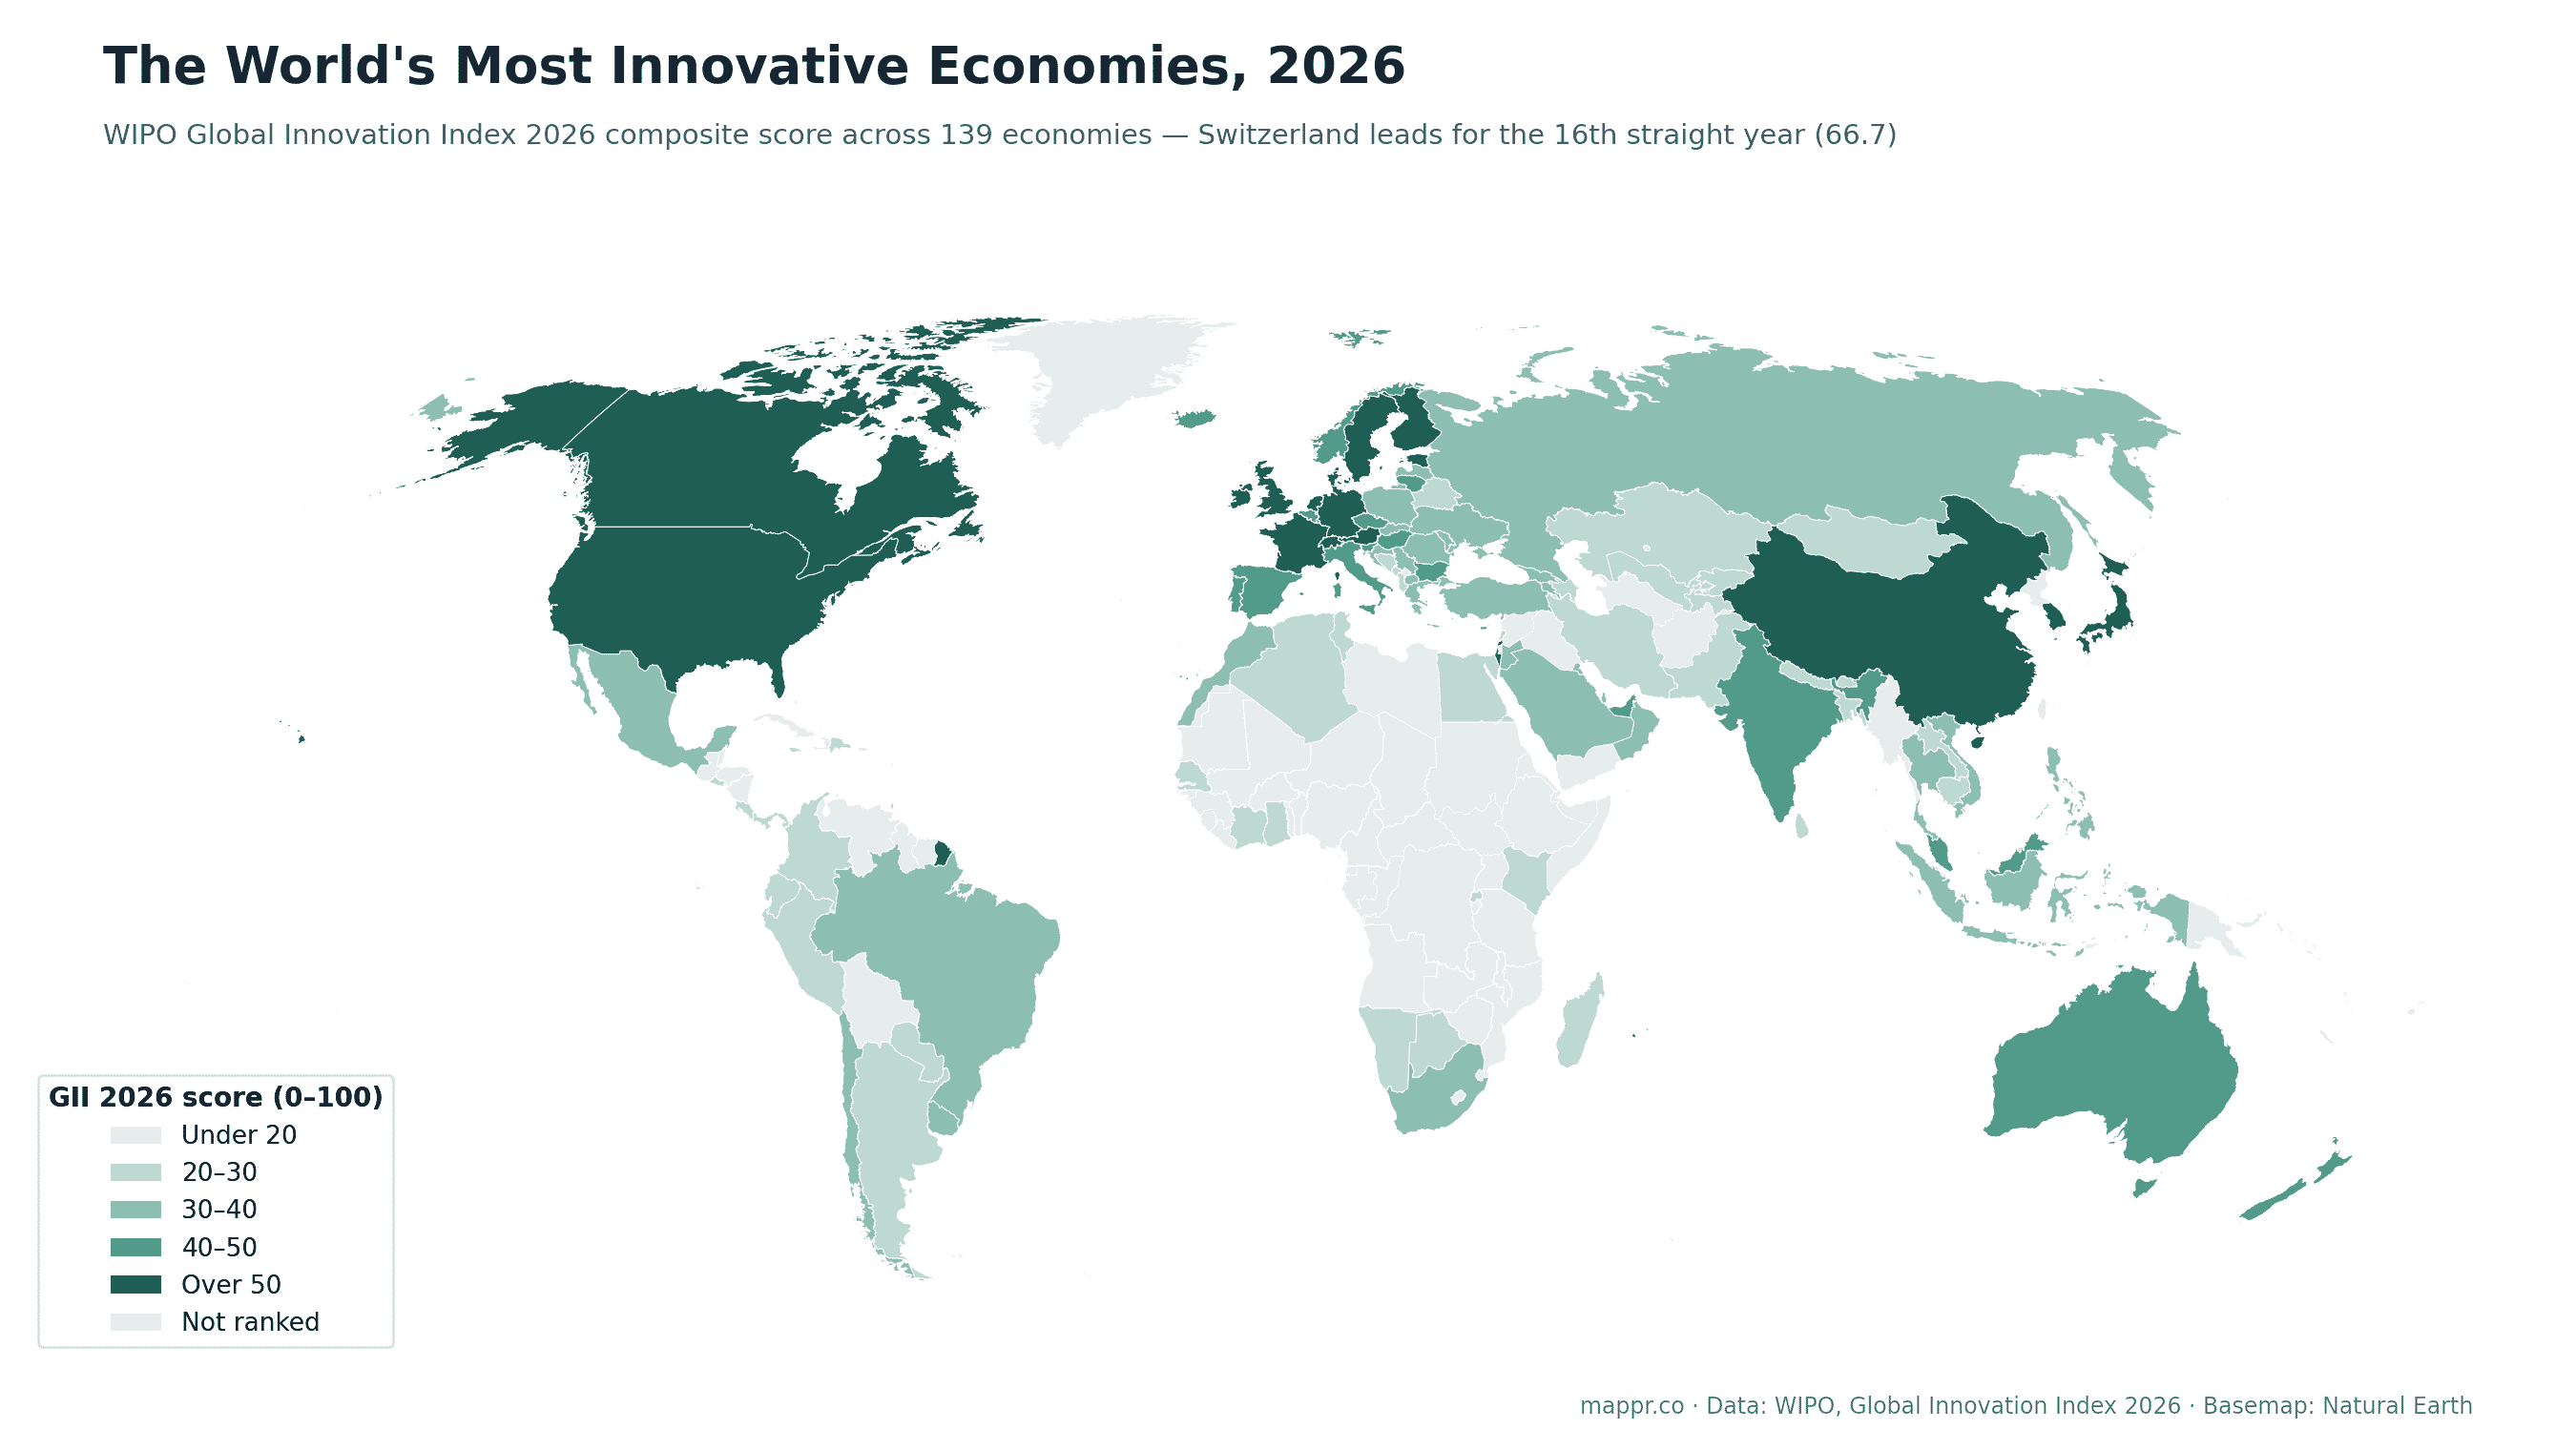
The geography is stark. Every economy scoring above 50 sits in Western Europe, North America or East Asia, with Israel and the Gulf’s best performer (the UAE, #25) the only entrants from the wider Middle East. Sub-Saharan Africa’s strongest performers are South Africa and Mauritius, with Rwanda leading the low-income group, while Chad (9.5) closes the table.
The Leaderboard
Ranked
GII 2026: top 25 and the notable climbers
WIPO’s composite innovation score (0-100) across seven pillars. The climbers section lists the decade’s standout middle-income risers.
| Economy | Rank | Score | Note |
|---|---|---|---|
| 🇨🇭 Switzerland | 1 | 66.7 | 16th consecutive year at #1 |
| 🇸🇪 Sweden | 2 | 63.2 | |
| 🇺🇸 United States | 3 | 62.3 | |
| 🇰🇷 South Korea | 4 | 61.4 | Best in Asia |
| 🇸🇬 Singapore | 5 | 61.0 | |
| 🇬🇧 United Kingdom | 6 | 59.6 | |
| 🇳🇱 Netherlands | 7 | 58.4 | |
| 🇫🇮 Finland | 8 | 57.9 | |
| 🇩🇰 Denmark | 9 | 57.7 | |
| 🇨🇳 China | 10 | 57.0 | Only middle-income economy in the top 10 |
| 🇩🇪 Germany | 11 | 56.8 | Just outside the top 10 |
| 🇯🇵 Japan | 12 | 54.1 | |
| 🇫🇷 France | 13 | 54.0 | |
| 🇭🇰 Hong Kong | 14 | 53.2 | Top-ranked economy cluster with Shenzhen in S&T |
| 🇮🇱 Israel | 15 | 52.2 | |
| 🇨🇦 Canada | 16 | 51.1 | |
| 🇪🇪 Estonia | 17 | 50.4 | Top Baltic performer |
| 🇦🇹 Austria | 18 | 50.2 | |
| 🇮🇪 Ireland | 19 | 50.1 | |
| 🇦🇺 Australia | 20 | 49.6 | |
| 🇳🇴 Norway | 21 | 48.5 | |
| 🇧🇪 Belgium | 22 | 48.5 | |
| 🇱🇺 Luxembourg | 23 | 46.6 | |
| 🇳🇿 New Zealand | 24 | 46.4 | |
| 🇦🇪 United Arab Emirates | 25 | 46.4 | Best in the Arab world |
| 🇮🇳 India | 38 | 40.1 | Leading middle-income innovator; strongest in digital services and VC |
| 🇻🇳 Viet Nam | 43 | 37.7 | Up from 76th in 2013 |
| 🇹🇷 Türkiye | 45 | 37.5 | Long-term climber |
| 🇵🇭 Philippines | 52 | 33.8 | Production and trade powerhouse |
| 🇲🇦 Morocco | 54 | 32.8 | Best-ever ranking |
| 🇮🇩 Indonesia | 55 | 32.7 | Long-term climber |
AI Is Paying the R&D Bill
WIPO’s framing for 2026 is a rebound with a single engine. Corporate R&D among the world’s biggest spenders reached a record ~US$1.5 trillion in 2025, up 5.8% in real terms, driven overwhelmingly by software- and AI-intensive companies (with aerospace and defence also surging). Venture capital rose 28% to US$510 billion, and AI alone took 53% of global VC deal value in 2025, climbing to 77% in the first half of 2026.
That concentration cuts both ways: innovation finance is flowing again, but it is flowing into fewer sectors and fewer places than at any point in the last decade.
China, the Glass Ceiling, and the Climbers
WIPO devotes much of the 2026 edition to what it calls the innovation glass ceiling: middle-income economies converge easily on startup finance, production, exports and IP filings, but almost never on the slow-building research base: R&D systems, researchers, scientific output. China is the exception that defines the rule, having reached high-income levels on 21 of 25 indicators, which is why it sits in the top 10 while every other climber remains outside the top 30.
Behind it, the familiar cohort keeps rising: India (38th) on digital services and venture capital, Viet Nam (43rd, up from 76th in 2013) and the Philippines (52nd) on production and trade, Morocco (54th) at its best-ever position, and Indonesia (55th). Milestone watch: Portugal, Latvia, Kuwait and Costa Rica all hit record rankings, and Bhutan joins the index for the first time.
How to Read the Index
The GII is a composite: it rewards balanced systems, not single strengths. An economy can lead the world in one pillar and still rank mid-table overall. It also measures innovation capacity and output, not patents alone; our separate patent filings map covers that narrower axis, and the two make an instructive pair: several high-patent economies rank far lower here once institutions, education and creative outputs enter the equation.
The Full 2026 Ranking: All 139 Economies
The complete WIPO Global Innovation Index 2026 ranking, sortable and searchable. Scores are on a 0-100 scale.
| Rank | Economy | GII 2026 score |
|---|---|---|
| 1 | Switzerland | 66.7 |
| 2 | Sweden | 63.2 |
| 3 | United States | 62.3 |
| 4 | South Korea | 61.4 |
| 5 | Singapore | 61.0 |
| 6 | United Kingdom | 59.6 |
| 7 | Netherlands | 58.4 |
| 8 | Finland | 57.9 |
| 9 | Denmark | 57.7 |
| 10 | China | 57.0 |
| 11 | Germany | 56.8 |
| 12 | Japan | 54.1 |
| 13 | France | 54.0 |
| 14 | Hong Kong | 53.2 |
| 15 | Israel | 52.2 |
| 16 | Canada | 51.1 |
| 17 | Estonia | 50.4 |
| 18 | Austria | 50.2 |
| 19 | Ireland | 50.1 |
| 20 | Australia | 49.6 |
| 21 | Norway | 48.5 |
| 22 | Belgium | 48.5 |
| 23 | Luxembourg | 46.6 |
| 24 | New Zealand | 46.4 |
| 25 | United Arab Emirates | 46.4 |
| 26 | Iceland | 46.3 |
| 27 | Italy | 46.2 |
| 28 | Spain | 45.4 |
| 29 | Cyprus | 45.3 |
| 30 | Portugal | 44.5 |
| 31 | Malta | 43.8 |
| 32 | Lithuania | 43.2 |
| 33 | Czech Republic | 42.8 |
| 34 | Malaysia | 41.8 |
| 35 | Slovenia | 41.1 |
| 36 | Hungary | 40.7 |
| 37 | Bulgaria | 40.3 |
| 38 | India | 40.1 |
| 39 | Poland | 39.5 |
| 40 | Latvia | 38.3 |
| 41 | Greece | 38.2 |
| 42 | Saudi Arabia | 37.9 |
| 43 | Viet Nam | 37.7 |
| 44 | Thailand | 37.6 |
| 45 | Türkiye | 37.5 |
| 46 | Croatia | 36.9 |
| 47 | Qatar | 36.6 |
| 48 | Slovakia | 36.5 |
| 49 | Romania | 35.3 |
| 50 | Mauritius | 34.1 |
| 51 | Chile | 33.8 |
| 52 | Philippines | 33.8 |
| 53 | Brazil | 33.5 |
| 54 | Morocco | 32.8 |
| 55 | Indonesia | 32.7 |
| 56 | Serbia | 32.5 |
| 57 | Georgia | 32.2 |
| 58 | Russia | 31.8 |
| 59 | Armenia | 31.6 |
| 60 | Jordan | 31.5 |
| 61 | North Macedonia | 31.2 |
| 62 | Kuwait | 30.9 |
| 63 | South Africa | 30.9 |
| 64 | Bahrain | 30.8 |
| 65 | Mexico | 30.6 |
| 66 | Uruguay | 30.5 |
| 67 | Ukraine | 30.4 |
| 68 | Moldova | 30.3 |
| 69 | Oman | 30.0 |
| 70 | Costa Rica | 29.8 |
| 71 | Tunisia | 29.3 |
| 72 | Mongolia | 29.1 |
| 73 | Kazakhstan | 29.1 |
| 74 | Bhutan | 28.9 |
| 75 | Argentina | 28.8 |
| 76 | Montenegro | 28.8 |
| 77 | Uzbekistan | 28.7 |
| 78 | Colombia | 28.6 |
| 79 | Albania | 28.3 |
| 80 | Peru | 27.9 |
| 81 | Iran | 27.6 |
| 82 | Botswana | 27.1 |
| 83 | Egypt | 26.1 |
| 84 | Bosnia and Herzegovina | 26.1 |
| 85 | Azerbaijan | 25.8 |
| 86 | Lebanon | 25.6 |
| 87 | Jamaica | 24.9 |
| 88 | Belarus | 24.5 |
| 89 | Panama | 24.4 |
| 90 | Senegal | 24.4 |
| 91 | Barbados | 24.2 |
| 92 | Kyrgyzstan | 24.1 |
| 93 | Cambodia | 23.8 |
| 94 | Sri Lanka | 23.7 |
| 95 | Pakistan | 23.7 |
| 96 | Rwanda | 23.3 |
| 97 | Kenya | 23.0 |
| 98 | Brunei | 23.0 |
| 99 | Dominican Republic | 22.9 |
| 100 | El Salvador | 22.8 |
| 101 | Ghana | 22.6 |
| 102 | Namibia | 22.5 |
| 103 | Cabo Verde | 22.4 |
| 104 | Nepal | 22.3 |
| 105 | Bangladesh | 21.5 |
| 106 | Ecuador | 21.3 |
| 107 | Trinidad and Tobago | 21.2 |
| 108 | Laos | 21.2 |
| 109 | Paraguay | 21.1 |
| 110 | Côte d'Ivoire | 20.8 |
| 111 | Algeria | 20.5 |
| 112 | Tajikistan | 20.3 |
| 113 | Madagascar | 20.2 |
| 114 | Bolivia | 19.7 |
| 115 | Zambia | 19.5 |
| 116 | Honduras | 19.2 |
| 117 | Benin | 19.1 |
| 118 | Nigeria | 19.1 |
| 119 | Tanzania | 19.0 |
| 120 | Guatemala | 19.0 |
| 121 | Cameroon | 18.9 |
| 122 | Togo | 18.7 |
| 123 | Uganda | 18.4 |
| 124 | Nicaragua | 18.0 |
| 125 | Myanmar | 17.4 |
| 126 | Malawi | 17.2 |
| 127 | Venezuela | 16.7 |
| 128 | Lesotho | 16.5 |
| 129 | Mozambique | 16.1 |
| 130 | Burkina Faso | 16.1 |
| 131 | Mauritania | 16.1 |
| 132 | Zimbabwe | 16.1 |
| 133 | Ethiopia | 15.7 |
| 134 | Mali | 15.2 |
| 135 | Burundi | 15.1 |
| 136 | Angola | 13.0 |
| 137 | DR Congo | 12.6 |
| 138 | Niger | 12.1 |
| 139 | Chad | 9.5 |
Data and reporting for this article come from the following sources: