Key Takeaways
- Indonesia's president apologised to Singapore and Malaysia for the haze. At the ASEAN summit in Manila, Prabowo Subianto apologised for nearly four months of cross-border smoke, while adding that it was not Indonesia's fault.
- This was Indonesia's worst fire season since 2015. NASA satellites recorded 585,000 fire detections over Indonesia from July to October, 65% more than in 2019 but still 25% fewer than in the catastrophic 2015 season.
- Borneo was the epicentre, with Papua close behind. Indonesian Borneo (Kalimantan) accounted for more than half of all detections. Central Kalimantan alone had 28%. Papua and South Sumatra followed.
- An estimated 2.88 million hectares burned, far above official figures. Independent monitor Nusantara Atlas estimates about 2.9 million hectares burned from January to October, a conservative figure. The government's last official estimate, from July, was 202,000 hectares.
“I would like to apologise to my neighbouring countries Malaysia and Singapore.” With those words at the ASEAN summit in Manila on 16 November, Indonesian President Prabowo Subianto acknowledged what millions of people across the region had breathed for months: smoke from Indonesia‘s fires. “It is not our fault,” he added, “but once again we apologise.”
Recent rain has finally damped the fires, and regional forecasters have lifted the transboundary haze warning. We used NASA satellite data to map the whole season: where the fires burned, how 2026 compares with past disasters, and how the smoke reached Singapore and Malaysia.
The Map: Four Months of Fire
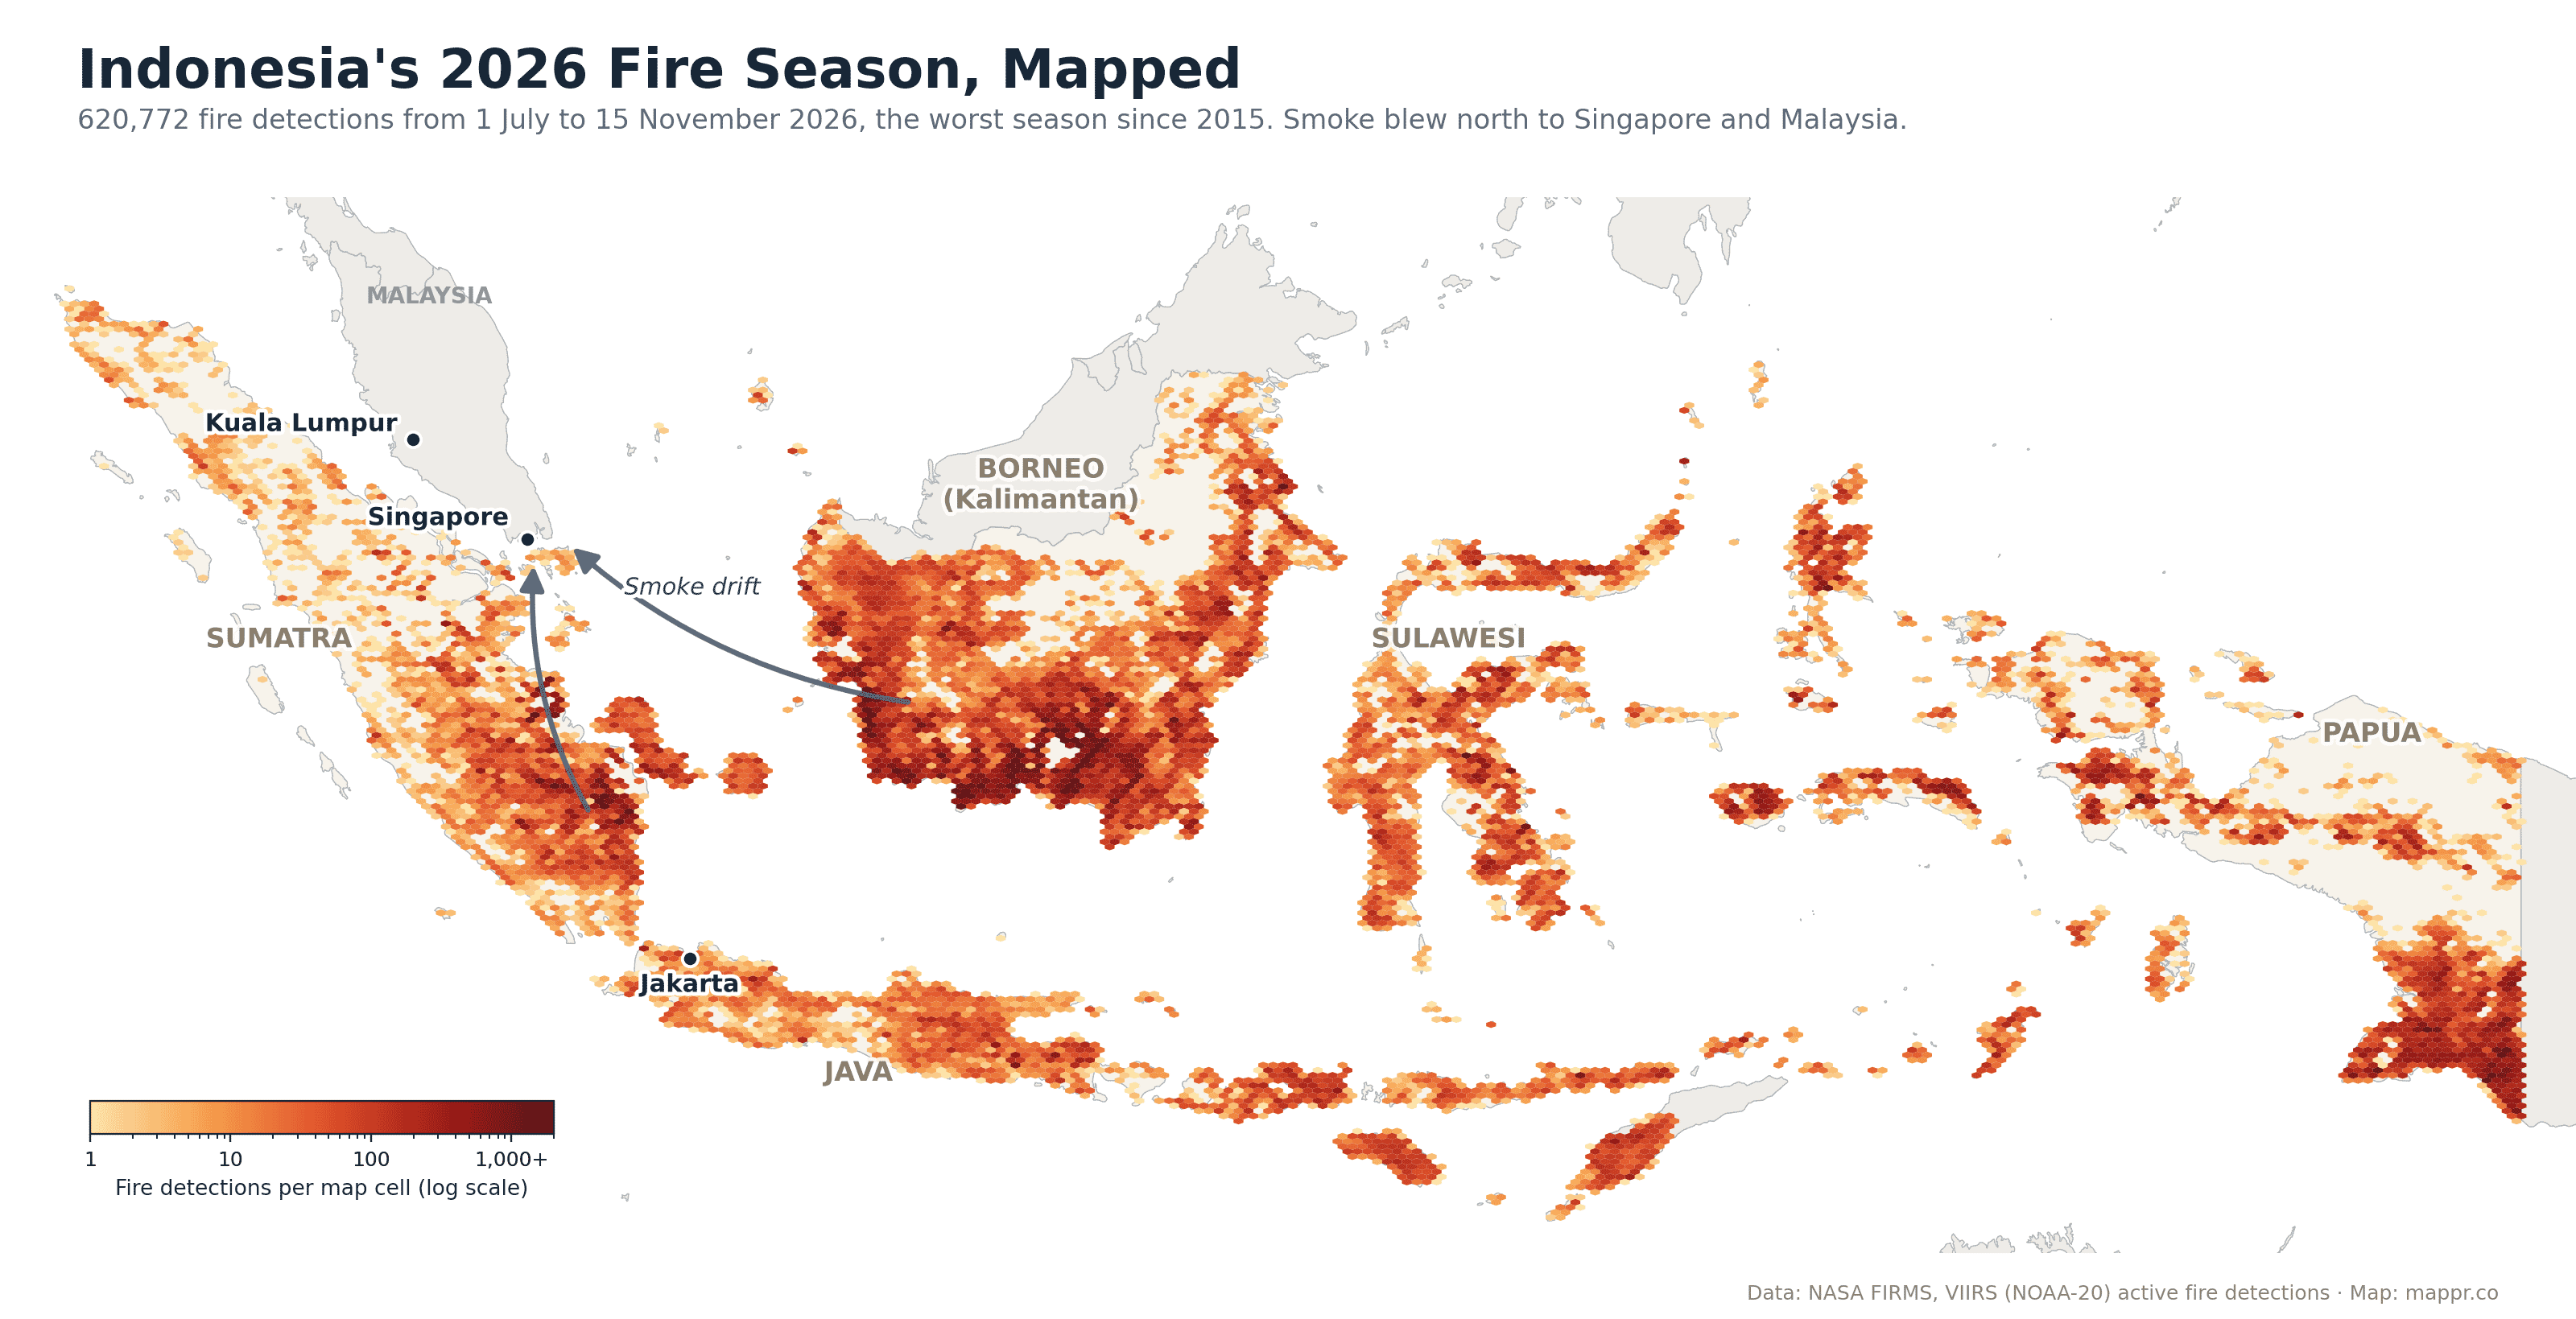
Each coloured cell on the map counts the fires that NASA’s VIIRS instrument detected from orbit between 1 July and 15 November: 620,772 detections in total. A single large fire can be detected many times, so the map shows where fire activity was most intense, not the area burned.
The darkest band runs across southern and central Borneo, where peat swamps that were drained for plantations burn easily and smoulder for weeks. South Sumatra, which Singapore’s environment agency named as a key source of the smoke plumes, was the other major hotspot for regional haze. In the far east, southern Papua burned heavily, though its smoke drifted away from Singapore and Malaysia.
Worst Since 2015
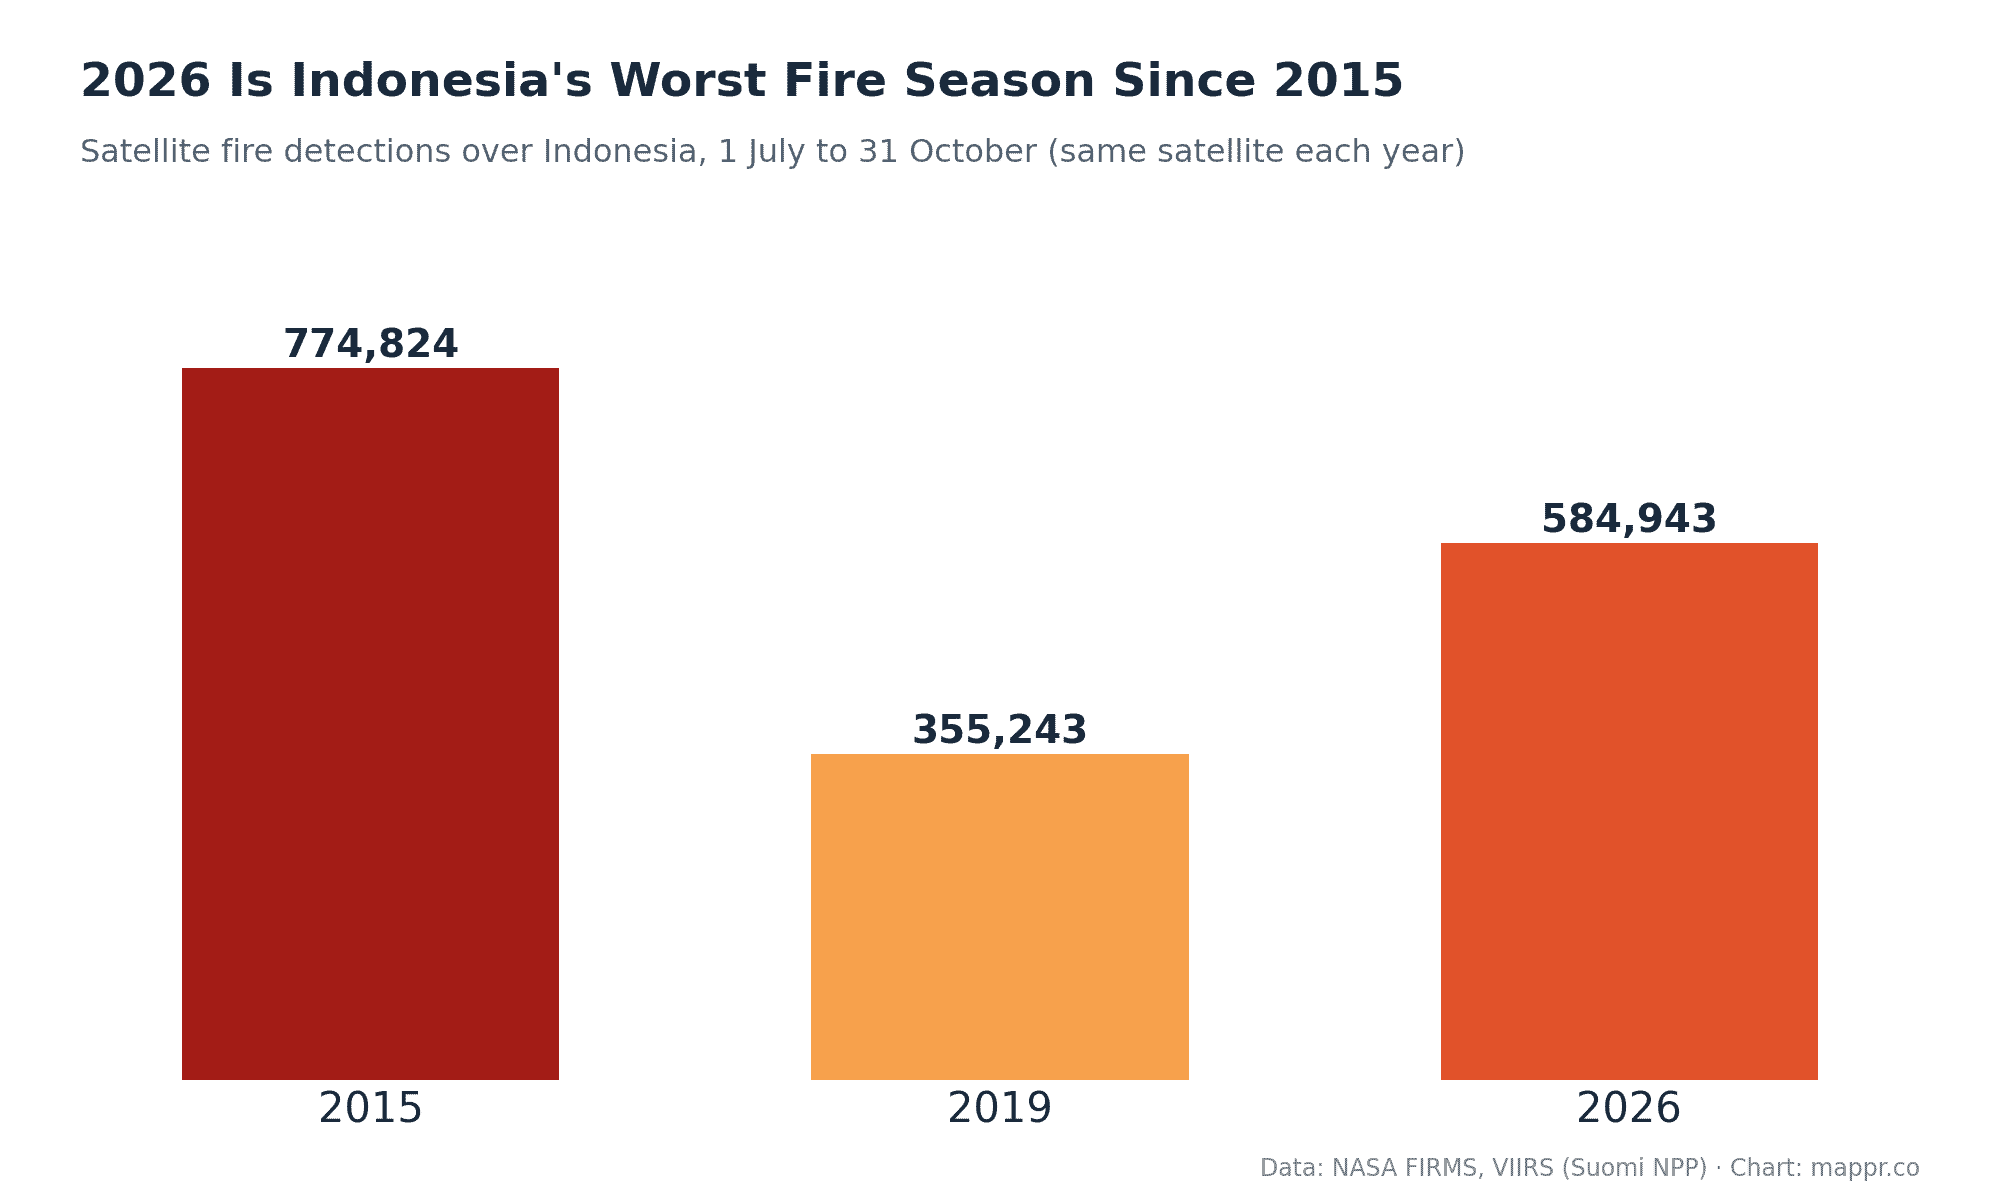
To compare seasons fairly, we counted detections from the same satellite over the same four months. 2026 recorded 584,943 detections, 65% more than 2019, the last major haze year, but about 25% fewer than 2015, when fires during a strong El Niño drought created one of Southeast Asia’s worst environmental disasters.
That fits the official description of 2026 as Indonesia’s worst fire season in 11 years. Independent burned-area estimates point the same way: the monitoring group Nusantara Atlas calculates that about 2.88 million hectares burned from January to October, more than in any year of its record, which began after 2015. It calls this a conservative estimate, because smoke hid parts of the ground from satellites. The government’s own last published estimate, from the end of July, was just 202,000 hectares.
Where the Fires Were
Where the fires were
Provinces With the Most Fire Detections, 2026
Satellite fire detections, 1 July to 15 November 2026
| Province | Fire detections | Share of Indonesia | Island |
|---|---|---|---|
| 1. Central Kalimantan | 175,041 | 28% | Borneo |
| 2. Papua (incl. South Papua) | 86,228 | 14% | New Guinea |
| 3. West Kalimantan | 78,595 | 13% | Borneo |
| 4. South Sumatra | 51,191 | 8% | Sumatra |
| 5. East Kalimantan | 36,306 | 6% | Borneo |
| 6. South Kalimantan | 30,457 | 5% | Borneo |
| 7. Maluku | 19,537 | 3% | Maluku Islands |
| 8. East Nusa Tenggara | 16,020 | 3% | Lesser Sunda Islands |
| 9. West Papua | 15,754 | 3% | New Guinea |
| 10. Central Sulawesi | 12,808 | 2% | Sulawesi |
Central Kalimantan alone accounted for 28% of all detections, and Indonesian Borneo as a whole for more than half. Papua’s figure includes the new province of South Papua, where Nusantara Atlas found the single largest burned area of any province this year, much of it around Merauke.
How the Haze Reached Singapore and Malaysia
During the dry season, prevailing southerly and southeasterly winds carry smoke from Sumatra and Kalimantan north across the Strait of Malacca and the South China Sea. In Singapore, the 24-hour Pollutant Standards Index entered the unhealthy range on 4 September, for the first time since 2023, and in October the city went through its longest run of unhealthy air since the 2015 haze crisis, briefly climbing into the very unhealthy range above 200. Smoke haze also covered parts of Peninsular Malaysia and Sarawak.
Crackdown and Cost
Indonesia deployed 71,000 firefighters, and 16 died fighting the blazes. The government has revoked 17 company concessions, and police are investigating 104 companies: 11 have been charged and 23 more are expected to be. Nusantara Atlas found that about a tenth of the burned area lay inside oil palm concessions, with more in mining and pulpwood concessions.
Many fires are lit deliberately to clear land cheaply, and on drained peat they can spread out of control. With El Niño droughts returning every few years, the region’s governments face the same question every dry season: whether enforcement on the ground can keep the next one smaller.
About the Data
Fire detections come from NASA’s Fire Information for Resource Management System (FIRMS), using the VIIRS instrument on the NOAA-20 satellite for the 2026 map and on Suomi NPP for the multi-year comparison. Detections were assigned to provinces using Natural Earth boundaries, which predate the 2022 split of Papua into new provinces. Burned-area figures are from Nusantara Atlas and are reported separately, because detections and burned area measure different things.
Sources: