Key Takeaways
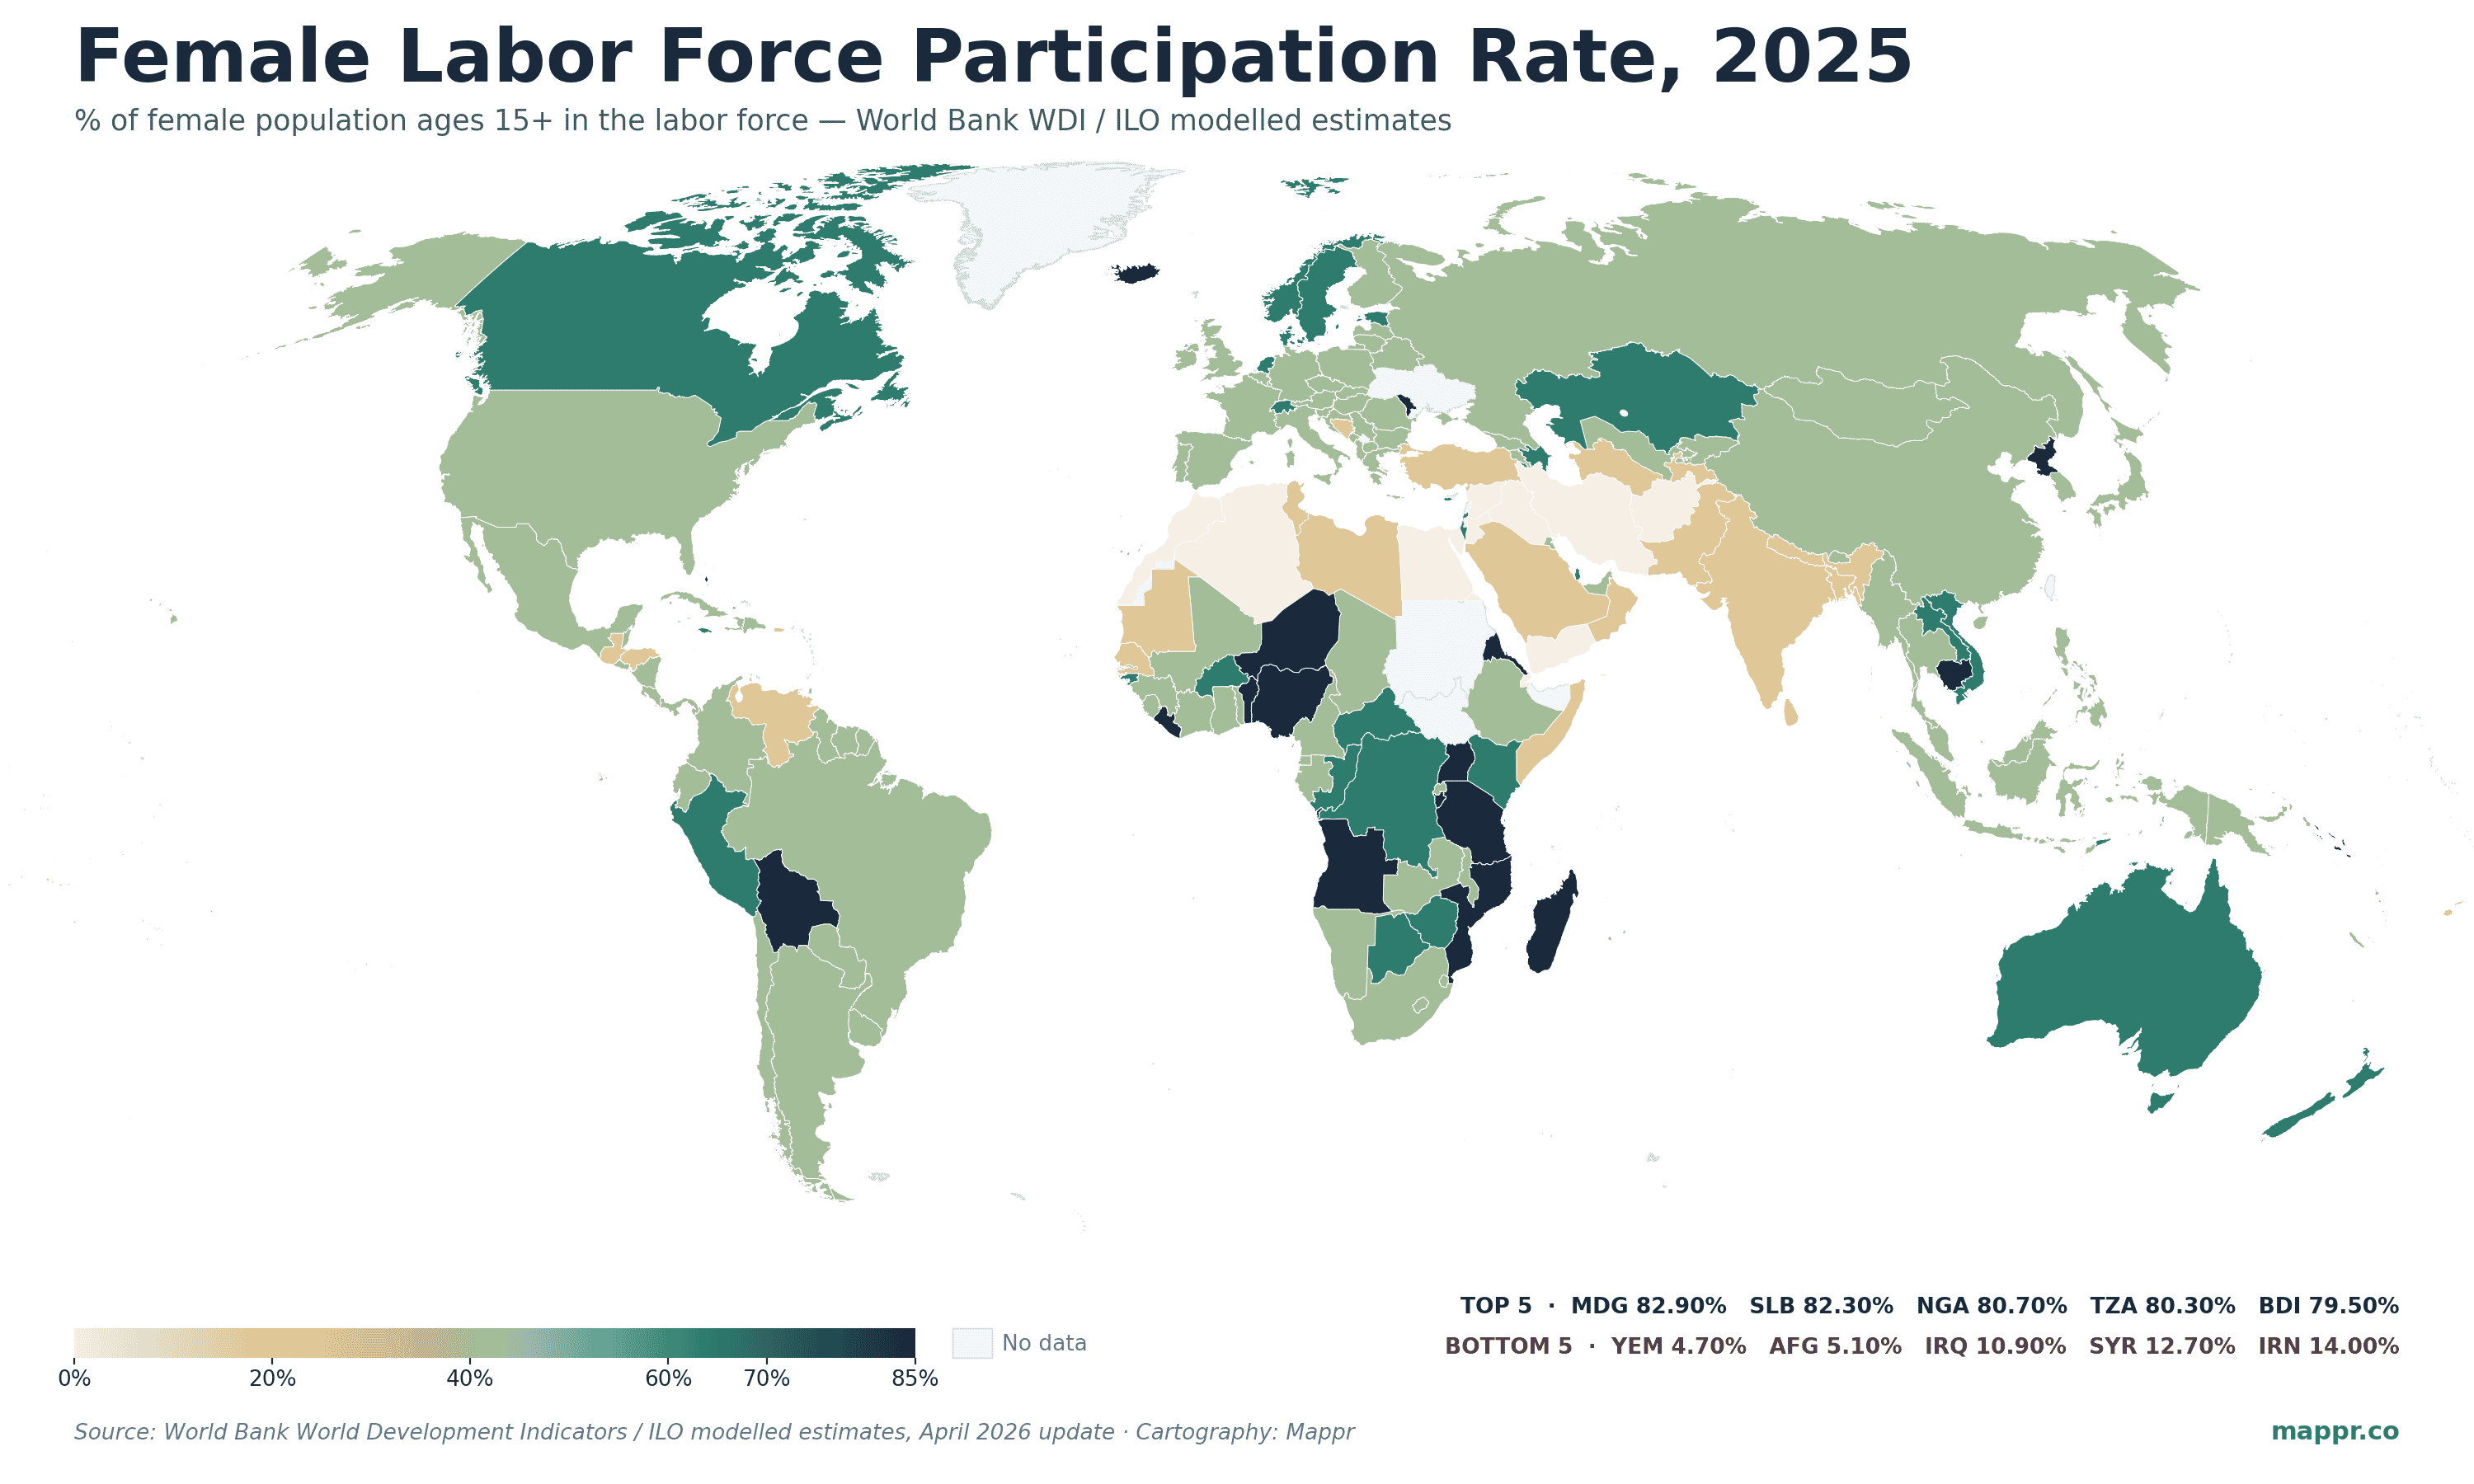
- Sub-Saharan Africa and the Pacific top the world. Madagascar (82.9%), Solomon Islands (82.3%), Nigeria (80.7%), Tanzania (80.3%), and Burundi (79.5%) lead the global ranking — far above any Western economy. Most of these are subsistence-agriculture economies where women's labor has always been counted in the formal participation measure.
- MENA dominates the bottom of the table. Yemen (4.7%), Afghanistan (5.1%), Iraq (10.9%), Syria (12.7%), Iran (14.0%), Algeria (14.1%), Jordan (16.0%), and Egypt (18.5%) are the world's lowest. Religious-cultural norms, civil-conflict displacement, and informal-sector under-counting all contribute.
- Nordic countries cluster near 60%, not the top. Sweden (61.5%), Norway (62.1%), Denmark (60.8%), Finland (56.5%) — the world's most gender-equal labor markets sit ~20pp below Sub-Saharan Africa's leaders. The gap reflects structural differences in informal labor rather than gender attitudes per se.
- Saudi Arabia is the decade's biggest mover. Saudi Arabia rose from 17.6% in 2010 to 33.6% in 2025 — a +16-percentage-point gain that reflects Vision 2030 reforms (driving licences for women in 2018, employment quotas, education investment). Malta (+21.5pp) and Bolivia (+15.2pp) are the other standouts. Ethiopia (-15.9pp) and Cameroon (-13.9pp) declined the most.
The World Bank’s 2025 ILO modelled estimates for female labor force participation, refreshed in the April 2026 World Development Indicators batch, paint a global map that defies most assumptions about gender, work, and development.
The world’s highest female labor force participation rates aren’t in the rich, gender-equal Nordic economies. They’re in Madagascar (82.9%), the Solomon Islands (82.3%), Nigeria (80.7%), Tanzania (80.3%), and Burundi (79.5%). The lowest aren’t where you might expect either — they’re concentrated in a sharply-defined band running from Yemen (4.7%) and Afghanistan (5.1%) through Iraq, Syria, Iran, and across the Maghreb to Algeria (14.1%) and Egypt (18.5%). North Korea ranks in the global top 10 at 77.7%; Saudi Arabia, after a decade of Vision 2030 reforms, has nearly doubled its rate from 17.6% to 33.6%.
This post maps the 2025 estimates for every country and unpacks why the geography looks the way it does — including why Sub-Saharan Africa’s 80%+ figures and the Nordic cluster’s ~60% reflect very different labor markets.
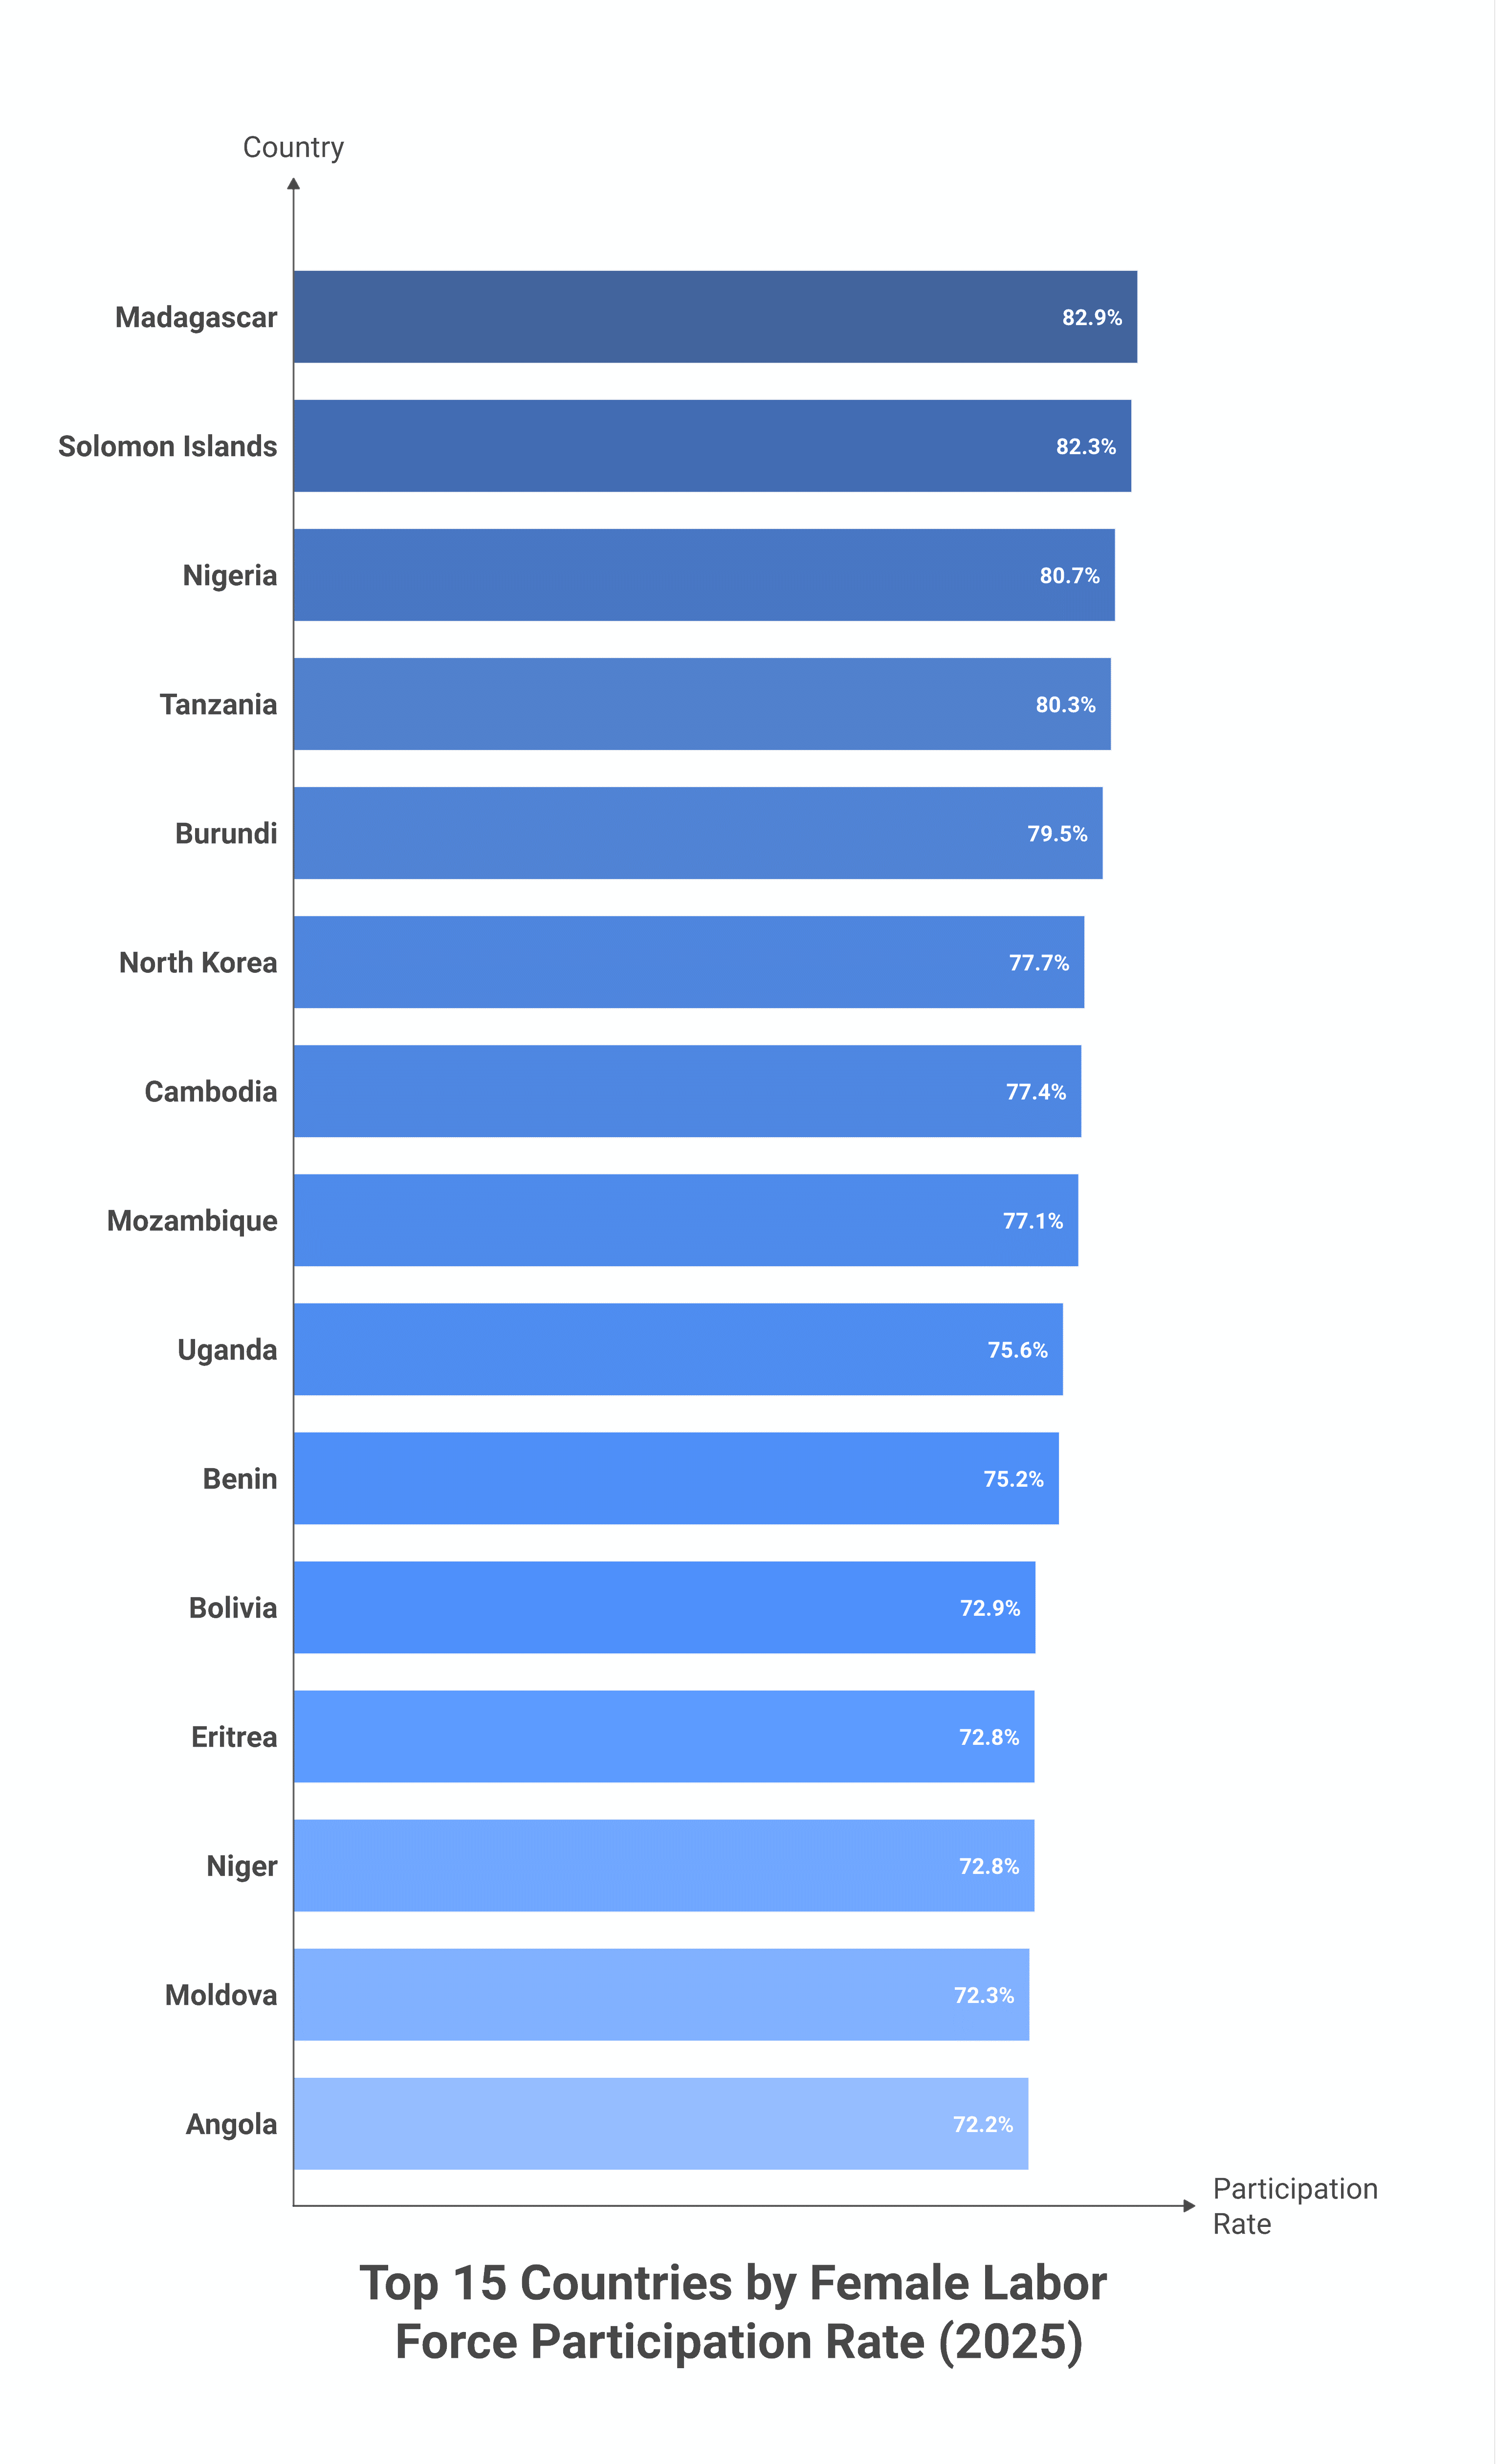
The Top 15: Sub-Saharan Africa, the Pacific, and Two Outliers
The countries with the world’s highest female labor force participation rates are dominated by Sub-Saharan African economies plus a handful of Pacific island nations. The two non-African outliers in the top 10 are North Korea (state-mandated full participation) and Cambodia (a fast-growing manufacturing economy with high female factory employment).
| Country | Female LFPR (2025) | Driver |
|---|---|---|
| 🇲🇬 Madagascar | 82.9% | Subsistence agriculture; informal sector heavily female |
| 🇸🇧 Solomon Islands | 82.3% | Subsistence farming + informal trading |
| 🇳🇬 Nigeria | 80.7% | Informal trading dominates female employment |
| 🇹🇿 Tanzania | 80.3% | Subsistence agriculture; formal-sector employment small |
| 🇧🇮 Burundi | 79.5% | Subsistence agriculture |
| 🇰🇵 North Korea | 77.7% | State-mandated near-universal labor participation |
| 🇰🇭 Cambodia | 77.4% | Garment-export manufacturing employs heavily female workforce |
| 🇲🇿 Mozambique | 77.1% | Subsistence agriculture |
| 🇺🇬 Uganda | 75.6% | Subsistence agriculture + informal trading |
| 🇧🇯 Benin | 75.2% | Informal trading networks |
| 🇧🇴 Bolivia | 72.9% | Highest in Latin America; informal urban sector |
| 🇪🇷 Eritrea | 72.8% | Civil-service employment + agriculture |
| 🇳🇪 Niger | 72.8% | Subsistence agriculture |
| 🇲🇩 Moldova | 72.3% | Highest in Eastern Europe; Soviet-legacy female employment norms |
| 🇦🇴 Angola | 72.2% | Subsistence agriculture + informal trading |
The 80%+ rates in Sub-Saharan Africa often surprise readers from richer countries. The reason is methodological: the ILO definition of “labor force participation” includes all paid AND unpaid market work — subsistence farming, informal market trading, micro-enterprise. In economies where most women farm, trade, or operate informal businesses, virtually everyone counts. In OECD economies where the formal-vs-informal distinction is sharper, only formal-sector employment is captured cleanly.
The Bottom 15: A Sharp MENA Cluster
The bottom of the global ranking is the most geographically concentrated story on the map. With three exceptions (Pakistan, Tajikistan, and São Tomé), every country with female labor force participation under 30% is in the Middle East and North Africa.
| Country | Female LFPR (2025) | Notes |
|---|---|---|
| 🇾🇪 Yemen | 4.7% | Civil war + cultural norms; effectively no female formal labor force |
| 🇦🇫 Afghanistan | 5.1% | Taliban-era restrictions on women’s work + education |
| 🇮🇶 Iraq | 10.9% | Civil-conflict-era workforce displacement compounding cultural baseline |
| 🇸🇾 Syria | 12.7% | 14-year civil war devastated female formal employment |
| 🇮🇷 Iran | 14.0% | Sanctions + restrictive labor laws + formal-sector contraction |
| 🇩🇿 Algeria | 14.1% | Lowest in the Maghreb; high public-sector wage premium discourages female private-sector entry |
| 🇯🇴 Jordan | 16.0% | Despite high female education, transition to workforce remains weak |
| 🇪🇬 Egypt | 18.5% | Largest economy in the bottom 10; declining slightly over the past decade |
| 🇩🇯 Djibouti | 19.4% | Small formal sector overall |
| 🇲🇦 Morocco | 19.7% | Lowest in the Maghreb after Algeria; declining over the past 15 years |
| 🇸🇴 Somalia | 20.7% | State-collapse legacy; informal sector under-counted |
| 🇹🇯 Tajikistan | 21.9% | Migration-driven (men work in Russia, women remain but in informal/agricultural) |
| 🇸🇹 São Tomé and Príncipe | 22.7% | Small island economy; informal labor under-counted |
| 🇵🇰 Pakistan | 24.0% | Cultural norms + low female education attainment |
| 🇲🇷 Mauritania | 26.2% | Mixed Arab-African society at the boundary of the MENA cluster |
The MENA cluster reflects a combination of factors: religious-cultural norms about female work outside the home, civil-conflict displacement (Yemen, Syria, Iraq), high oil-and-gas-rent economies that don’t depend on female labor for GDP growth, and large public-sector wage premia that crowd out female private-sector employment. Saudi Arabia and the UAE are the partial exceptions — both have made deliberate policy moves to bring women into the workforce since 2018, and both now sit above 30% (Saudi Arabia 33.6%, UAE 53.0%).
The G7 + Nordics: A Middle Cluster Around 55–62%
The world’s wealthiest economies cluster in a fairly narrow band between the global extremes. The Nordic countries are at the top of the OECD distribution but well below the African leaders.
- 🇨🇦 Canada — 60.2%: highest in the G7 by 4pp
- 🇦🇺 Australia — 62.5%: among the highest in any high-income economy
- 🇳🇴 Norway — 62.1%: top of the Nordic cluster
- 🇸🇪 Sweden — 61.5%: long-standing universal-childcare regime
- 🇩🇰 Denmark — 60.8%
- 🇨🇳 China — 59.1%: declining steadily since the 1990 peak (74%)
- 🇬🇧 United Kingdom — 57.3%
- 🇰🇷 South Korea — 56.8%: low for an OECD high-income economy
- 🇫🇮 Finland — 56.5%
- 🇺🇸 United States — 56.3%: declined from 60% peak in 1999
- 🇯🇵 Japan — 55.9%: rising since the early 2010s on labor-shortage policy
- 🇩🇪 Germany — 55.3%
- 🇷🇺 Russia — 54.5%
- 🇧🇷 Brazil — 53.4%
- 🇮🇩 Indonesia — 53.7%
- 🇪🇸 Spain — 52.8%
- 🇫🇷 France — 51.5%
- 🇮🇹 Italy — 40.8%: lowest in the G7 by a wide margin; persistent structural challenge
- 🇮🇳 India — 32.4%: largest economy in the bottom third; rising slowly from a 23% trough in 2017
Decade Movers: Saudi Arabia, Malta, Bolivia Up; Ethiopia, Cameroon Down
The largest 2010-to-2025 changes tell two stories: aggressive policy moves that pulled women into the formal sector, and structural declines that pushed them out.
| Direction | Country | 2010 → 2025 | Driver |
|---|---|---|---|
| 📈 Up | 🇲🇹 Malta | 34.3% → 55.8% (+21.5pp) | EU-driven childcare expansion + tax reform |
| 🇸🇦 Saudi Arabia | 17.6% → 33.6% (+16.0pp) | Vision 2030 reforms — driving licences (2018), employment quotas, education investment | |
| 🇧🇴 Bolivia | 57.7% → 72.9% (+15.2pp) | Informal-sector expansion + gender policy under MAS-era governments | |
| 🇰🇲 Comoros | 32.7% → 47.6% (+14.9pp) | Female agricultural employment + service-sector growth | |
| 🇩🇴 Dominican Republic | 41.7% → 53.7% (+12.0pp) | Tourism + manufacturing employment | |
| 🇶🇦 Qatar | 50.8% → 61.9% (+11.1pp) | National Vision 2030 + expat workforce composition | |
| 📉 Down | 🇪🇹 Ethiopia | 74.4% → 58.5% (-15.9pp) | Conflict + agricultural decline + rural-to-urban transition |
| 🇨🇲 Cameroon | 70.5% → 56.6% (-13.9pp) | Conflict in Anglophone regions + rural agricultural displacement | |
| 🇻🇪 Venezuela | 49.6% → 37.1% (-12.5pp) | Economic collapse + emigration of working-age women | |
| 🇲🇼 Malawi | 70.5% → 58.2% (-12.3pp) | Rural-to-urban transition; informal-to-formal classification shift | |
| 🇬🇭 Ghana | 67.5% → 55.3% (-12.2pp) | Sectoral shift from informal trading toward formal-sector positions women are slower to enter |
Reading the Map: Two Important Caveats
The map can mislead if you read participation rates as a proxy for gender equity directly.
1. Subsistence-agriculture vs. formal-sector economies count work differently. In Madagascar, virtually every adult woman farms, trades, or runs a micro-enterprise — and the ILO methodology counts all of that as “in the labor force.” In Germany or Japan, “in the labor force” overwhelmingly means formal employment with payroll registration. The 30-percentage-point gap between Madagascar and Germany doesn’t mean Madagascar has stronger gender norms — it means the structure of the economy makes more female work statistically visible. Comparing within-region (Sub-Saharan Africa to Sub-Saharan Africa, OECD to OECD) is more meaningful than comparing across regions.
2. Wages, hours, and quality aren’t captured. A 60% female labor force participation rate could reflect 60% of women in full-time, well-paid formal jobs (Sweden), 60% in part-time or precarious work (UK), or 60% in subsistence agriculture (Tanzania). The participation-rate metric tells you who is “in” but nothing about pay parity, occupational segregation, or the gendered division of unpaid care work. Cross-reference with the ILO Gender Pay Gap, the World Economic Forum Global Gender Gap Index, and OECD time-use data for a fuller picture.
For when women first won the right to vote, see our map of women’s voting rights around the world.