Key Takeaways
- Four countries near 100% renewable electricity. Bhutan (100%), Lesotho (99.8%), Costa Rica (99.4%), and Norway (99.1%) generate essentially all of their electricity from renewable sources — overwhelmingly hydropower, supplemented by wind, geothermal, and solar.
- Gulf states are the cleanest case of fossil dependence. Bahrain, Brunei, Comoros, Libya, and Turkmenistan generate effectively 0% from renewables in 2021. Saudi Arabia (0.1%), Qatar (0.3%), and Kuwait (0.3%) sit at the very bottom — abundant cheap natural gas + low geothermal/hydro potential = no economic case for transition yet.
- Denmark and the UK are the clearest transition stories. Denmark went from 32% renewable electricity in 2010 to 79% in 2021 (+47pp) — driven by offshore wind. The UK went from 7.7% to 40.2% in the same window (+32pp) — also offshore wind. Both faster than anything in Asia.
- Major economies are still mostly fossil-powered. USA at 20.3%, China 28.4%, Japan 21.1%, India 19.1%, Russia 19.2%, France 22.8%. Brazil (77.4%) and Canada (67%) are the G20 outliers, both driven by hydro. Germany (39.8%) leads Europe's industrial base.
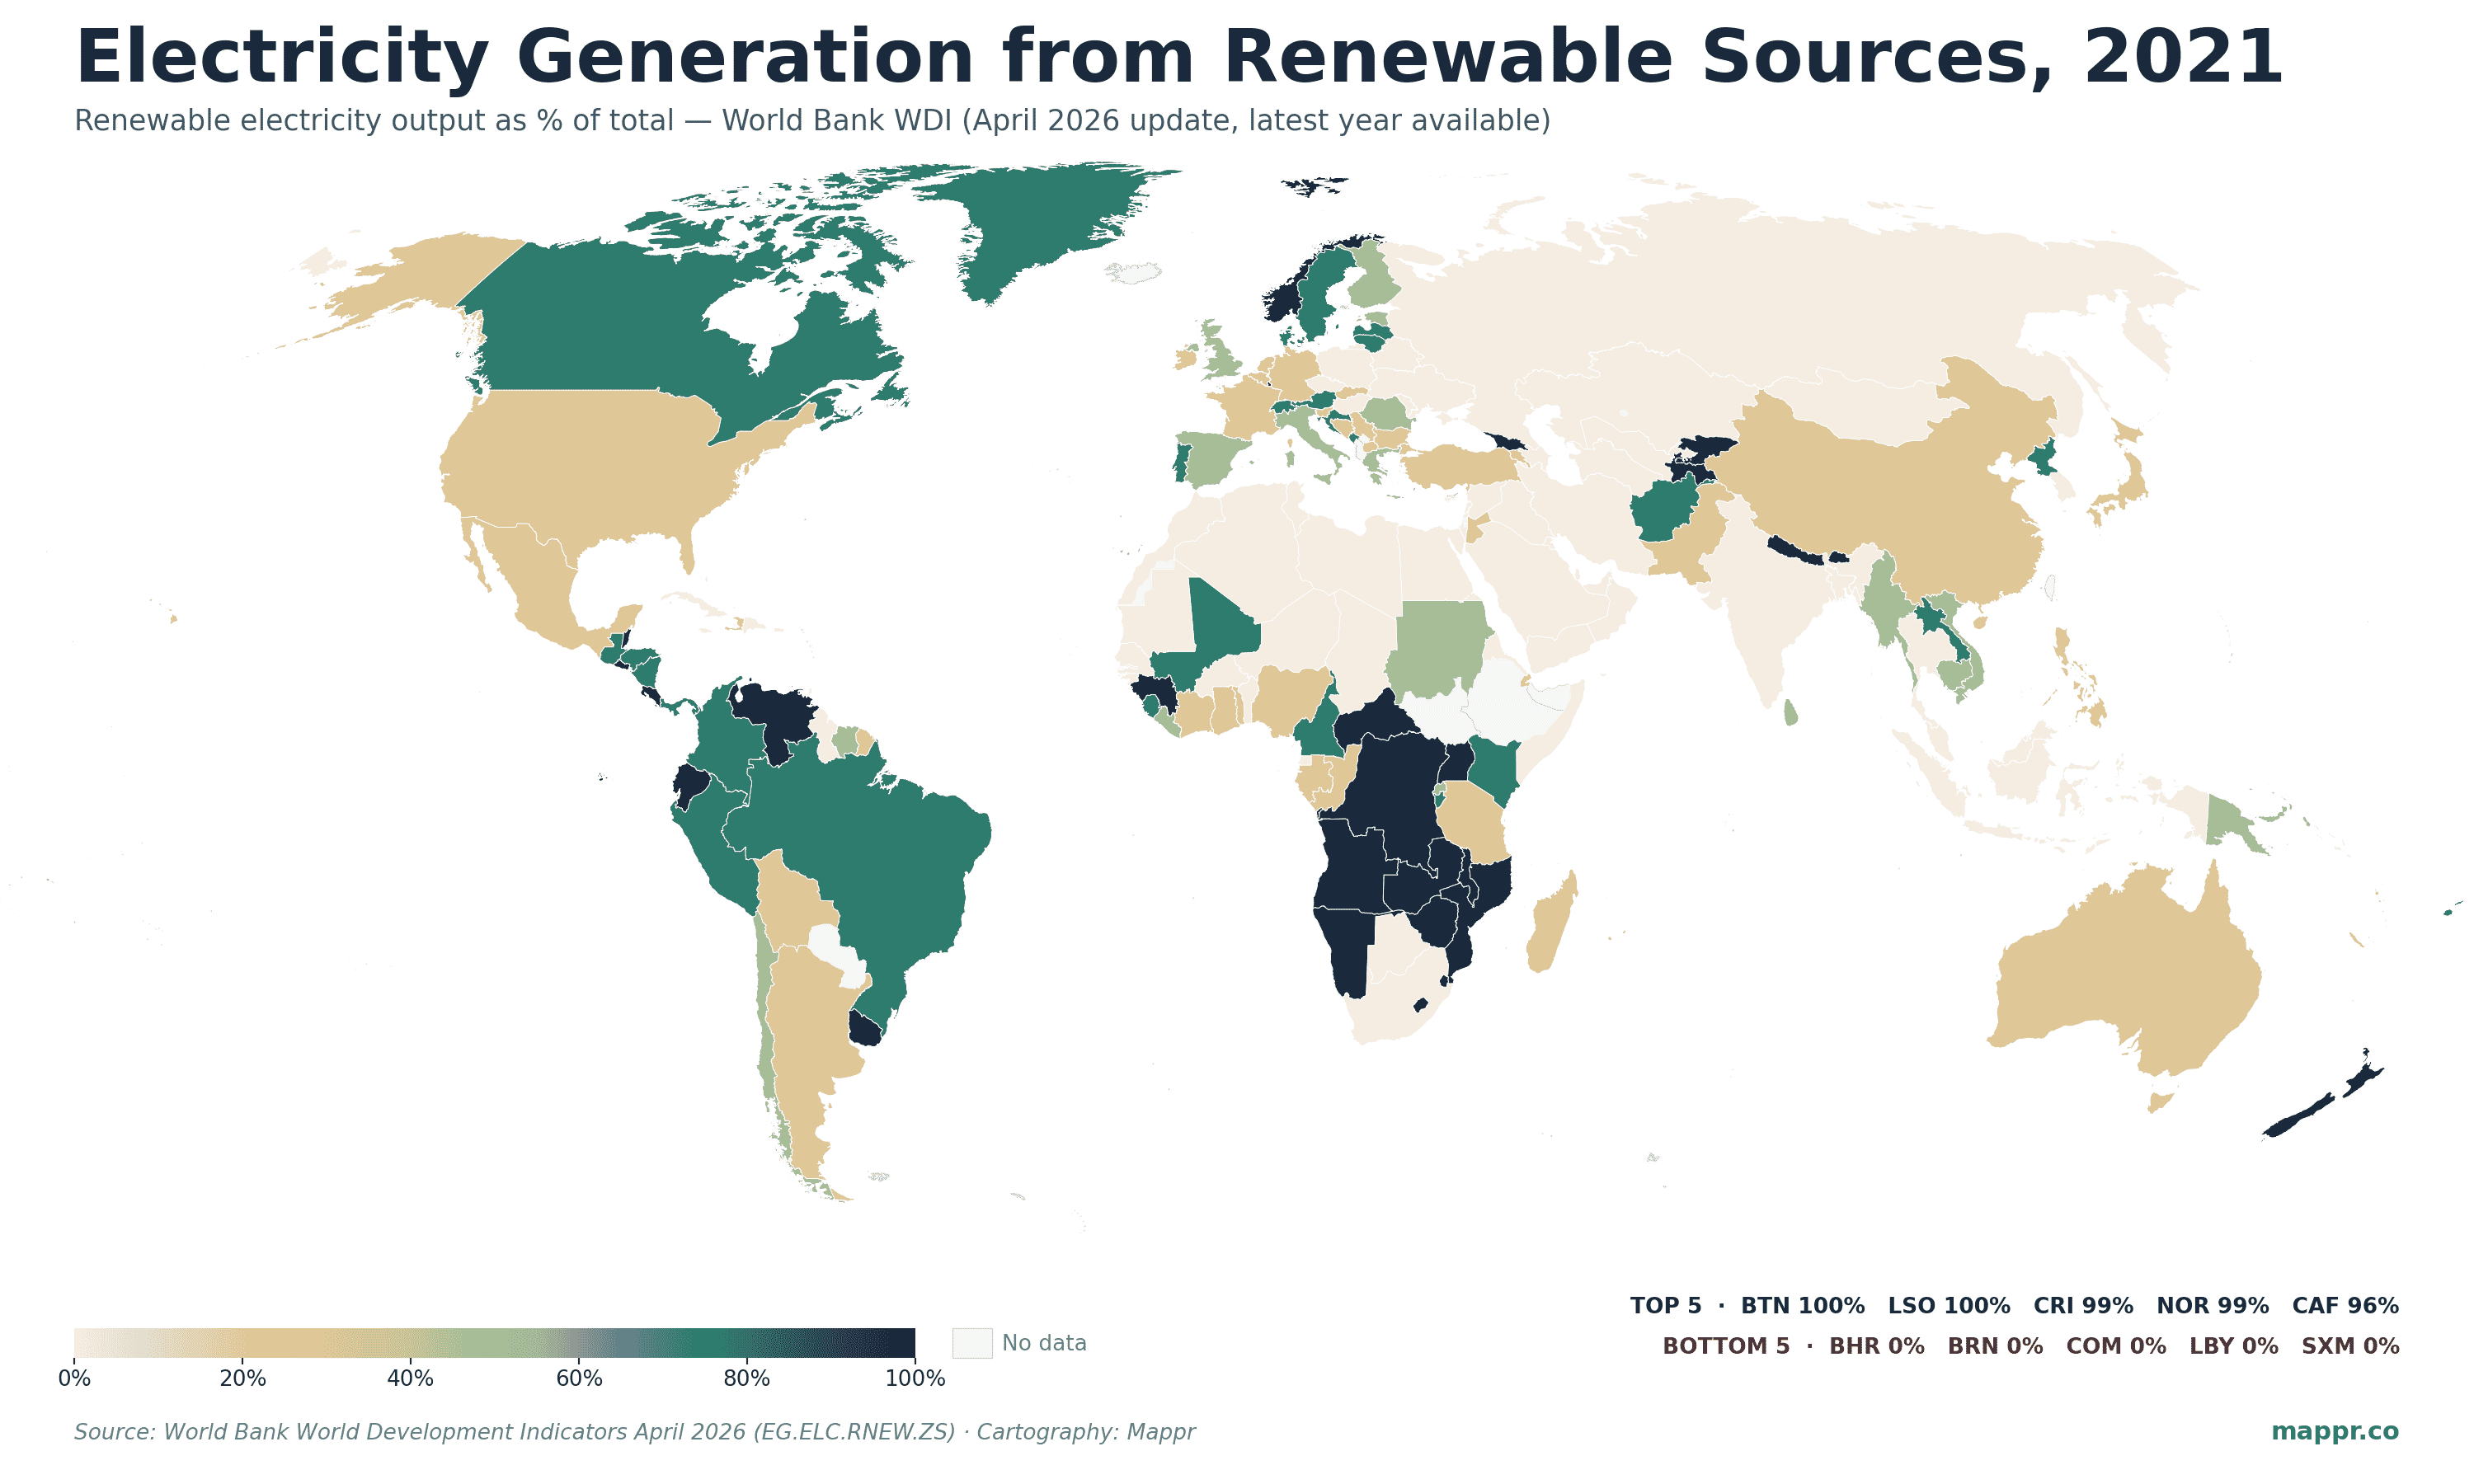
The World Bank’s April 2026 World Development Indicators refresh dropped a fresh batch of energy data, and the global map of renewable electricity remains as polarized as ever. At one extreme: a cluster of small economies and three outliers (Norway, Costa Rica, and a few hydropower-rich African states) generating essentially 100% of their electricity from renewables. At the other: the Gulf monarchies and a handful of natural-gas-dominated economies generating effectively zero. Between them, the world’s biggest economies sit in a middle band that has been moving — but slowly.
The latest WDI vintage in this dataset is 2021 (energy statistics typically lag 3–4 years behind the publication year, even in the April 2026 batch). The picture has not flipped since: even with the fastest IRENA capacity additions on record in 2024–2025, share-of-electricity figures move slowly in big systems. The 2021 ranking gives a reliable structural snapshot of where each country sits in the transition.
This post maps the 2021 share of renewable electricity for every country, surfaces the 10-year transition leaders, and identifies which big economies are moving — and which are still functionally on fossil fuel.
The Top of the Table: Hydropower-Dominant Small Economies + Norway
The countries at the top of the renewables-share ranking share a common ingredient: large hydroelectric capacity relative to a small total electricity demand. Bhutan and Lesotho effectively run on hydropower exports; Costa Rica’s grid is mostly hydropower plus geothermal; Norway is the world’s largest example of a fully-industrialised hydropower economy.
| Country | Renewable share (2021) | Notes |
|---|---|---|
| 🇧🇹 Bhutan | 100.0% | Almost entirely hydropower; net exporter to India |
| 🇱🇸 Lesotho | 99.8% | Mohale + Katse hydropower complex; exports to South Africa |
| 🇨🇷 Costa Rica | 99.4% | Hydropower + geothermal + wind; ~70% hydro on dry years, plant-mix flexible |
| 🇳🇴 Norway | 99.1% | Hydropower since the early 20th century; world’s largest fully-industrialised renewable grid |
| 🇨🇫 Central African Republic | 96.5% | Boali hydropower complex on the Mbali River |
| 🇸🇻 El Salvador | 95.6% | Geothermal + hydropower (one of the world’s geothermal leaders by share) |
| 🇳🇦 Namibia | 93.4% | Hydropower + imports from regional grid |
| 🇹🇯 Tajikistan | 93.4% | Nurek + Rogun hydropower on the Vakhsh River |
| 🇦🇩 Andorra | 93.3% | Hydropower + imports from France |
| 🇧🇿 Belize | 92.9% | Hydropower + biomass |
| 🇿🇲 Zambia | 92.0% | Kariba + Kafue hydropower (vulnerable to drought years) |
| 🇦🇴 Angola | 91.2% | Capanda + Cambambe hydropower complexes |
| 🇨🇩 DR Congo | 90.4% | Inga hydropower (running far below capacity) |
| 🇺🇬 Uganda | 90.0% | Karuma + Bujagali hydropower on the Nile |
| 🇱🇺 Luxembourg | 89.0% | Imports + biogas + solar; largest decade-over-decade share gain (+53.5pp) |
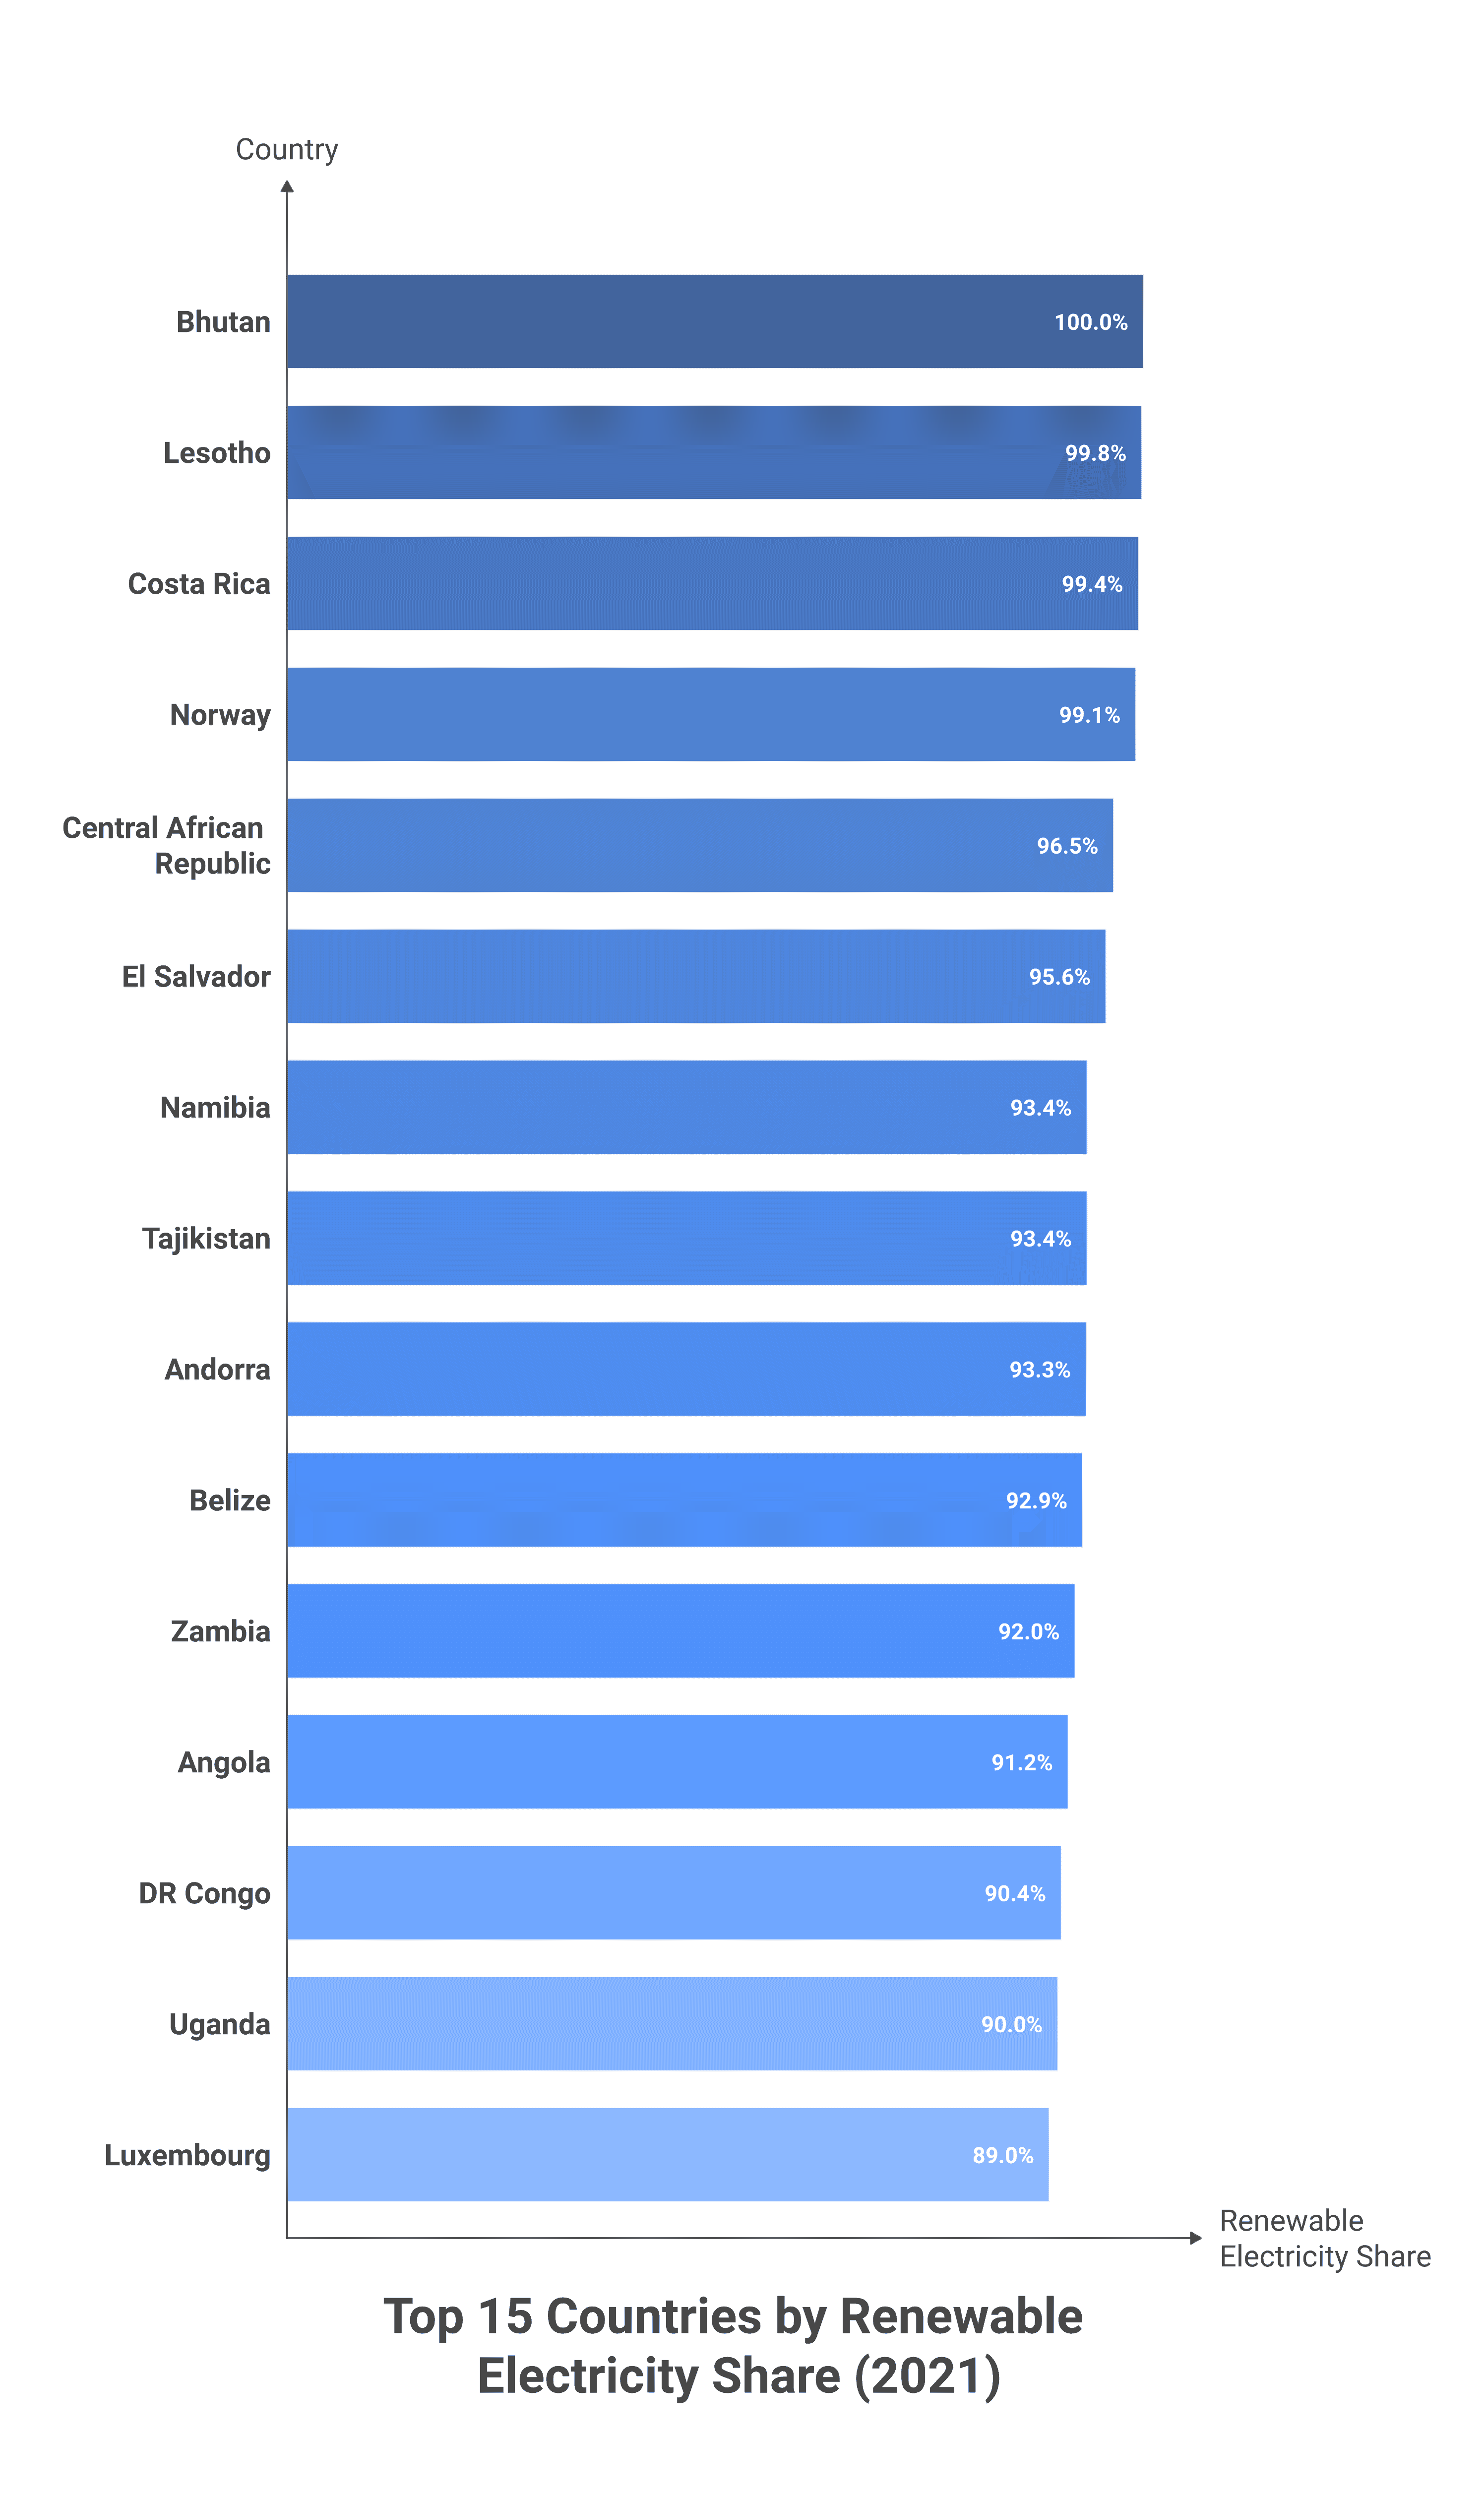
The pattern is dominated by hydropower. Of the 15 highest-share countries, 13 rely primarily on hydroelectricity. Norway and Costa Rica are the only two that combine hydro with a meaningful contribution from a second renewable source (wind for Norway, geothermal for Costa Rica). Luxembourg is the outlier — a small-grid case where imports + a deliberate decade-long buildout of biogas and solar shifted the headline from 35% to 89% in eleven years, the largest gain in the global ranking.
The Bottom of the Table: Gulf States and Gas-Rich Holdouts
The other end of the distribution is dominated by countries with abundant, cheap fossil fuel — primarily natural gas. With domestic gas at near-zero marginal cost, the economic case for renewables collapses, and these grids run on combined-cycle gas turbines or oil-fired generators almost exclusively.
| Country | Renewable share (2021) | Notes |
|---|---|---|
| 🇧🇭 Bahrain | 0.0% | Cheap natural gas; small Al-Dur solar pilot but not yet at grid scale |
| 🇧🇳 Brunei | 0.0% | Domestic gas-rich; flat terrain, no hydro potential |
| 🇰🇲 Comoros | 0.0% | Diesel-dominated isolated island grids |
| 🇱🇾 Libya | 0.0% | Gas + oil for the grid; civil-war-era infrastructure neglect |
| 🇹🇲 Turkmenistan | 0.0% | One of the world’s most gas-rich grids; cheap domestic supply |
| 🇸🇦 Saudi Arabia | 0.1% | Vision 2030 targets 50% renewables by 2030 — early stages of buildout |
| 🇹🇹 Trinidad & Tobago | 0.1% | Gas-dominated grid; LNG export economy |
| 🇧🇼 Botswana | 0.2% | Coal-dominated grid (Morupule); imports from Eskom |
| 🇸🇸 South Sudan | 0.3% | Diesel; minimal grid connection; civil-conflict era |
| 🇶🇦 Qatar | 0.3% | Gas-dominated; Al-Kharsaah solar plant 2022 will move 2024+ figures |
| 🇰🇼 Kuwait | 0.3% | Cheap subsidised gas; Shagaya renewable park ramping |
| 🇧🇯 Benin | 0.3% | Net importer from Ghana; thermal-dominated domestic supply |
The Gulf monarchies dominate this list, and the reason is structural. Saudi Arabia, the UAE, Qatar, Kuwait, and Bahrain all have abundant domestic gas and a long history of subsidising it for power generation. Renewables are competitive at unsubsidised gas prices but not at the heavily-discounted domestic prices these utilities pay. Vision 2030 (Saudi), the UAE’s clean-energy strategy, and Qatar’s National Renewable Energy Strategy have all set ambitious 2030 targets, but the buildout is concentrated in the 2024–2030 window — meaning the 2021 WDI vintage captures these grids before the transition shows up in the data.
The Decade’s Biggest Transitions: Denmark, the UK, and Cambodia
The most actionable cut of the WDI dataset is the 10-year change. Comparing 2010 to 2021 isolates which countries actually moved versus which started near 100% (and therefore had nowhere to go). The biggest gainers in absolute percentage-point terms tell three different transition stories.
| Country | 2010 → 2021 | Driver |
|---|---|---|
| 🇱🇺 Luxembourg | 35.5% → 89.0% (+53.5pp) | Imports + deliberate biogas + solar buildout in a small grid |
| 🇰🇭 Cambodia | 4.0% → 56.4% (+52.4pp) | Lower Sesan 2 + Stung Treng hydropower came online late-2010s |
| 🇩🇰 Denmark | 32.0% → 79.0% (+47.0pp) | Offshore wind — Horns Rev 3 + Kriegers Flak + Vesterhav |
| 🇺🇬 Uganda | 52.3% → 90.0% (+37.7pp) | Karuma + Isimba hydropower commissioning |
| 🇱🇹 Lithuania | 29.0% → 65.6% (+36.6pp) | Wind + biomass replacing Ignalina nuclear shutdown |
| 🇪🇨 Ecuador | 45.5% → 80.9% (+35.4pp) | Coca Codo Sinclair hydropower (1,500 MW) |
| 🇬🇧 United Kingdom | 7.7% → 40.2% (+32.5pp) | Offshore wind — Hornsea, Dogger Bank, East Anglia projects |
| 🇪🇪 Estonia | 8.1% → 40.0% (+31.9pp) | Wind + biomass replacing oil-shale base load |
| 🇸🇻 El Salvador | 66.7% → 95.6% (+28.9pp) | Geothermal expansion at Berlín + Ahuachapán fields |
| 🇯🇴 Jordan | 0.5% → 24.9% (+24.4pp) | Tafila wind farm + Quweira solar — fastest Middle East mover |
The story splits cleanly. Denmark and the UK are the wind story: both went from low-single-digits or low-30s in 2010 to industrial-scale renewable grids in a decade, almost entirely on offshore wind. Both jurisdictions also handed out long-duration Contracts for Difference and stable strike prices, which collapsed the cost of capital for offshore wind developers and brought 30-year levelised costs below gas in the late 2010s.
Cambodia, Uganda, and Ecuador are the hydro story: large dam projects commissioning late in the decade pushed shares dramatically higher. These are also the most vulnerable to climate-driven hydrological variability — the same dam that delivers 90% renewables in a wet year delivers 60% in a dry year (Zambia’s Kariba showed this clearly in 2024).
Jordan is the Middle East outlier: from 0.5% to 24.9% in a decade, almost entirely on solar and wind. Jordan does not have domestic gas, and its political-economic case for renewables is more straightforward than the Gulf petrostates’. Its Tafila wind farm and Quweira solar plant became the regional templates for what’s now under construction in Saudi Arabia, the UAE, and Egypt.
The G20 Reality Check: Big Economies Are Still Mostly Fossil
The headlines about renewable-capacity growth — IRENA’s 2024 record of 585 GW added globally, China’s solar buildout, Texas wind — can obscure the fact that the world’s largest electricity systems are still majority fossil-fuel. Here’s where the major economies sat in 2021:
- 🇧🇷 Brazil — 77.4%: hydropower + ethanol-fired thermal + growing wind in Rio Grande do Norte. The G20’s clean-energy outlier.
- 🇨🇦 Canada — 67.0%: hydro-dominated (Quebec, BC, Manitoba) + nuclear in Ontario. Renewables share would be even higher counting nuclear separately.
- 🇪🇸 Spain — 47.0%: wind + solar; one of Europe’s biggest decade-over-decade gainers.
- 🇮🇹 Italy — 41.0%: hydro in the Alps + solar in the south.
- 🇬🇧 UK — 40.2%: offshore wind story (see above).
- 🇩🇪 Germany — 39.8%: wind + solar + biomass; coal still ~30% post-Energiewende.
- 🇹🇷 Turkey — 35.4%: hydro + rapidly-growing geothermal + wind.
- 🇨🇳 China — 28.4%: hydropower (Three Gorges, Wudongde) + the world’s biggest absolute solar + wind capacity, but on a massive denominator.
- 🇦🇺 Australia — 26.7%: rooftop solar penetration is among the world’s highest, but coal still dominates the National Electricity Market.
- 🇲🇽 Mexico — 23.4%: hydro + geothermal + wind in Oaxaca.
- 🇫🇷 France — 22.8%: figure understates France’s clean grid because nuclear (~70%) is excluded from “renewables.”
- 🇯🇵 Japan — 21.1%: solar + biomass; nuclear restart pace will move this in either direction.
- 🇺🇸 United States — 20.3%: hydro + wind (Texas, Iowa) + solar (California, Nevada). Inflation Reduction Act capacity additions will move 2024+ vintages.
- 🇷🇺 Russia — 19.2%: hydro almost entirely; wind/solar negligible.
- 🇮🇳 India — 19.1%: hydro + the world’s third-largest absolute solar capacity, but on a fast-growing denominator.
- 🇰🇷 South Korea — 6.6%: lowest in the G20; gas + coal + nuclear dominate; 2030 target of 30% will be a stretch.
What This Map Doesn’t Show
Three caveats are worth flagging for anyone using this dataset for analysis.
It’s electricity only, not total energy. Industrial heat, transport, residential heating, and shipping are excluded. Including total final energy consumption (the EG.FEC.RNEW.ZS series) would push every country’s number down — biomass and hydropower dominate the electricity-only metric, while transport remains overwhelmingly oil.
Hydropower share masks transition speed. Norway and Bhutan have been at 95%+ for decades — they’re not “transitioning,” they were already there. The countries doing the actual decarbonisation work right now (Denmark, UK, Germany, Spain, US, China, India in absolute terms) are moving fastest precisely because they had the most fossil-fuel base to displace.
Nuclear is excluded. France (22.8% renewables) actually has one of the world’s cleanest electricity grids overall because ~70% of its generation comes from nuclear, which doesn’t count as “renewable” but is low-carbon. Sweden, Belgium, Slovakia, and Bulgaria all see their renewable shares understated by the same definition.
The 2024 IRENA capacity numbers — 585 GW added globally, 75% of all new capacity — point clearly to the next vintage of this dataset (2024 data, expected in WDI early 2027) showing significant share gains in the US, China, India, the Gulf states, and across the developing world. The 2021 baseline mapped above is the “before” picture for what’s likely the steepest renewable buildout decade in history.