
Map making software has evolved well beyond basic pin-dropping tools. Whether you need to visualize business data across regions, build interactive maps for a website, or analyze complex geospatial datasets, there is a dedicated tool for the job. The landscape in 2026 spans everything from beginner-friendly drag-and-drop map generators to full-scale GIS platforms used by governments and research institutions.
Choosing the right map making software depends on your goals. A marketer plotting customer locations has very different needs from a data journalist building choropleth maps, or a city planner running spatial analysis. This guide compares 12 of the best map making software options available right now, covering their key features, pricing, and ideal use cases to help you find the right fit.
The tools in this roundup range from free and open-source options like QGIS and Google My Maps to premium platforms like ArcGIS and Maptive. Each has been evaluated based on ease of use, feature depth, map types supported, and overall value.
When you buy through links on this page, we may earn an affiliate commission. Commission payments do not affect the evaluations of the products.
Best Map Making Software:
1. Visme
Visme is an all-in-one visual content platform that includes a powerful built-in map generator. It stands out from pure GIS tools by making map creation accessible to anyone, regardless of design or technical experience. The drag-and-drop editor lets you build color-coded choropleth maps, add data overlays, and create interactive maps that can be embedded directly on websites.
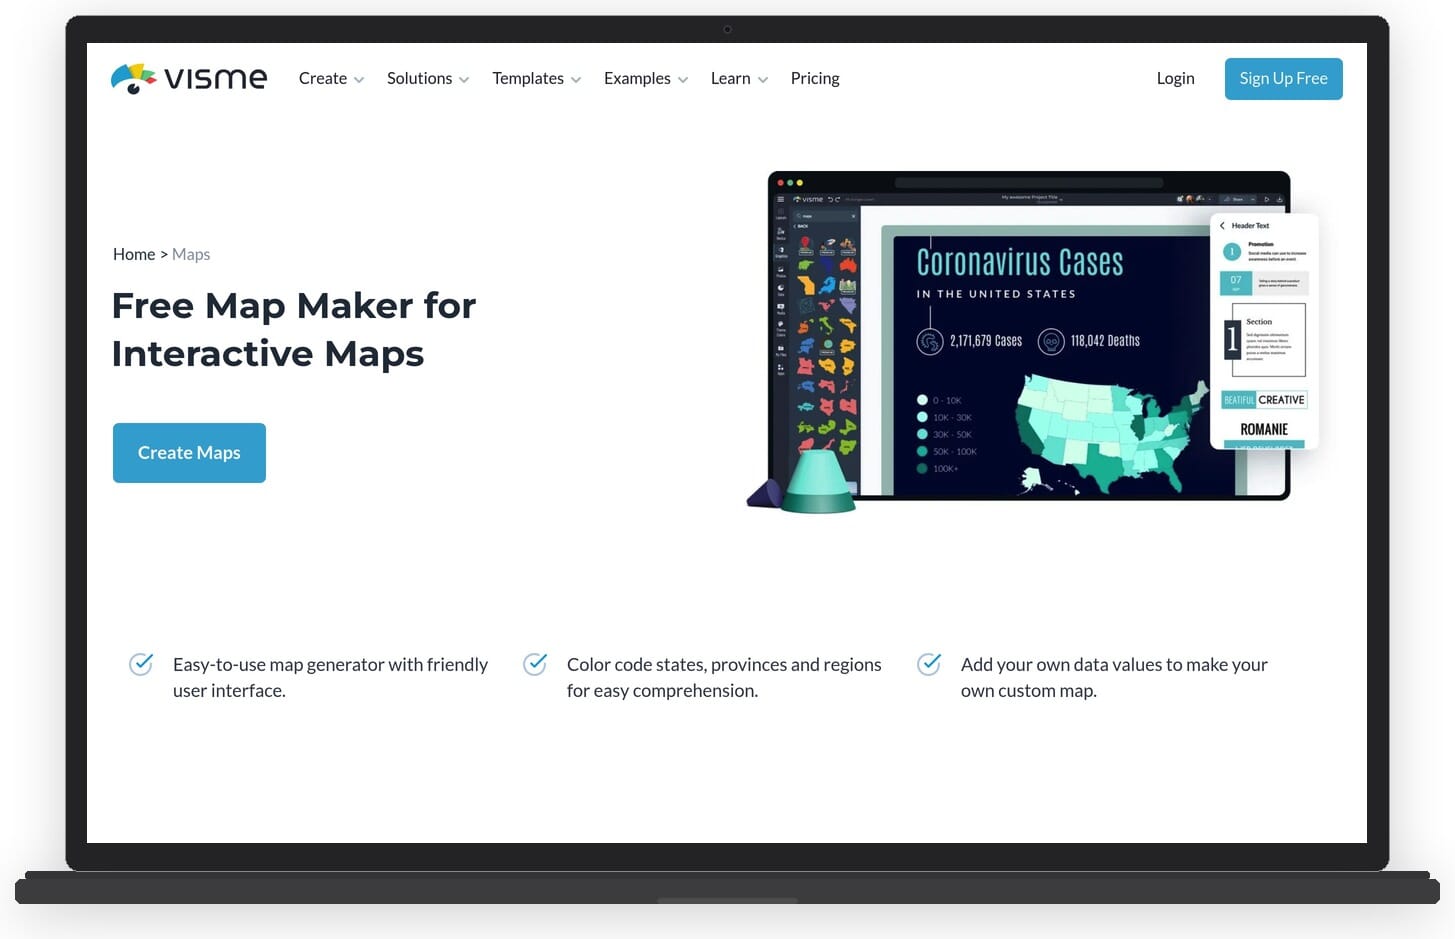
What makes Visme particularly appealing for map making is its template library. There are dozens of pre-designed map templates covering world maps, individual countries, and regional breakdowns. You can import your own data, assign color ranges to values, and enable hover effects that display detailed information when viewers interact with the map. The platform also supports custom branding, so maps can match your organization’s visual identity.
Beyond maps, Visme is a full design suite for infographics, presentations, reports, and social media graphics. This makes it a strong choice for anyone who needs mapping as part of a broader visual content workflow rather than a standalone GIS tool.
Key features:
- Interactive map generator with hover effects and data overlays
- World, continent, and individual country map templates
- Custom color coding with automatic data-driven ranges
- Embed interactive maps on websites or download as images
- Brand kit integration (custom fonts, colors, logos)
- Millions of stock photos and icons for map enhancement
- Collaboration tools for team projects
Pricing: Free plan available with limited features and Visme branding. Starter plan at $29/month, Pro plan at $59/month (billed monthly). Paid plans unlock high-resolution downloads, brand customization, and remove Visme watermarks. Enterprise pricing available on request.
Best for: Marketers, educators, and content creators who need polished, interactive maps as part of a broader visual content workflow.
Pros:
- Extremely easy to use with no design or coding skills required
- Beautiful templates that produce professional results quickly
- Interactive maps can be embedded on any website
- Doubles as a full design platform (infographics, presentations, etc.)
- Regular updates with new templates and features
Cons:
- Free plan is quite limited (Visme branding, fewer exports)
- Not a full GIS tool – lacks advanced spatial analysis capabilities
- Monthly pricing can add up compared to one-time purchase alternatives
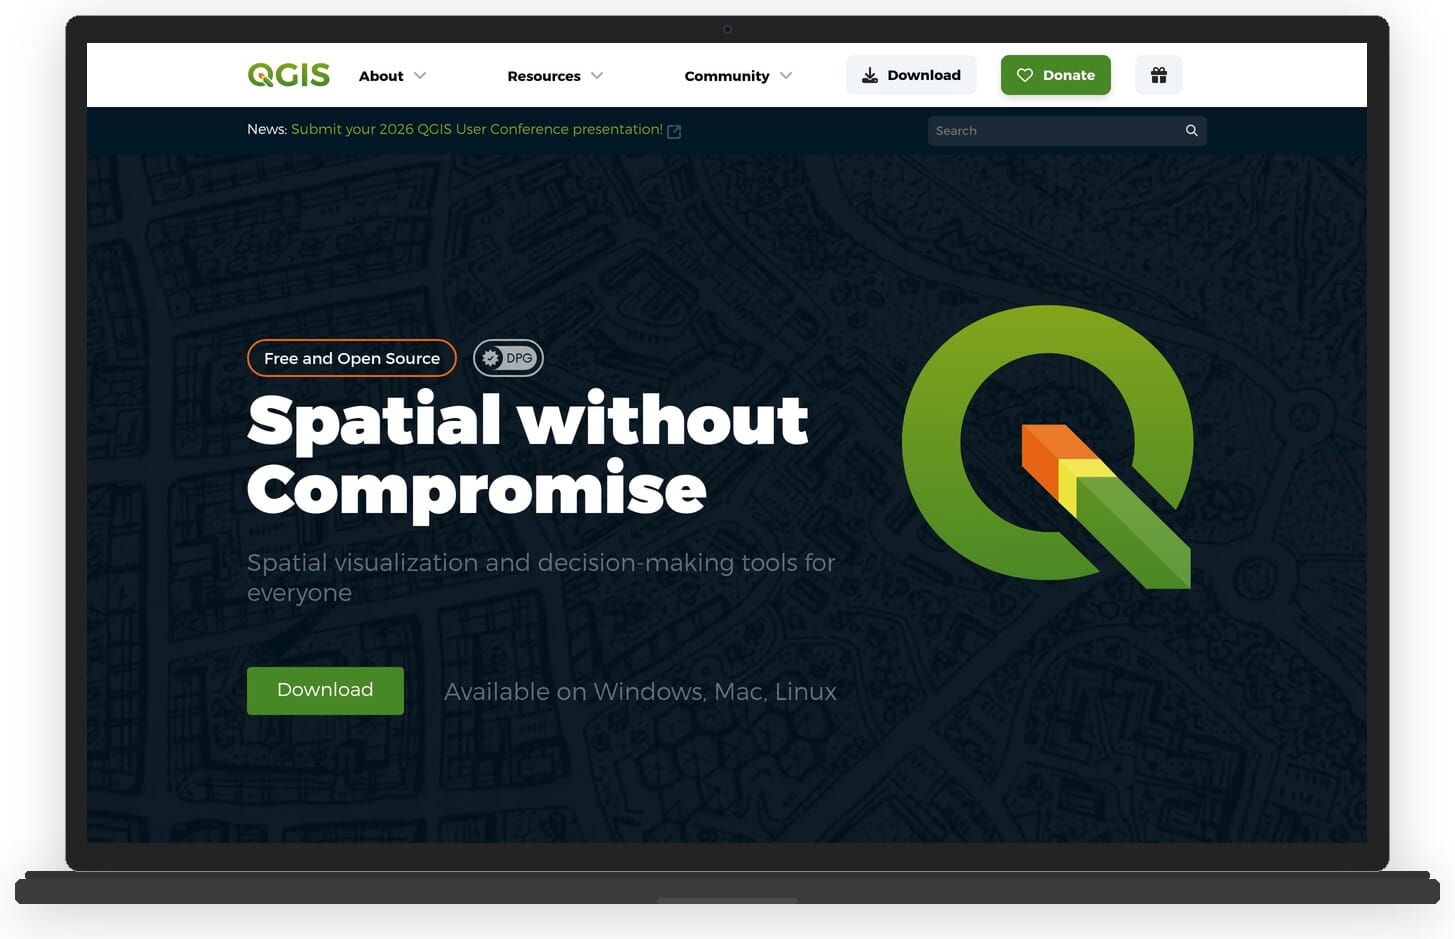
2. QGIS
QGIS is the most powerful free and open-source GIS software available. It runs on Windows, macOS, and Linux, and provides a full desktop GIS environment capable of creating, editing, analyzing, and publishing geospatial data. For anyone who needs serious mapping capabilities without paying for enterprise software, QGIS is the go-to option.
The software supports a wide range of raster and vector data formats, connects to spatial databases like PostGIS, and includes hundreds of geoprocessing tools. Its plugin ecosystem extends functionality even further, with community-built extensions for everything from terrain analysis to web map publishing.
Key features:
- Full desktop GIS with advanced spatial analysis tools
- Support for raster, vector, and database formats (Shapefiles, GeoJSON, PostGIS, etc.)
- Print layout composer for creating publication-ready maps
- Extensive plugin ecosystem with 1,000+ extensions
- Python scripting for automation and custom workflows
- 3D map visualization support
Pricing: Completely free and open-source.
Best for: GIS professionals, researchers, and advanced users who need powerful spatial analysis without licensing costs.
Pros:
- 100% free with no feature limitations
- Rivals commercial GIS software in capabilities
- Active open-source community with regular updates
- Cross-platform (Windows, macOS, Linux)
Cons:
- Steep learning curve for beginners
- Interface can feel overwhelming compared to simpler tools
- No built-in web hosting for interactive maps
3. Google My Maps
Google My Maps is a free map creation tool built on top of Google Maps. It allows anyone with a Google account to create custom maps with markers, lines, shapes, and imported data layers. Maps are automatically saved to Google Drive and can be shared or embedded on websites.
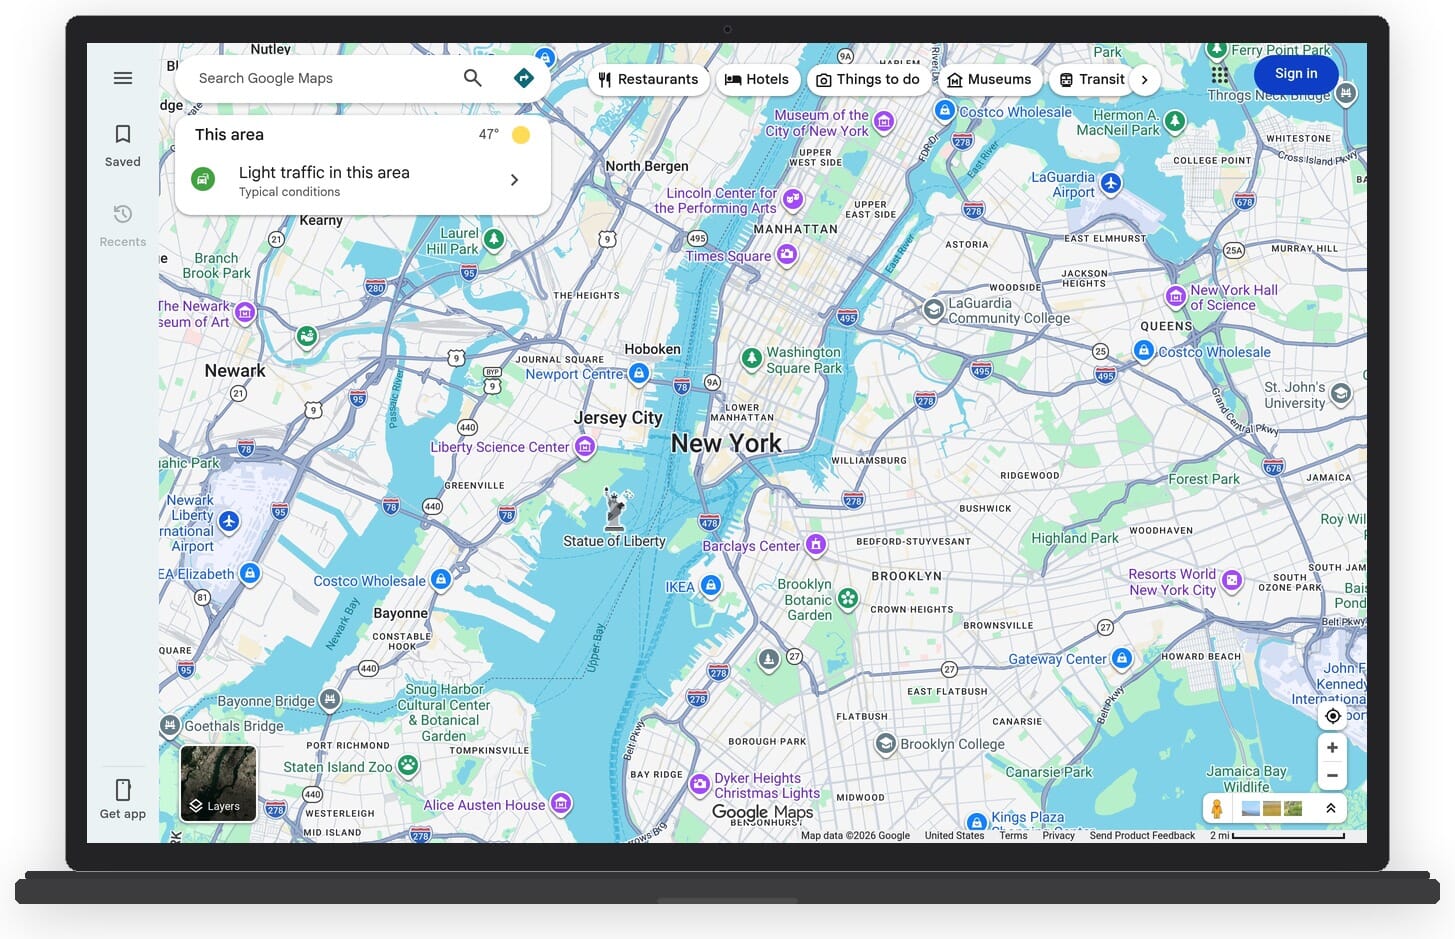
The tool is ideal for quick, simple map projects. You can add custom markers with descriptions and photos, draw routes and boundaries, import data from spreadsheets or CSV files, and organize information into multiple layers. The familiar Google Maps base layer means your custom data sits on top of accurate, regularly updated map tiles.
Key features:
- Custom markers with descriptions, photos, and videos
- Import data from CSV, XLSX, KML, and Google Sheets
- Multiple data layers for organizing information
- Draw lines, routes, and shapes directly on the map
- Share and collaborate via Google Drive
- Embed maps on websites
Pricing: Completely free.
Best for: Beginners and casual users who need simple custom maps quickly, with no software to install.
Pros:
- Free with no limitations on map creation
- Dead simple to use – no learning curve
- Built on Google Maps with reliable base data
- Easy sharing and embedding
Cons:
- Very limited styling and customization options
- No choropleth maps or data visualization features
- Maximum of 10 layers and 2,000 rows per layer
- No advanced analysis or GIS features
4. Mapbox
Mapbox is a developer-focused mapping platform used by companies like Strava, The New York Times, and Instacart. It provides APIs and SDKs for building custom map experiences in web and mobile applications. Mapbox Studio, its visual map editor, allows you to design custom map styles with full control over colors, typography, and data layers.
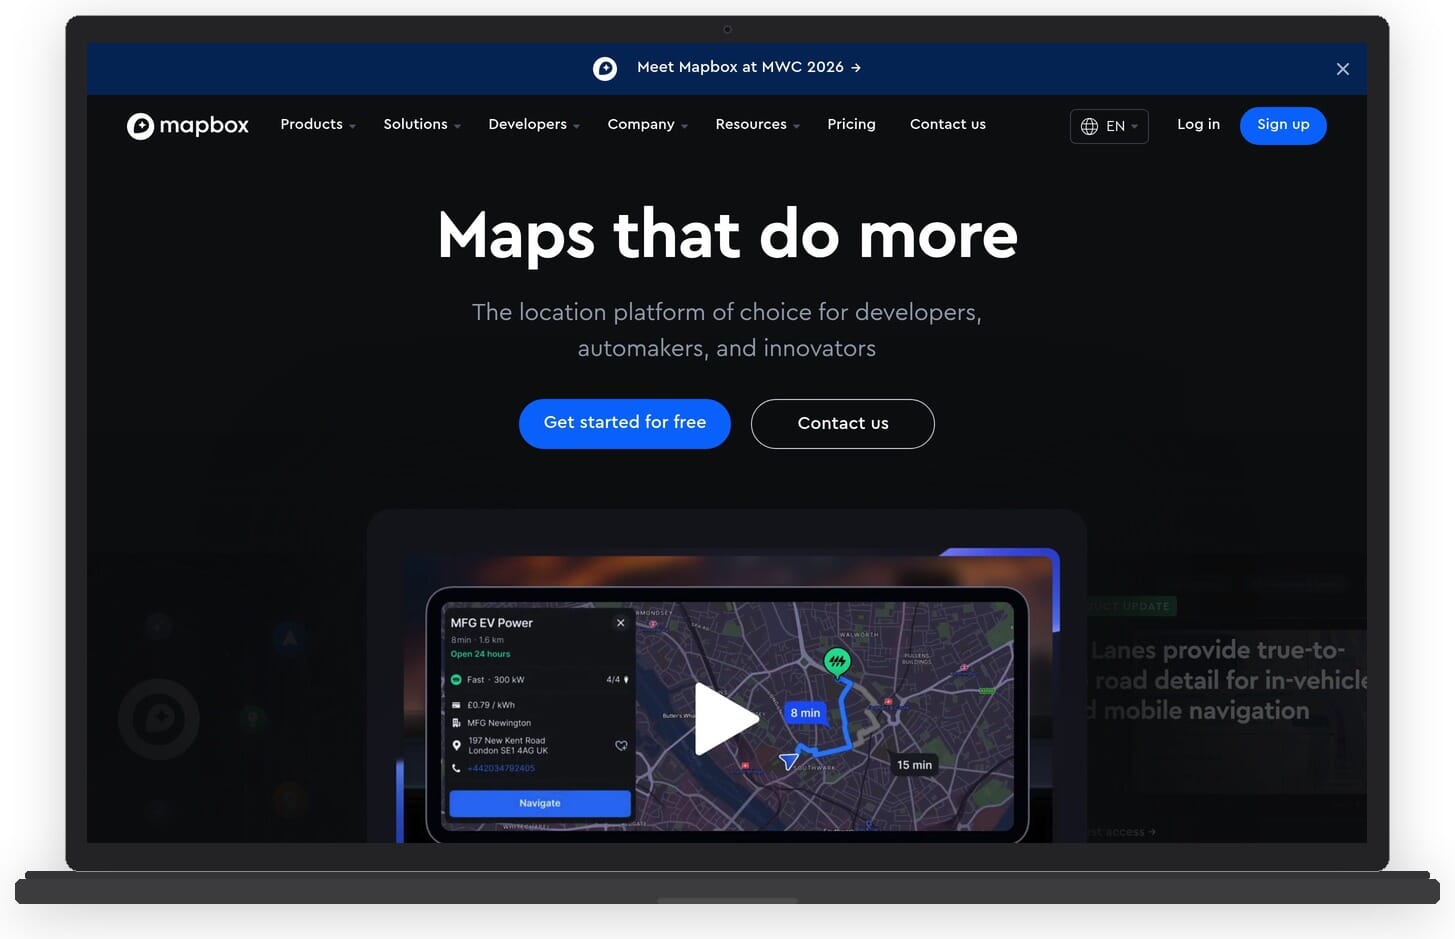
Unlike simpler map makers, Mapbox is designed for integration into applications. It handles large datasets efficiently, supports real-time data updates, and offers features like geocoding, navigation, and 3D terrain rendering. The platform uses vector tiles for fast performance even with millions of data points.
Key features:
- Mapbox Studio for custom map style design
- JavaScript, iOS, and Android SDKs for app integration
- Vector tile rendering for fast performance with large datasets
- 3D terrain, satellite imagery, and custom tilesets
- Geocoding, search, and navigation APIs
- Real-time data streaming support
Pricing: Generous free tier (50,000 map loads/month for web, 25,000 for mobile). Pay-as-you-go pricing beyond free limits. Mapbox Studio is free to use.
Best for: Developers and teams building custom mapping features into websites and applications.
Pros:
- Unmatched customization and design control
- High performance with massive datasets
- Generous free tier for small projects
- Beautiful default map styles
Cons:
- Requires coding knowledge to use fully
- Not a point-and-click map maker – developer-oriented
- Costs can scale quickly at high usage volumes
5. ArcGIS Online
ArcGIS Online by Esri is the industry standard for professional GIS work. It is a cloud-based mapping and spatial analysis platform used by governments, utilities, environmental agencies, and large organizations worldwide. The platform combines map creation with powerful analytical tools, making it far more than a simple map maker.
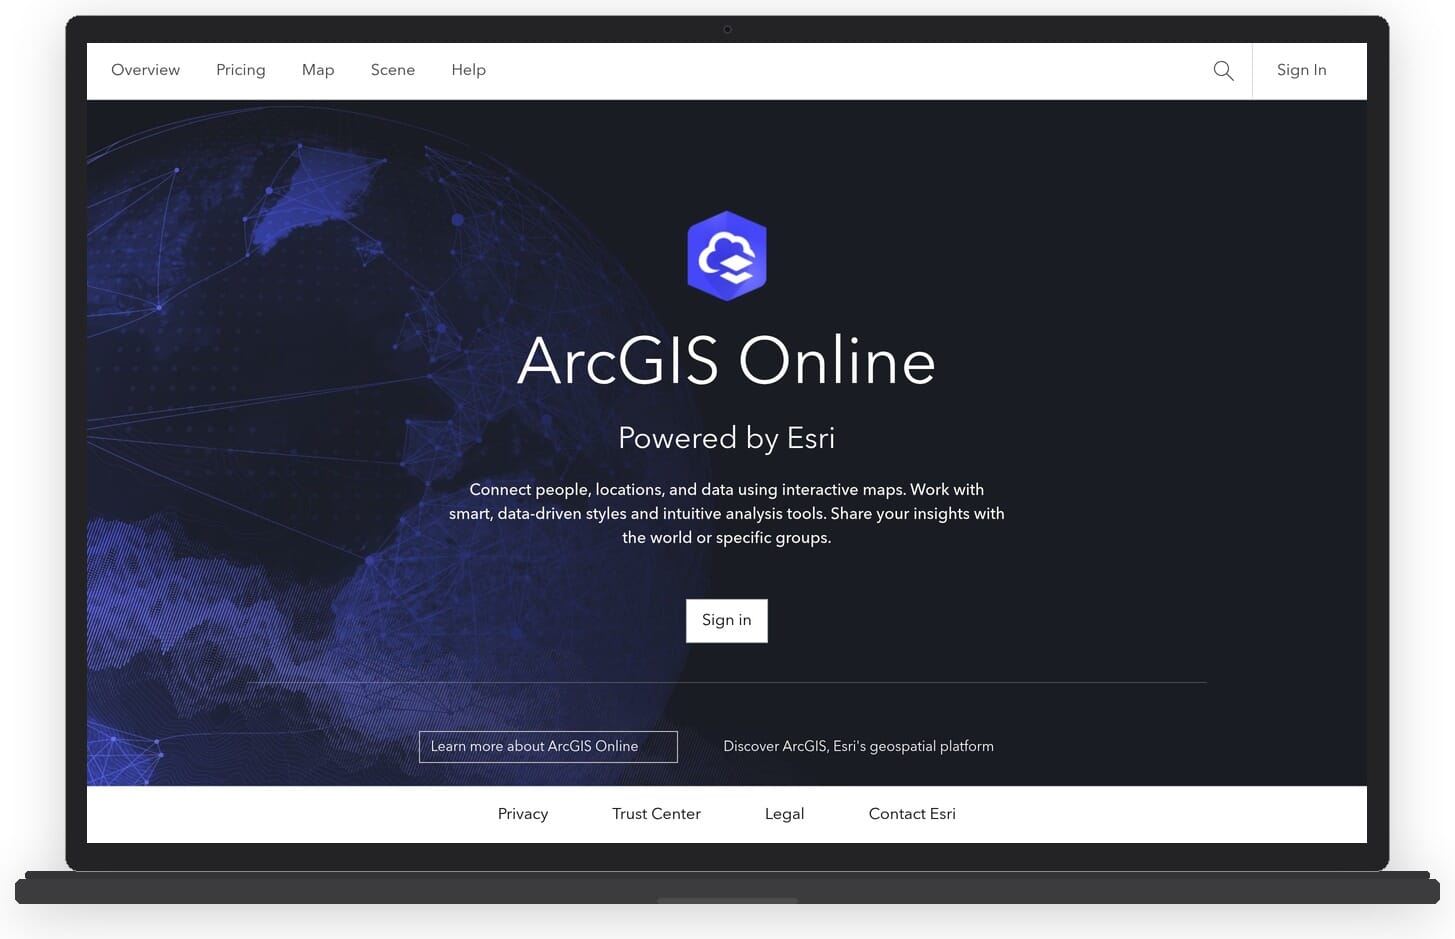
ArcGIS Online offers web-based map building, data collection tools, spatial analysis, and the ability to create interactive dashboards and story maps. It integrates with ArcGIS Pro (the desktop application) for advanced workflows. The platform includes access to Esri’s extensive basemap library and Living Atlas of the World, which contains curated geographic datasets.
Key features:
- Web-based map builder with drag-and-drop data layers
- Spatial analysis tools (proximity, overlay, density)
- Story Maps for narrative-driven geographic content
- Living Atlas with thousands of curated datasets
- Field data collection via mobile apps
- Interactive dashboards for real-time monitoring
Pricing: Creator license starts at $100/year per user (as of early 2026). Organization plans with multiple user types available. Free public account with limited functionality.
Best for: GIS professionals, government agencies, and organizations that need enterprise-grade spatial analysis and mapping.
Pros:
- Industry-leading GIS platform with the deepest feature set
- Massive curated data library (Living Atlas)
- Strong collaboration and enterprise features
- Excellent documentation and training resources
Cons:
- Expensive for individual users or small teams
- Can be overwhelming for non-GIS users
- Credit-based system for premium analysis can be confusing
6. Datawrapper
Datawrapper is a data visualization tool used by major newsrooms including The Washington Post, The Guardian, and Reuters. While it covers charts and tables too, its map capabilities are particularly strong. Datawrapper supports choropleth maps, symbol maps, and locator maps, all built through a clean, step-by-step interface that requires no coding.
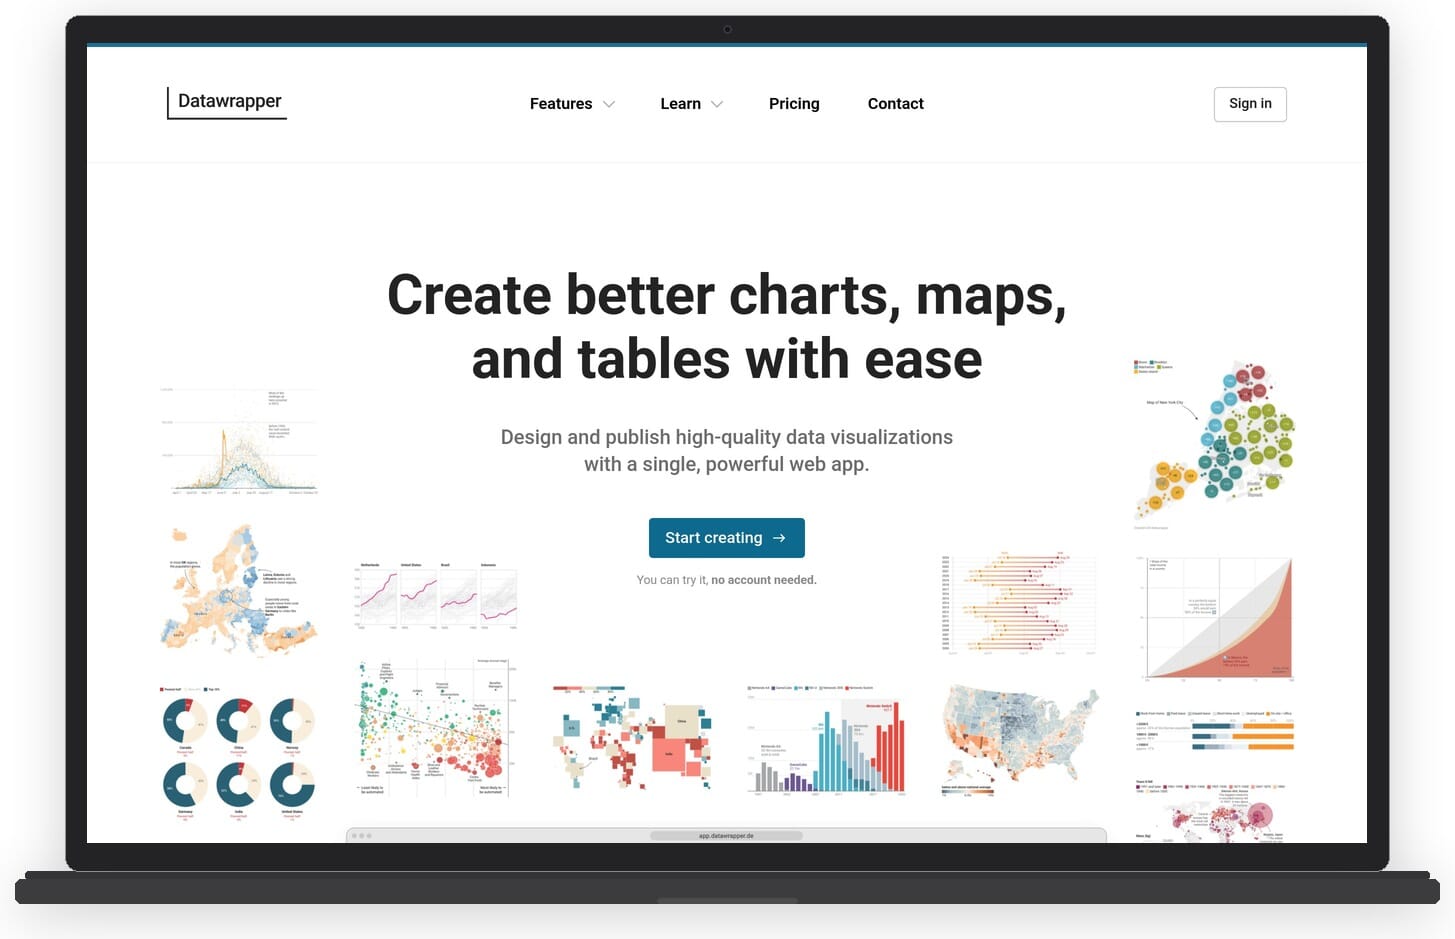
The tool excels at turning data into publication-quality maps quickly. You can paste data directly from a spreadsheet, and Datawrapper automatically matches it to geographic boundaries. Maps are responsive, accessible, and can be embedded on any website with a single line of code.
Key features:
- Choropleth, symbol, and locator map types
- Step-by-step map creation workflow
- Automatic geographic boundary matching
- Responsive maps with hover tooltips
- Export as PNG, SVG, or PDF (paid plans)
- Upload custom GeoJSON boundaries
Pricing: Free plan for publishing maps with Datawrapper attribution. Custom plan at $599/month for white-label branding and additional exports. Enterprise pricing on request.
Best for: Journalists, data analysts, and content teams who need to create data-driven maps quickly for publication.
Pros:
- Extremely intuitive interface – maps in minutes
- Publication-quality output trusted by major newsrooms
- Free plan is genuinely useful for basic needs
- Responsive and accessible maps by default
Cons:
- Paid plan is expensive ($599/month) with a large jump from free
- Limited map types compared to full GIS tools
- Free maps include Datawrapper branding
7. Infogram
Infogram is a data visualization platform that offers over 550 map templates for countries and regions worldwide. Like Datawrapper, it focuses on making data visualization accessible to non-technical users. Maps can be combined with charts, text, and images to create complete infographic-style reports.
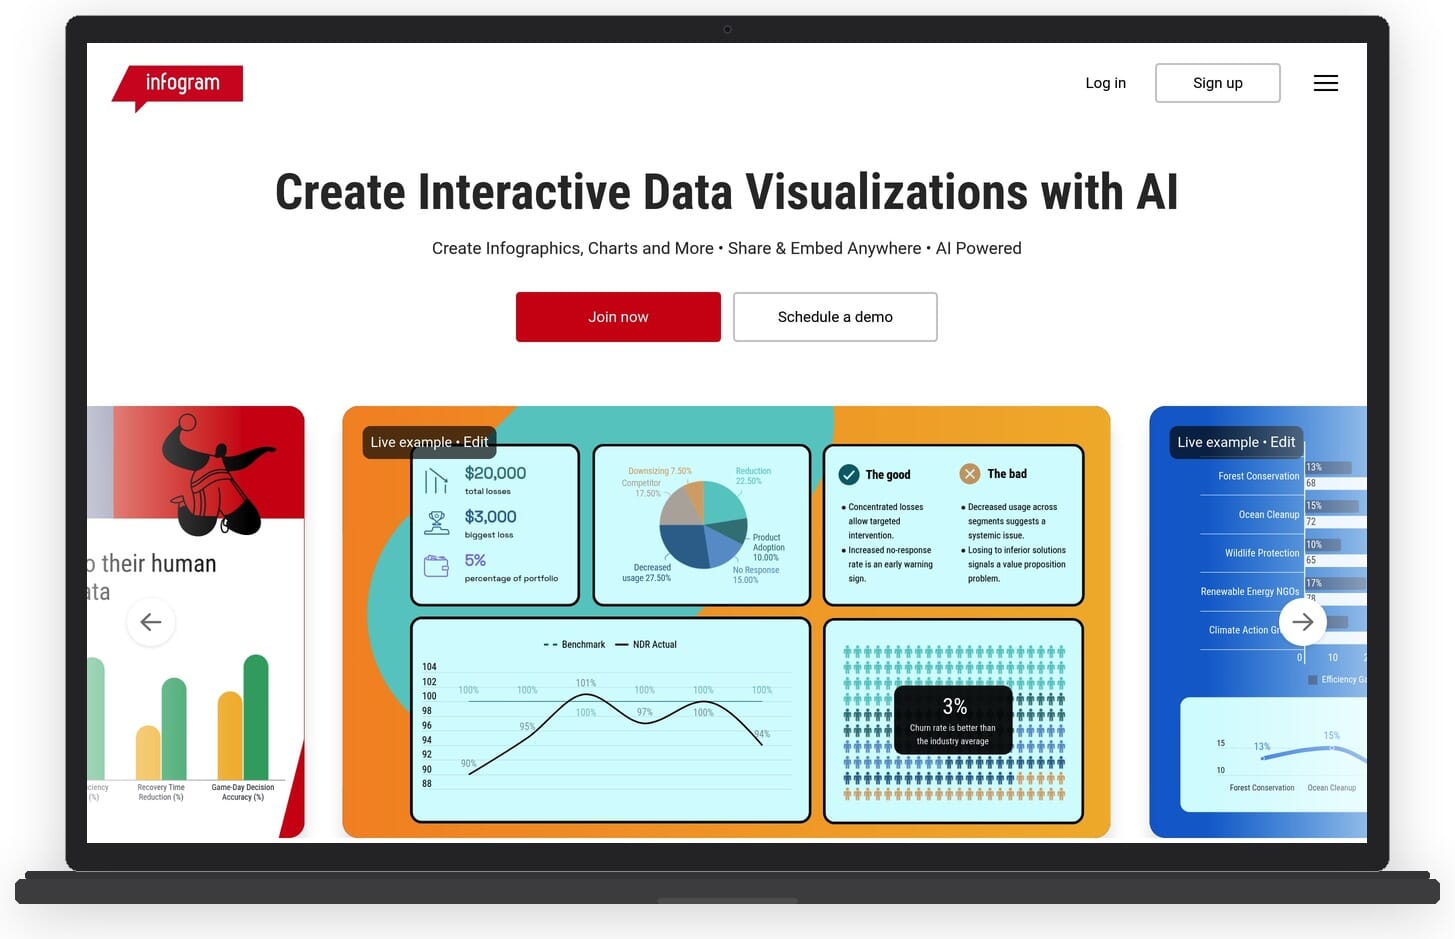
Infogram supports interactive features including hover effects, click-through data, and animated transitions. It also connects to live data sources via API or Google Sheets, allowing maps to update automatically as underlying data changes. This makes it useful for dashboards and ongoing reporting.
Key features:
- 550+ country and regional map templates
- Heat maps, icon maps, cartograms, and marker maps
- Live data connections via API and Google Sheets
- Interactive elements with hover and click behaviors
- Team collaboration and brand management tools
- Combine maps with charts and text in single projects
Pricing: Free plan with Infogram branding. Pro plan starts at $19/month. Business and Enterprise plans available for teams.
Best for: Marketing teams and communicators who need to combine maps with other data visualizations in a single report or infographic.
Pros:
- Huge template library with global coverage
- Combines maps with charts in unified projects
- Live data connections keep maps up to date
- Affordable Pro plan compared to competitors
Cons:
- Map customization is less flexible than dedicated mapping tools
- Free plan includes branding and limited exports
- No GIS or spatial analysis capabilities
8. Mapme
Mapme specializes in creating interactive, embeddable maps for websites. It is particularly popular with tourism boards, real estate companies, universities, and organizations that need to present location-based content in a visually appealing way. Unlike data-heavy GIS tools, Mapme focuses on storytelling through maps.
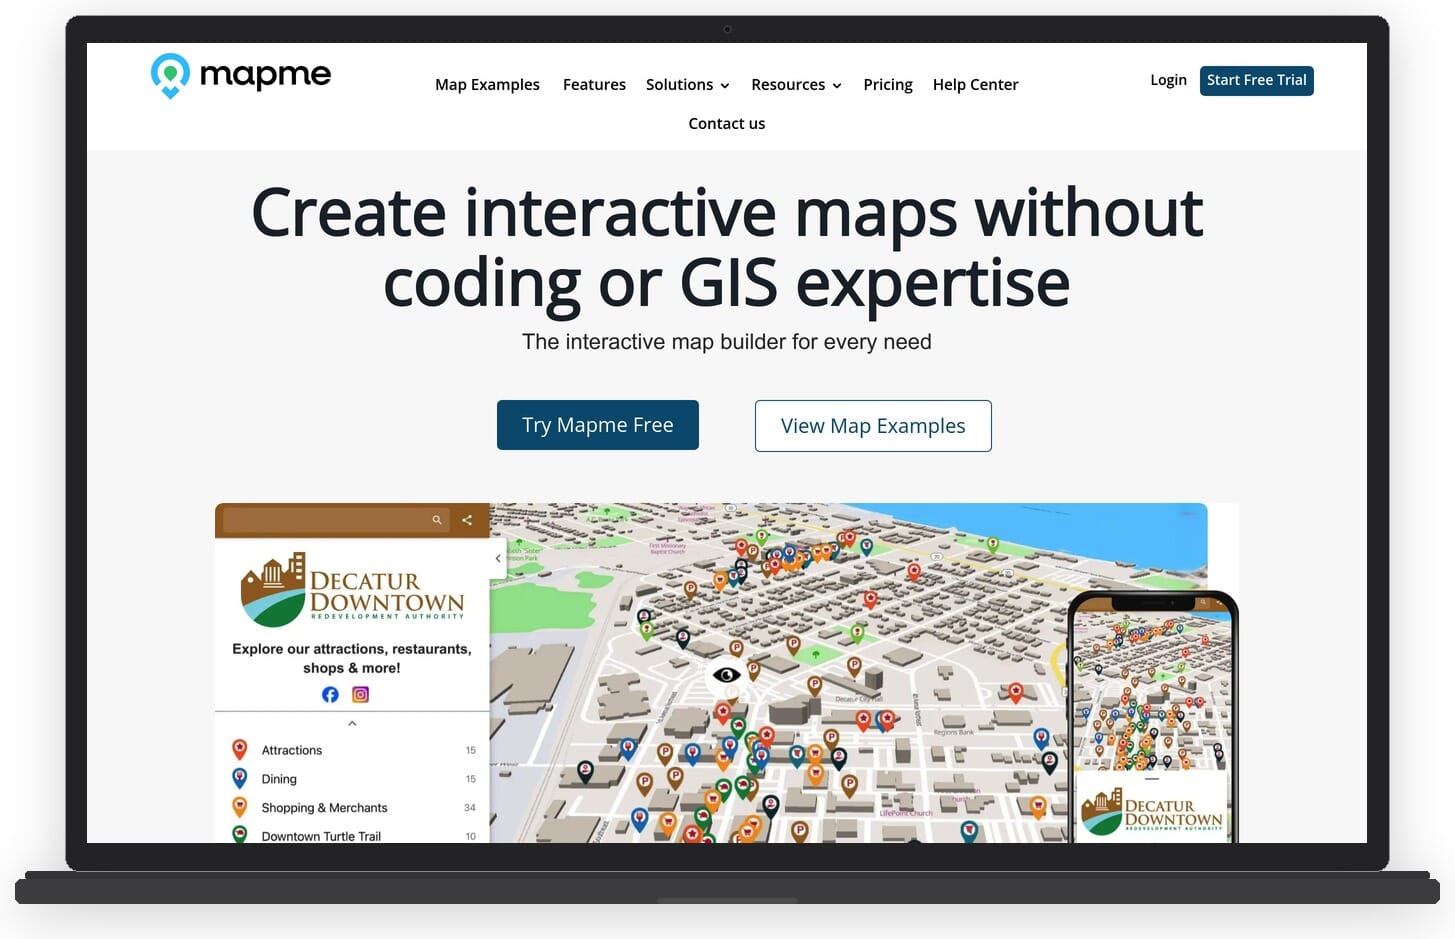
Each location on a Mapme map can include rich content: descriptions, images, videos, links, and custom categories with color-coded pins. The platform includes filtering and search capabilities, making it easy for users to explore maps with many locations. Maps are responsive and embed seamlessly on any website.
Key features:
- Rich content cards with images, videos, and descriptions per location
- Category-based filtering and search
- Custom map styles and branding
- Embeddable responsive maps
- Analytics for map engagement tracking
- Crowdsourcing feature for community-contributed locations
Pricing: Free plan for up to 3 maps with limited features. Pro plan starts at $49/month. Business and Enterprise plans available.
Best for: Tourism boards, real estate firms, event organizers, and anyone who needs rich, interactive location-based content on a website.
Pros:
- Beautiful, content-rich map experiences
- Easy to embed and share
- No coding required
- Built-in analytics for tracking engagement
Cons:
- Not a data visualization or GIS tool
- Free plan is very limited (3 maps)
- Less suitable for statistical or analytical mapping
9. Scribble Maps
Scribble Maps takes a straightforward approach to map making: open the editor and start drawing. The browser-based tool lets you draw shapes, add markers, import data, and annotate maps without any account setup for basic use. It is popular with educators, small businesses, and anyone who needs to quickly sketch ideas on a map.
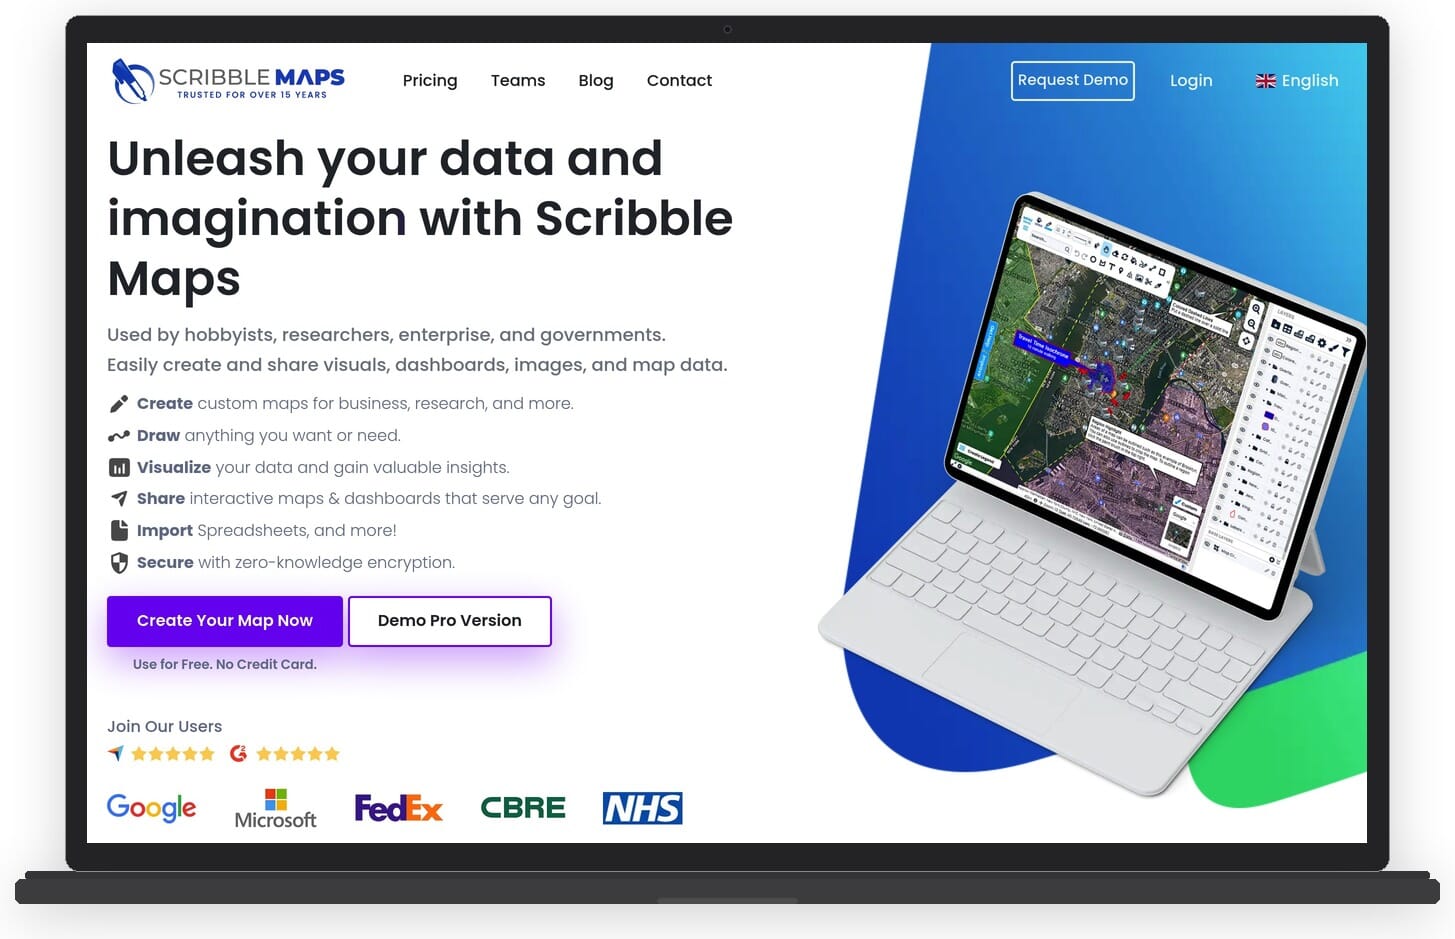
The tool supports importing KML, GeoJSON, and spreadsheet data, and can export maps in various formats including image files, KML, and PDF. Scribble Maps also offers a heat map feature and basic territorial mapping for sales regions or delivery zones.
Key features:
- Freehand drawing and annotation tools on maps
- Import/export KML, GeoJSON, CSV, and Shapefiles
- Heat map generation
- Territory and radius mapping
- Export as images, PDF, or KML
- Multiple base map styles (satellite, terrain, street)
Pricing: Free basic access. Pro plan at $16/month. Team and Enterprise plans available for organizations.
Best for: Educators, sales teams, and small businesses who need to quickly draw on maps and share visual plans.
Pros:
- Instant access – no sign-up needed for basic use
- Intuitive drawing and annotation tools
- Good import/export format support
- Affordable Pro plan
Cons:
- Interface looks dated compared to modern alternatives
- Limited data visualization options
- No interactive or embeddable map features in the free plan
10. Maptive
Maptive is a business-focused mapping platform designed for organizations that need to map large datasets. Built on top of Google Maps, it combines geocoding, territory management, route optimization, and demographic data analysis in one package. It handles datasets with 200,000+ markers without performance issues.
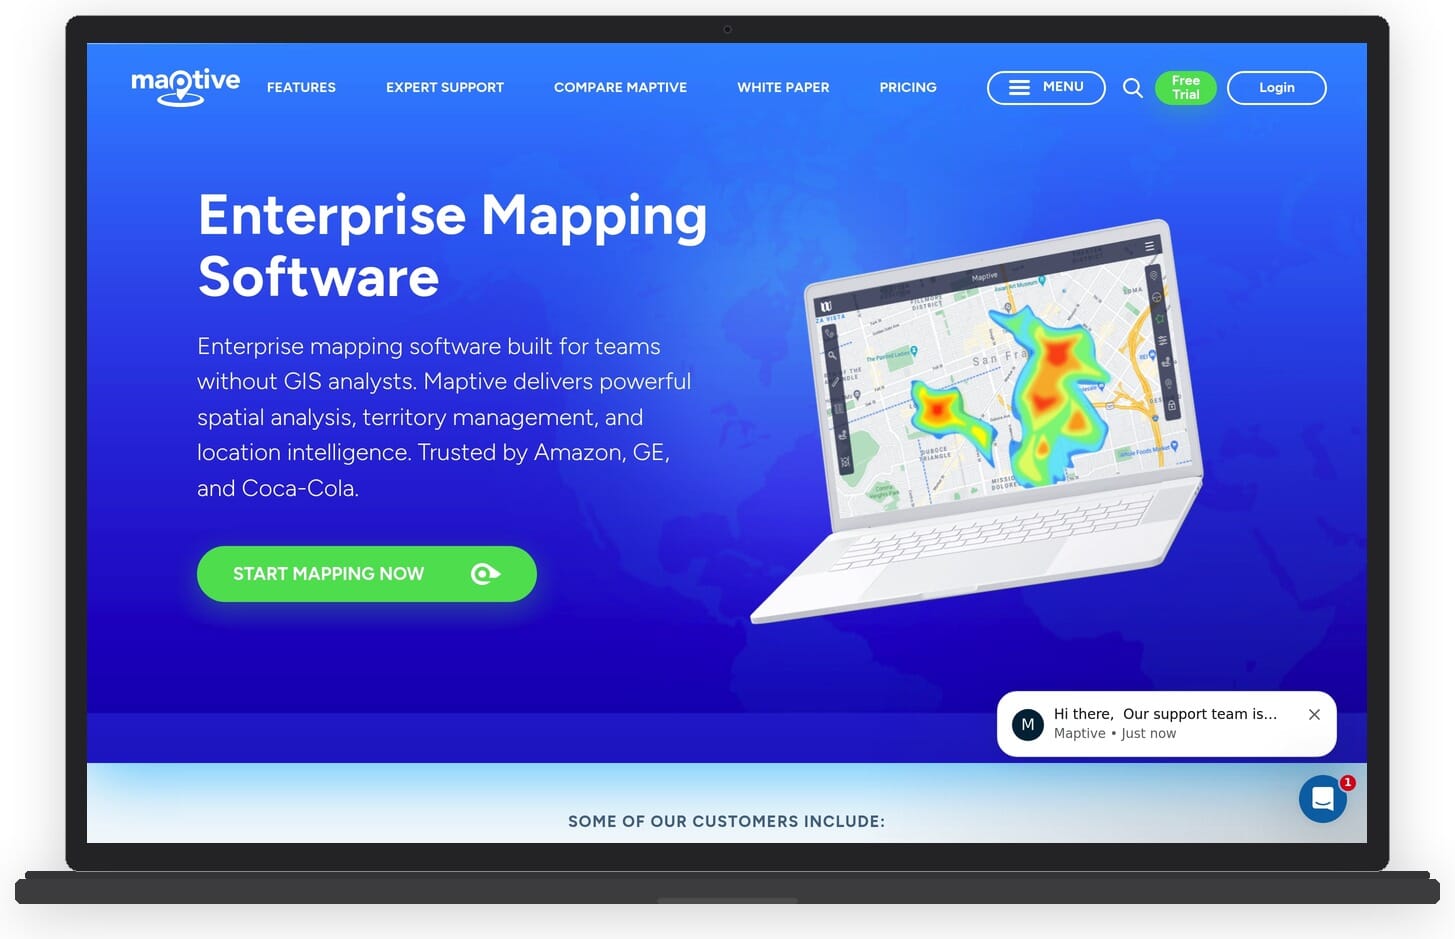
The platform is particularly strong for sales territory planning, customer analysis, and location intelligence. You can upload spreadsheet data, and Maptive automatically geocodes addresses and plots them on the map. Features like heat maps, radius searches, and drive time analysis help businesses make data-driven location decisions.
Key features:
- Automatic geocoding of addresses from spreadsheets
- Territory management and sales region mapping
- Heat maps, clustering, and density visualization
- Route optimization for deliveries and field teams
- Drive time and radius analysis
- Demographic data overlays
Pricing: Plans start at $250/month for the Pro tier (as of early 2026). Team and Enterprise plans scale up to $2,500/month. Free trial available.
Best for: Sales teams, logistics companies, and businesses that need to analyze and visualize large location datasets for decision-making.
Pros:
- Handles very large datasets (200K+ markers)
- Comprehensive business mapping features
- Built on reliable Google Maps infrastructure
- Strong route optimization and territory tools
Cons:
- Expensive – starting at $250/month puts it out of reach for individuals
- Overkill for simple map creation needs
- No free plan (only a trial)
11. BatchGeo
BatchGeo does one thing and does it well: it turns spreadsheet data into maps. Paste your addresses, zip codes, or coordinates into the input box, click a button, and BatchGeo geocodes the data and generates an interactive map. There is no simpler way to go from a list of locations to a visual map.
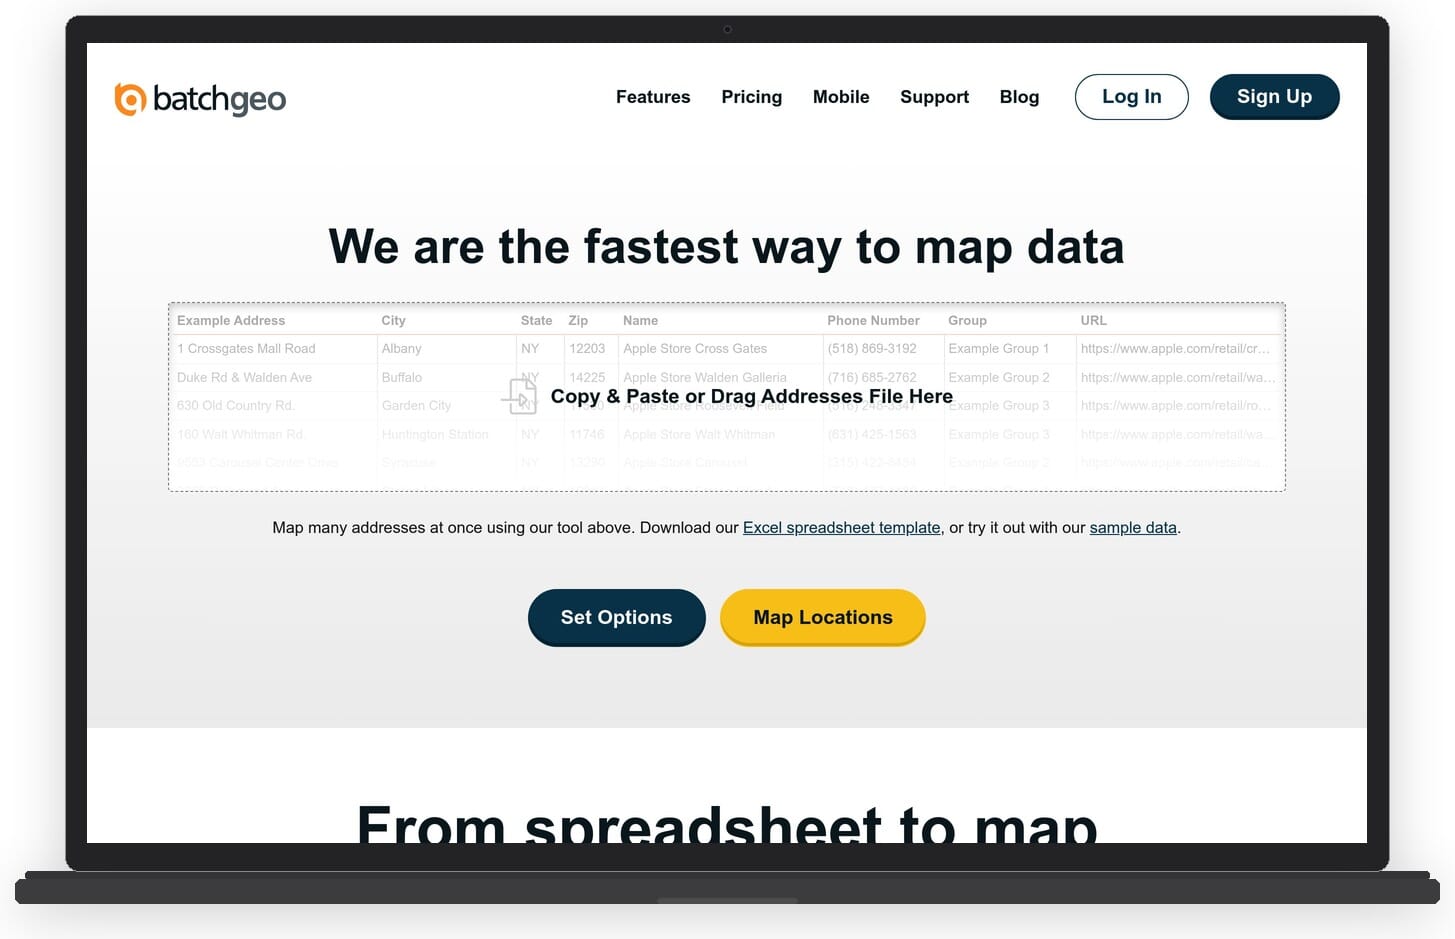
The resulting maps include clustering for dense areas, marker grouping, and basic filtering. Maps can be shared via link or embedded on websites. The Pro version adds features like PDF export, Street View integration, and the ability to save maps privately.
Key features:
- Paste-and-map workflow – paste spreadsheet data directly
- Automatic geocoding of addresses and zip codes
- Marker clustering for dense data
- Embeddable and shareable maps
- PDF export and Street View (Pro)
- Private and password-protected maps (Pro)
Pricing: Free tier for up to 250 locations. BatchGeo Pro at $99/year for unlimited locations and advanced features.
Best for: Anyone who needs to quickly plot a list of addresses or locations on a map with zero learning curve.
Pros:
- Fastest way to turn a spreadsheet into a map
- No account needed for basic use
- Very affordable Pro plan at $99/year
- Simple and focused – no feature bloat
Cons:
- Very limited customization and styling
- No choropleth or data visualization map types
- Free maps are publicly accessible
12. MapChart
MapChart is a free online tool for creating color-coded maps of countries, states, and regions. It is popular in education, social media, and casual map creation because of its simplicity. Pick a map type (world, continent, country), click on regions to color them, add a legend, and download the result as an image.
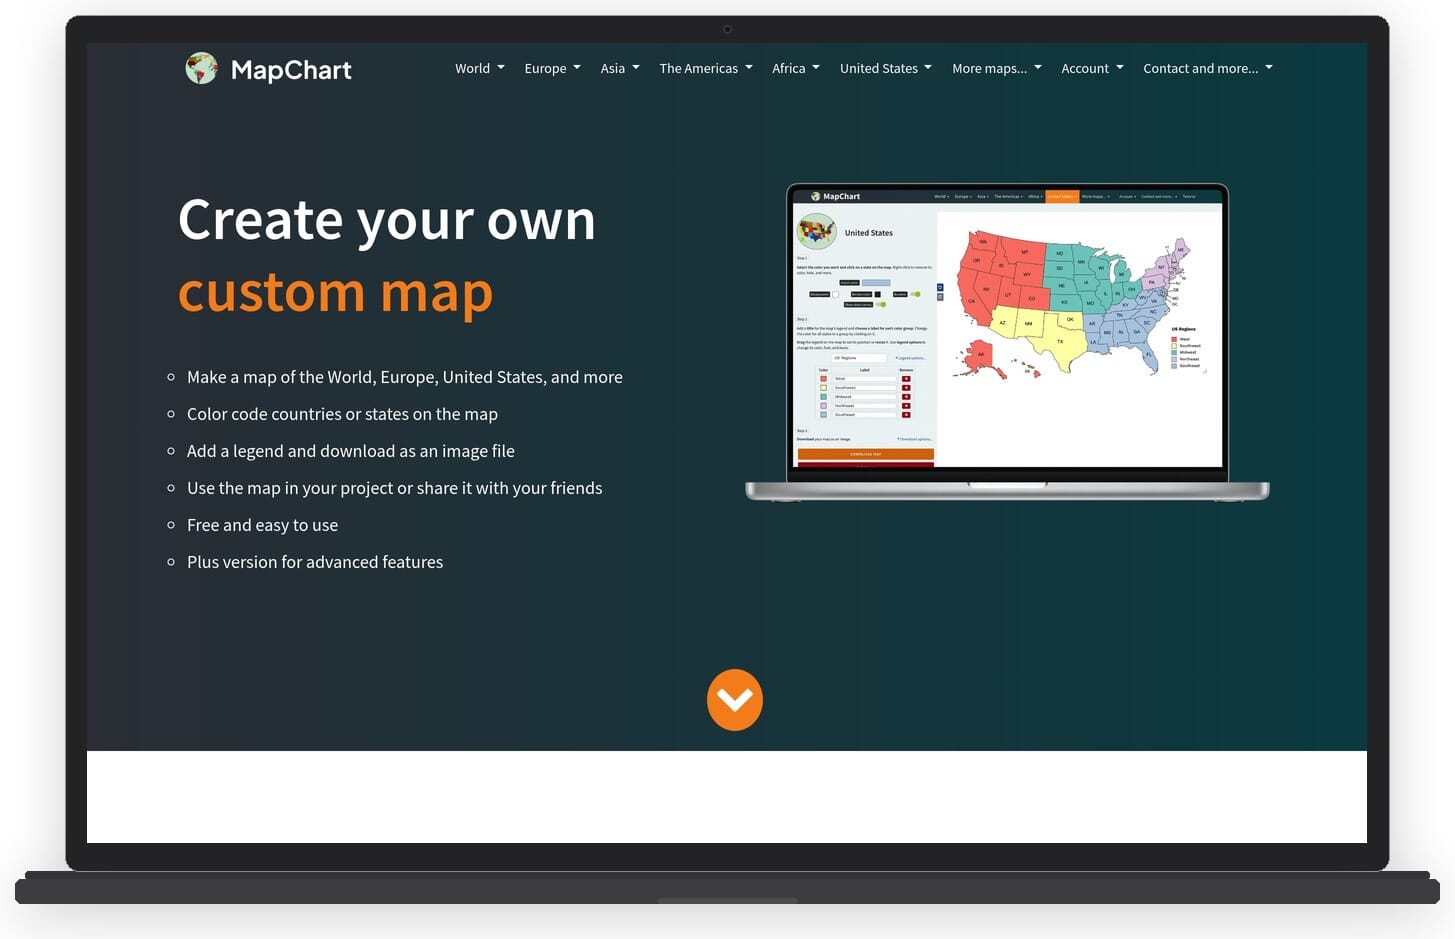
MapChart covers an impressive range of geographic templates including individual US states by county, European countries by region, and historical maps. While it lacks data import capabilities and interactivity, it is unbeatable for quickly creating static, color-coded maps for presentations or social media posts.
Key features:
- World, continent, country, and sub-regional map templates
- Simple click-to-color interface
- Custom legends and labels
- Download as PNG or SVG
- Historical and specialty maps (US counties, European regions)
- No account required
Pricing: Completely free.
Best for: Students, educators, and social media creators who need simple color-coded maps without any learning curve.
Pros:
- 100% free with no sign-up required
- Extremely simple to use
- Wide range of geographic templates including sub-regions
- SVG export for high-quality prints
Cons:
- Static images only – no interactive maps
- No data import or analysis features
- Very basic – limited to coloring regions
How to Choose the Right Map Making Software
The right map making software depends entirely on what you are trying to accomplish. Here are the key factors to consider:
Skill level and learning curve. If you have no GIS background, tools like Visme, Google My Maps, MapChart, and BatchGeo offer the lowest barrier to entry. If you are comfortable with more complex software, QGIS and ArcGIS provide far deeper capabilities.
Map type needed. For data-driven choropleth maps, Datawrapper, Infogram, and Visme are strong choices. For location-based content with rich descriptions and images, Mapme excels. For spatial analysis and professional cartography, QGIS and ArcGIS are the clear leaders. For custom maps in web applications, Mapbox is the developer’s choice.
Budget. Several excellent options are completely free: QGIS, Google My Maps, MapChart, and basic tiers of Datawrapper and BatchGeo. Mid-range options like Visme, Infogram, and Scribble Maps offer paid plans under $60/month. Enterprise tools like Maptive and ArcGIS target larger budgets.
Interactivity requirements. If your maps need to be interactive and embedded on a website, Visme, Mapme, Datawrapper, and Infogram all support this well. If you just need static images for presentations or print, MapChart and QGIS can produce high-quality outputs.
Data volume. For large datasets (thousands or hundreds of thousands of locations), Maptive and Mapbox handle scale best. For smaller datasets, most tools on this list will work fine.
Frequently Asked Questions
What is the best free map making software?
For professional-grade GIS work, QGIS is the best free option with no feature limitations. For simple custom maps, Google My Maps is the easiest starting point. For color-coded country maps, MapChart is completely free and requires no sign-up.
What is the easiest map making software to use?
Visme and Google My Maps are the easiest tools for creating maps without any technical background. Visme offers templates and drag-and-drop editing with professional results, while Google My Maps provides a familiar interface for anyone who has used Google Maps. BatchGeo is the simplest option if you just need to plot a list of addresses.
What is GIS software?
GIS (Geographic Information System) software is designed for creating, managing, analyzing, and mapping geographic data. It goes beyond simple map making by enabling spatial analysis, such as calculating distances, identifying patterns, and overlaying multiple data layers. QGIS and ArcGIS are the two most widely used GIS platforms.
Can I create interactive maps for my website?
Yes, several tools on this list support embeddable interactive maps. Visme, Datawrapper, Infogram, and Mapme all let you create interactive maps and embed them on any website with an embed code. Mapbox is the best option for building fully custom interactive map experiences for web applications.
What is the best map making software for business?
For business intelligence and location analytics, Maptive offers the most comprehensive feature set including territory management, route optimization, and demographic overlays. For creating branded maps and visual reports, Visme is a more accessible and affordable option. ArcGIS Online is the choice for organizations that need enterprise-grade GIS capabilities.
Conclusion
The best map making software for you depends on your specific needs, technical skill level, and budget. For most users looking for a versatile, easy-to-use tool that produces professional results, Visme is the top recommendation. It combines an intuitive drag-and-drop editor with interactive map capabilities, customizable templates, and the ability to create not just maps but complete visual content including infographics and presentations.
For users who need advanced GIS capabilities without spending anything, QGIS remains the gold standard in open-source mapping. Google My Maps is the fastest path to a simple custom map. And for developers building mapping features into applications, Mapbox provides unmatched flexibility and performance.
No matter which tool you choose, the landscape of map making software in 2026 offers more accessible and powerful options than ever before. From free click-and-color tools to enterprise spatial analysis platforms, there is a solution for every mapping need and budget.