Key Takeaways
- Pentagon released a second batch of UFO files. On May 22, 2026, the Department of Defense's AARO office published a second tranche of declassified UAP records at war.gov/UFO — cumulative archive now exceeds 200 files spanning the 1940s through the 2020s.
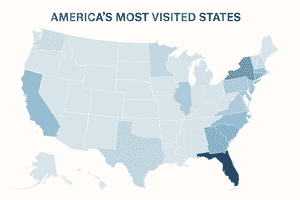
- California reports the most sightings. NUFORC's civilian database records 17,158 reports from California since 1974 — more than twice second-place Florida (8,880). Washington (7,633), Texas (6,719), and New York (6,346) round out the top five.
- 15 historic cases anchor the map. From Roswell (1947) to the USS Theodore Roosevelt's 'Gimbal' video (2015), the most-cited US UAP cases cluster in the Southwest desert, the Atlantic naval training ranges, and California's coastal flight paths.
- Apollo lunar imagery in this batch. The May 22 release includes photos from Apollo 12 and Apollo 17 of objects on the lunar surface — the first government-released material extending UAP review beyond Earth's atmosphere.
- Population isn't the whole story. California leads partly because of population, but Washington (3.6x the rate of Texas per million people) and Vermont (1.0/1k residents) over-index relative to size — suggesting military-base proximity and reporting-culture density also drive the numbers.
On Friday, May 22, 2026, the U.S. Department of Defense released its second batch of previously classified UFO files. The cumulative archive — now hosted at war.gov/UFO and curated by the Pentagon’s All-domain Anomaly Resolution Office (AARO) — exceeds 200 documents, photos, and videos spanning the 1940s to the 2020s, including imagery from Apollo 12 and Apollo 17 of objects on the lunar surface.
The release adds context to a question Americans have been asking for decades: where do UAP sightings happen? The official files don’t include a public state-by-state breakdown, but the civilian database compiled by the National UFO Reporting Center (NUFORC) does. Below: NUFORC’s state rankings, the 15 most-cited historical cases mapped, and the patterns that emerge when you compare them.
What’s in the May 22 release
The Pentagon’s AARO office released the second tranche of its PURSUE archive on May 22, 2026, continuing the rolling declassification that began with an initial 162-item batch earlier in 2026. Together the two batches comprise over 200 declassified files — a mix of incident reports, military pilot encounters, NASA imagery, FBI records, and State Department cables.
Notable inclusions in this round:
- Apollo 12 and Apollo 17 imagery — photos taken on the lunar surface showing objects that AARO has not yet classified, the first explicitly extraterrestrial-environment records in the public archive.
- Military pilot encounter logs from the 1950s through the 1990s, many previously redacted under standard 25-year declassification reviews.
- Inter-agency correspondence between the Pentagon, FBI, and State Department on individual cases.
- Continuing-investigation flagged records — AARO notes that “investigations into some of the materials released today are still ongoing,” signaling further releases.
AARO has stated that the public files do not contain proof of extraterrestrial origin for any case. The releases are described as a transparency exercise rather than a disclosure event.
15 most-cited US UAP/UFO cases — mapped
These are the cases that show up most often in the official declassified record and in academic UAP literature. The map below plots 13 of them across the lower 48 in chronological order (pin 1 = Battle of Los Angeles, 1942 → pin 13 = USS Roosevelt’s Gimbal, 2015), with the full case list in the legend. Two cases — JAL 1628 over Alaska (1986) and the Aguadilla, Puerto Rico, naval-radar incident (2013) — sit outside the contiguous frame and are described in the section below.
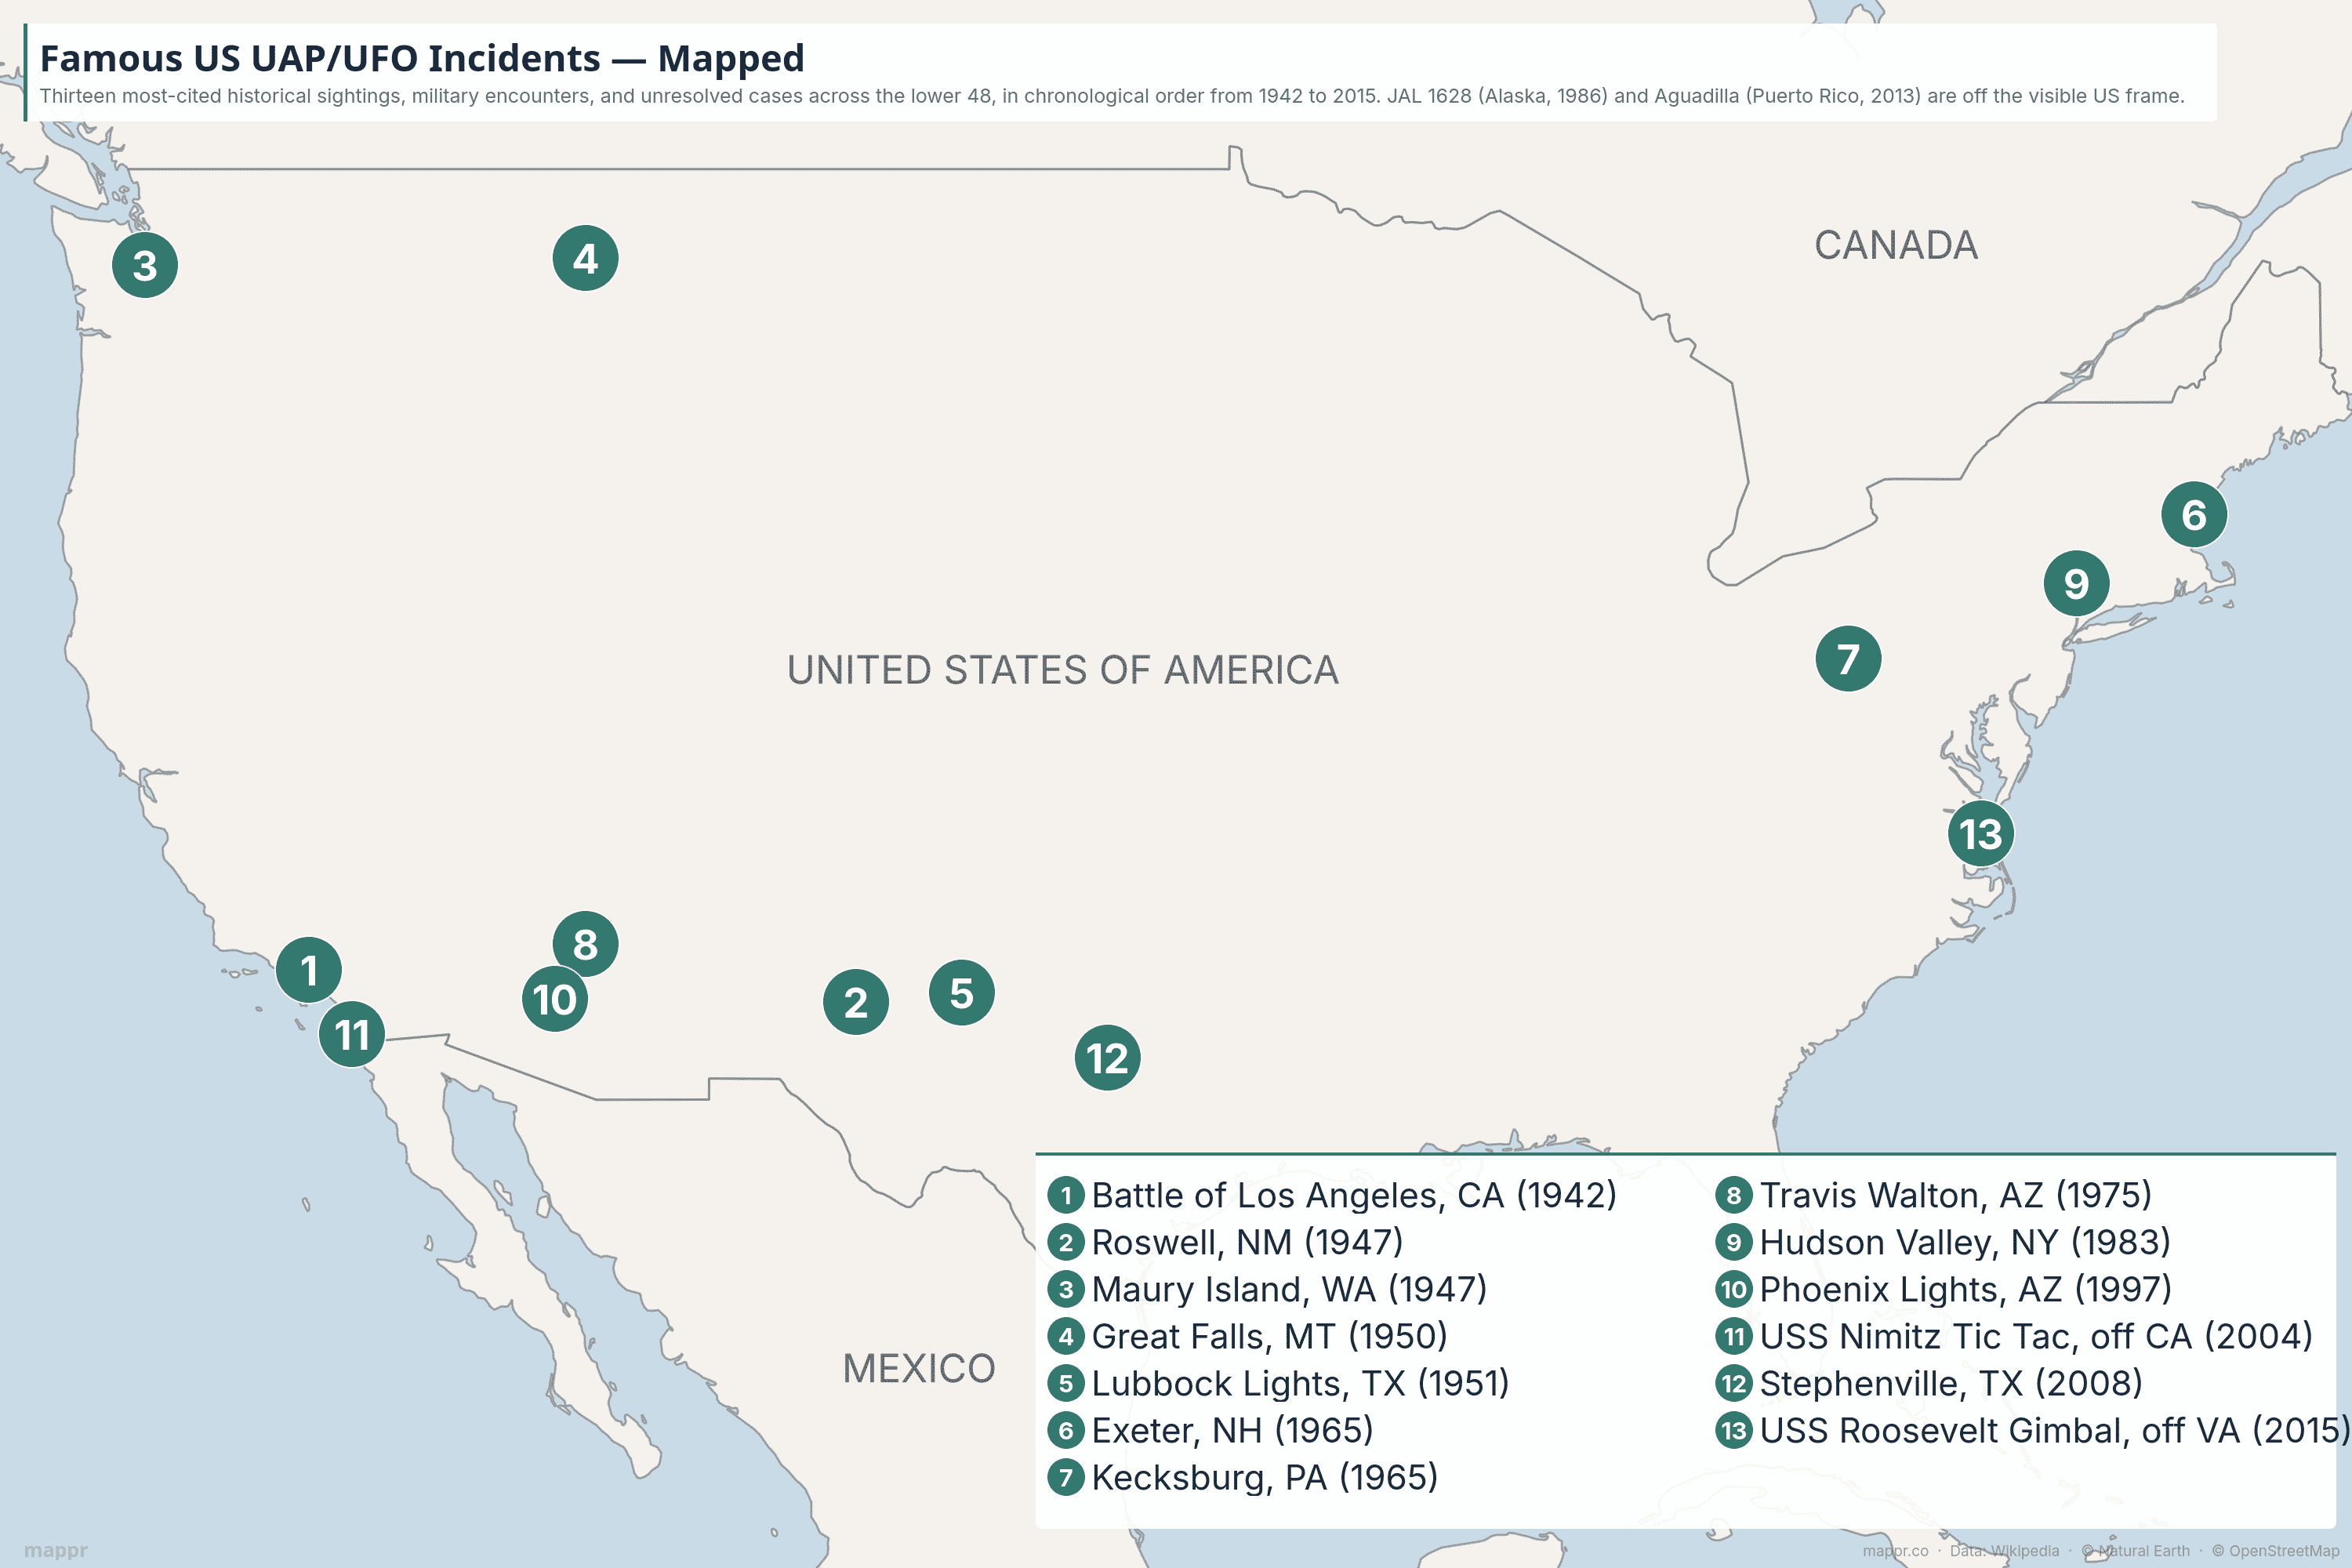
Three geographic clusters stand out: the Southwest desert corridor (Roswell, Phoenix, Lubbock, Stephenville, Travis Walton), the Atlantic naval training ranges (USS Roosevelt’s Gimbal off Virginia, scattered East-Coast carrier-strike-group incidents), and the California coast (Battle of Los Angeles 1942, USS Nimitz Tic Tac 2004). The clusters track airbases, naval ranges, and aviation flight paths more closely than they track population.
Where Americans report the most sightings
NUFORC has collected civilian UFO/UAP reports since 1974. Its public database is the most-cited counterpart to the official military record, and unlike the AARO archive it does include a clean state-by-state index. The top 15 states by cumulative report count:
NUFORC · Cumulative
Top 15 US states by UFO reports filed with NUFORC
Cumulative reports filed with the National UFO Reporting Center since 1974. Rankings reflect both population and reporting-culture density, not just sighting frequency.
| State | Reports | Notes |
|---|---|---|
| California | 17,158 | Aerospace + dense coastline + Tic Tac (2004) |
| Florida | 8,880 | Cape Canaveral, NAS Key West, Atlantic warning areas |
| Washington | 7,633 | Maury Island birthplace; Boeing aviation density |
| Texas | 6,719 | Lubbock Lights, Stephenville, military airspace |
| New York | 6,346 | Hudson Valley wave (1983); flight-path density |
| Pennsylvania | 5,395 | Kecksburg incident (1965) |
| Arizona | 5,347 | Phoenix Lights, Travis Walton, dark-sky observatories |
| Ohio | 4,728 | Wright-Patterson AFB region — Project Blue Book HQ |
| Illinois | 4,513 | O'Hare 2006 incident; large radar coverage |
| North Carolina | 3,913 | Atlantic test ranges; Fort Liberty proximity |
| Michigan | 3,902 | Great Lakes air-traffic corridors |
| Oregon | 3,812 | Pacific Northwest reporting culture |
| Colorado | 3,576 | NORAD Cheyenne Mountain; high-altitude visibility |
| New Jersey | 3,092 | Joint Base McGuire-Dix-Lakehurst |
| Missouri | 2,966 | Whiteman AFB, central-corridor flight paths |
Why California leads — and why Washington over-indexes
California’s 17,158 reports — twice Florida’s count and more than double third-place Washington’s — track three structural drivers. The state has the largest population of any in the union, the longest stretch of densely-populated coastline (which provides clear horizons and high airline-flight density), and the country’s deepest concentration of military aerospace infrastructure (Edwards AFB, NAS Lemoore, Vandenberg, Twentynine Palms, Camp Pendleton, Naval Base San Diego). It also produced one of the most-cited modern UAP encounters — the USS Nimitz “Tic Tac” event in 2004, declassified pilot testimony and FLIR footage included.
The more interesting story is which states over-index. Washington at 7,633 reports is more than triple what its population alone would predict — driven by both the Maury Island case (1947, one of the earliest postwar UFO incidents) and a regional reporting culture that includes the Mount Rainier sighting that same year. Arizona’s 5,347 reports reflect a triple effect: Phoenix Lights (1997), Travis Walton’s claimed abduction (1975), and the state’s role as the home of major dark-sky observatories that make Americans more atmospherically literate. Ohio’s 4,728 owe partly to Wright-Patterson AFB — the institutional home of the U.S. Air Force’s UFO investigations from Project Blue Book (1952–1969).
At the other end, the smallest states (Wyoming, North Dakota, the Dakotas generally) record the fewest — a function of population density rather than skyscape. Per-capita rates flatten the curve: small-population states like Vermont, Maine, and Montana over-index relative to size, while California and Florida normalise toward the middle.
Where to read the official files
The primary government source is the Pentagon’s AARO portal:
- AARO PURSUE archive — war.gov/UFO (all declassified DoD records, organised by release tranche).
- AARO main site — aaro.mil (reports, public hearings, current investigation status).
- NUFORC civilian database — nuforc.org (civilian-reported sightings, state and date-range indexes).
- Project Blue Book historical archive — National Archives (1952–1969 USAF investigations, 12,618 cases).
AARO has signalled the rolling declassification will continue, with further batches likely through 2026 and into 2027. None of the files released so far indicate proof of non-human origin for any incident, but several remain officially classified as “unresolved.”
Government and civilian data references for this post.