Key Takeaways
- 2026 is already a record-tier year. The CDC has confirmed more than 2,100 measles cases across 40 jurisdictions by June 18, 2026 — already past the 2,000 mark and closing in on 2025's post-elimination record with half the year still to go.
- Two states dominate the outbreak. South Carolina (about 700 cases) and Utah (about 520) together account for more than half of all 2026 cases in the United States.
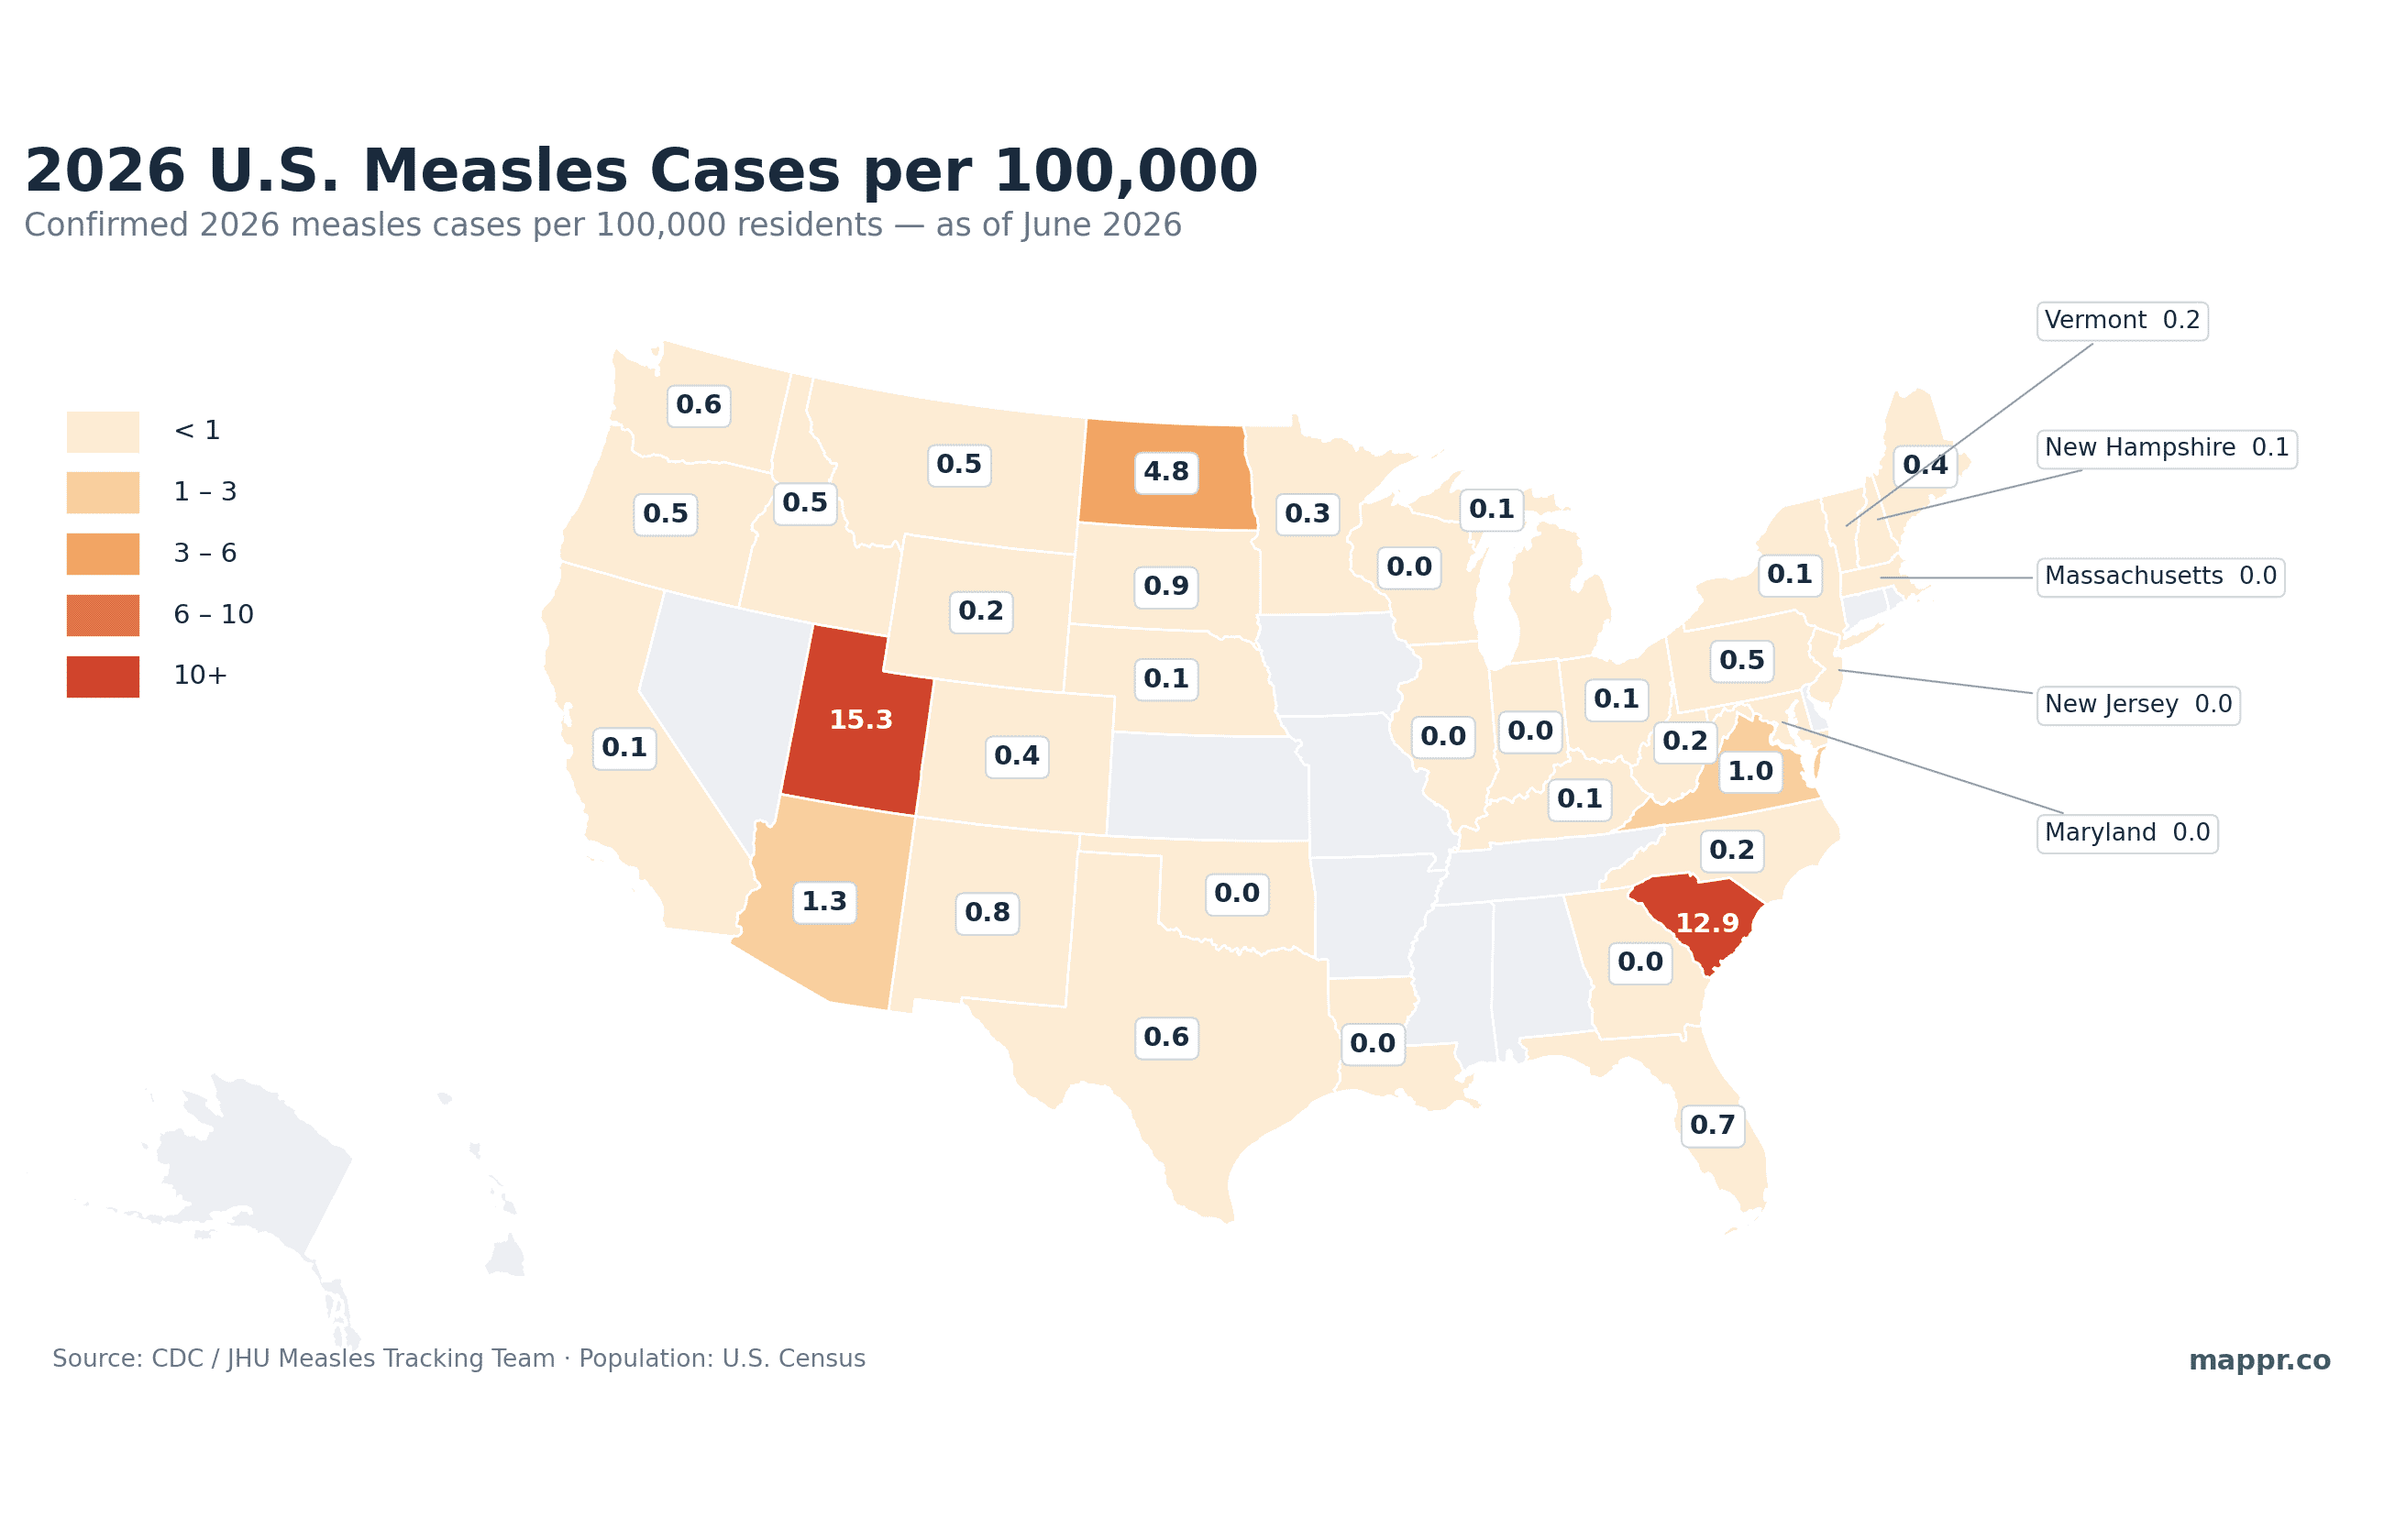
- Per capita tells a different story. Adjusted for population, Utah and South Carolina (12–15 cases per 100,000) dwarf big states like Texas and Florida, which have more total cases but far larger populations.
- Almost all cases are unvaccinated. About 93% of 2026 cases are in people who are unvaccinated or whose status is unknown, and national kindergarten MMR coverage (92.5%) has slipped below the 95% needed for herd immunity.
- A preventable, imported disease. Measles was declared eliminated in the U.S. in 2000. It returns when imported cases from a global resurgence reach communities with low vaccination coverage.
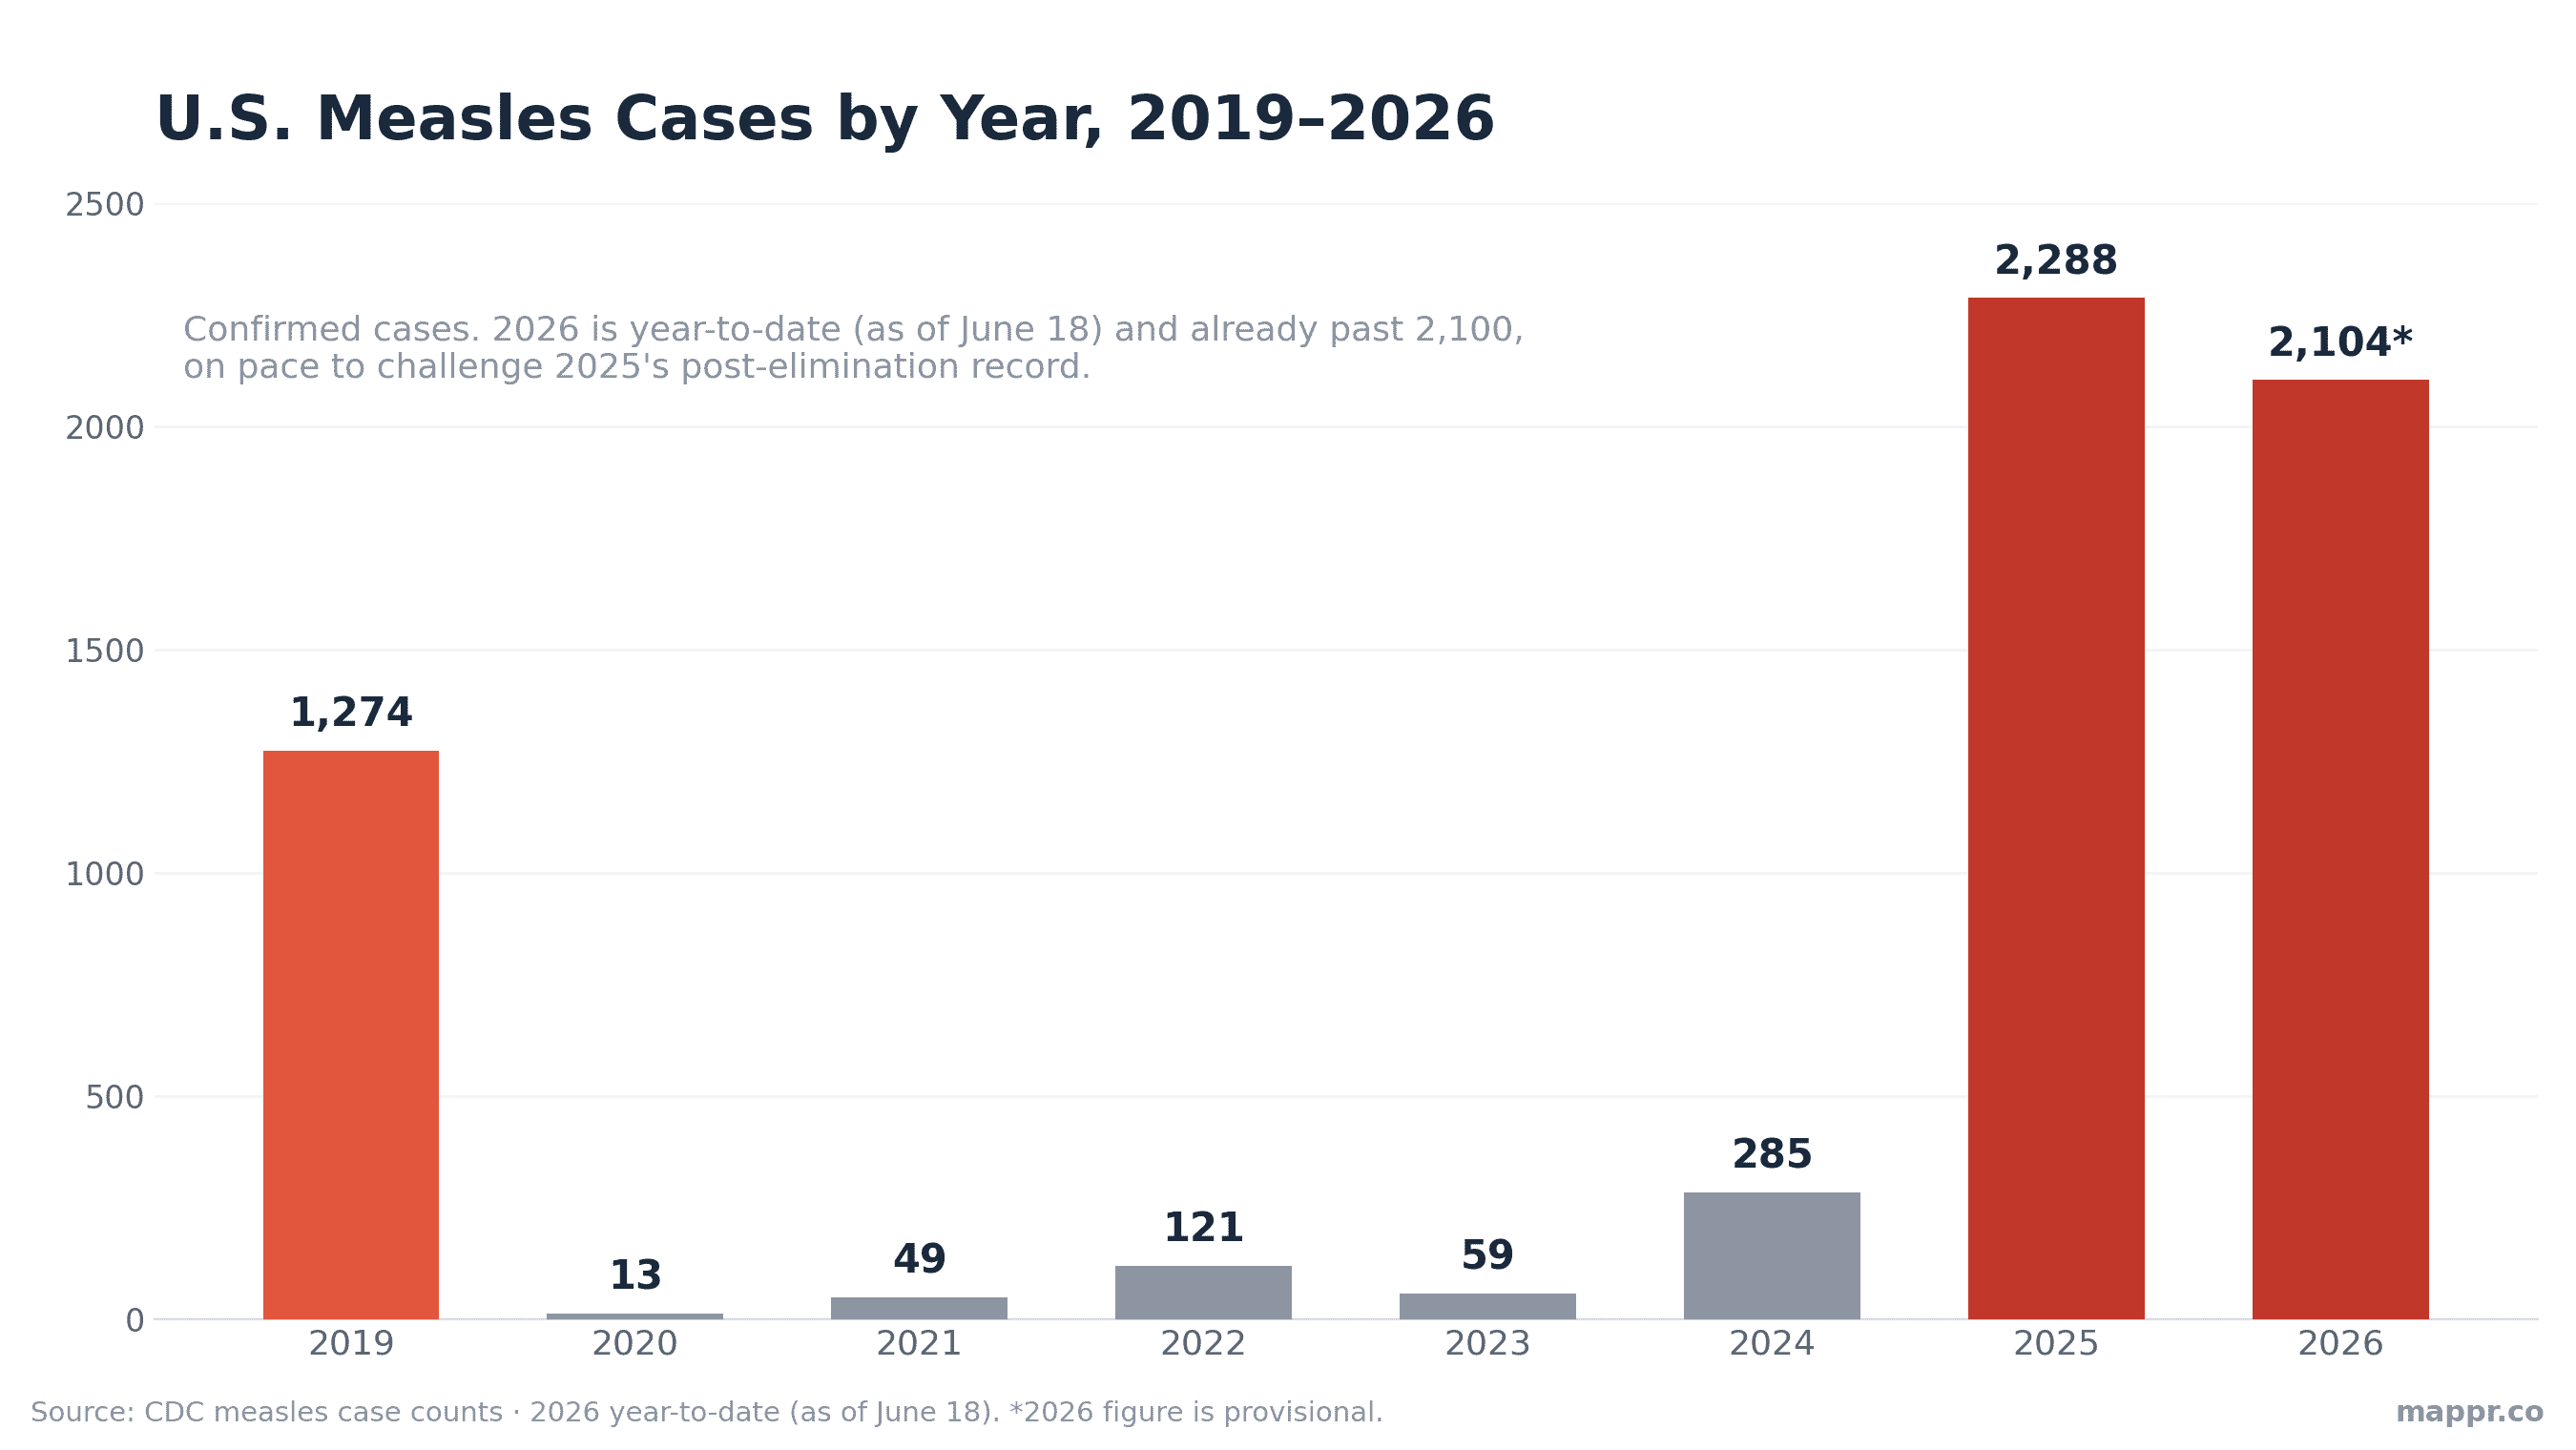
Measles was declared eliminated in the United States in 2000. A quarter of a century later, it is back in force. As of June 18, 2026, the U.S. Centers for Disease Control and Prevention (CDC) has confirmed more than 2,100 measles cases spread across 40 jurisdictions — and with the year not yet half over, 2026 is already closing in on 2025’s record, the worst since 1992.
The map below shows where those cases are concentrated. A handful of states are driving the national total, while most of the country has seen only a trickle of imported cases. We use the CDC’s figure for the official national headline and the Johns Hopkins University (JHU) measles tracker for the state-by-state data behind the maps; the two differ slightly because of update timing and methodology.
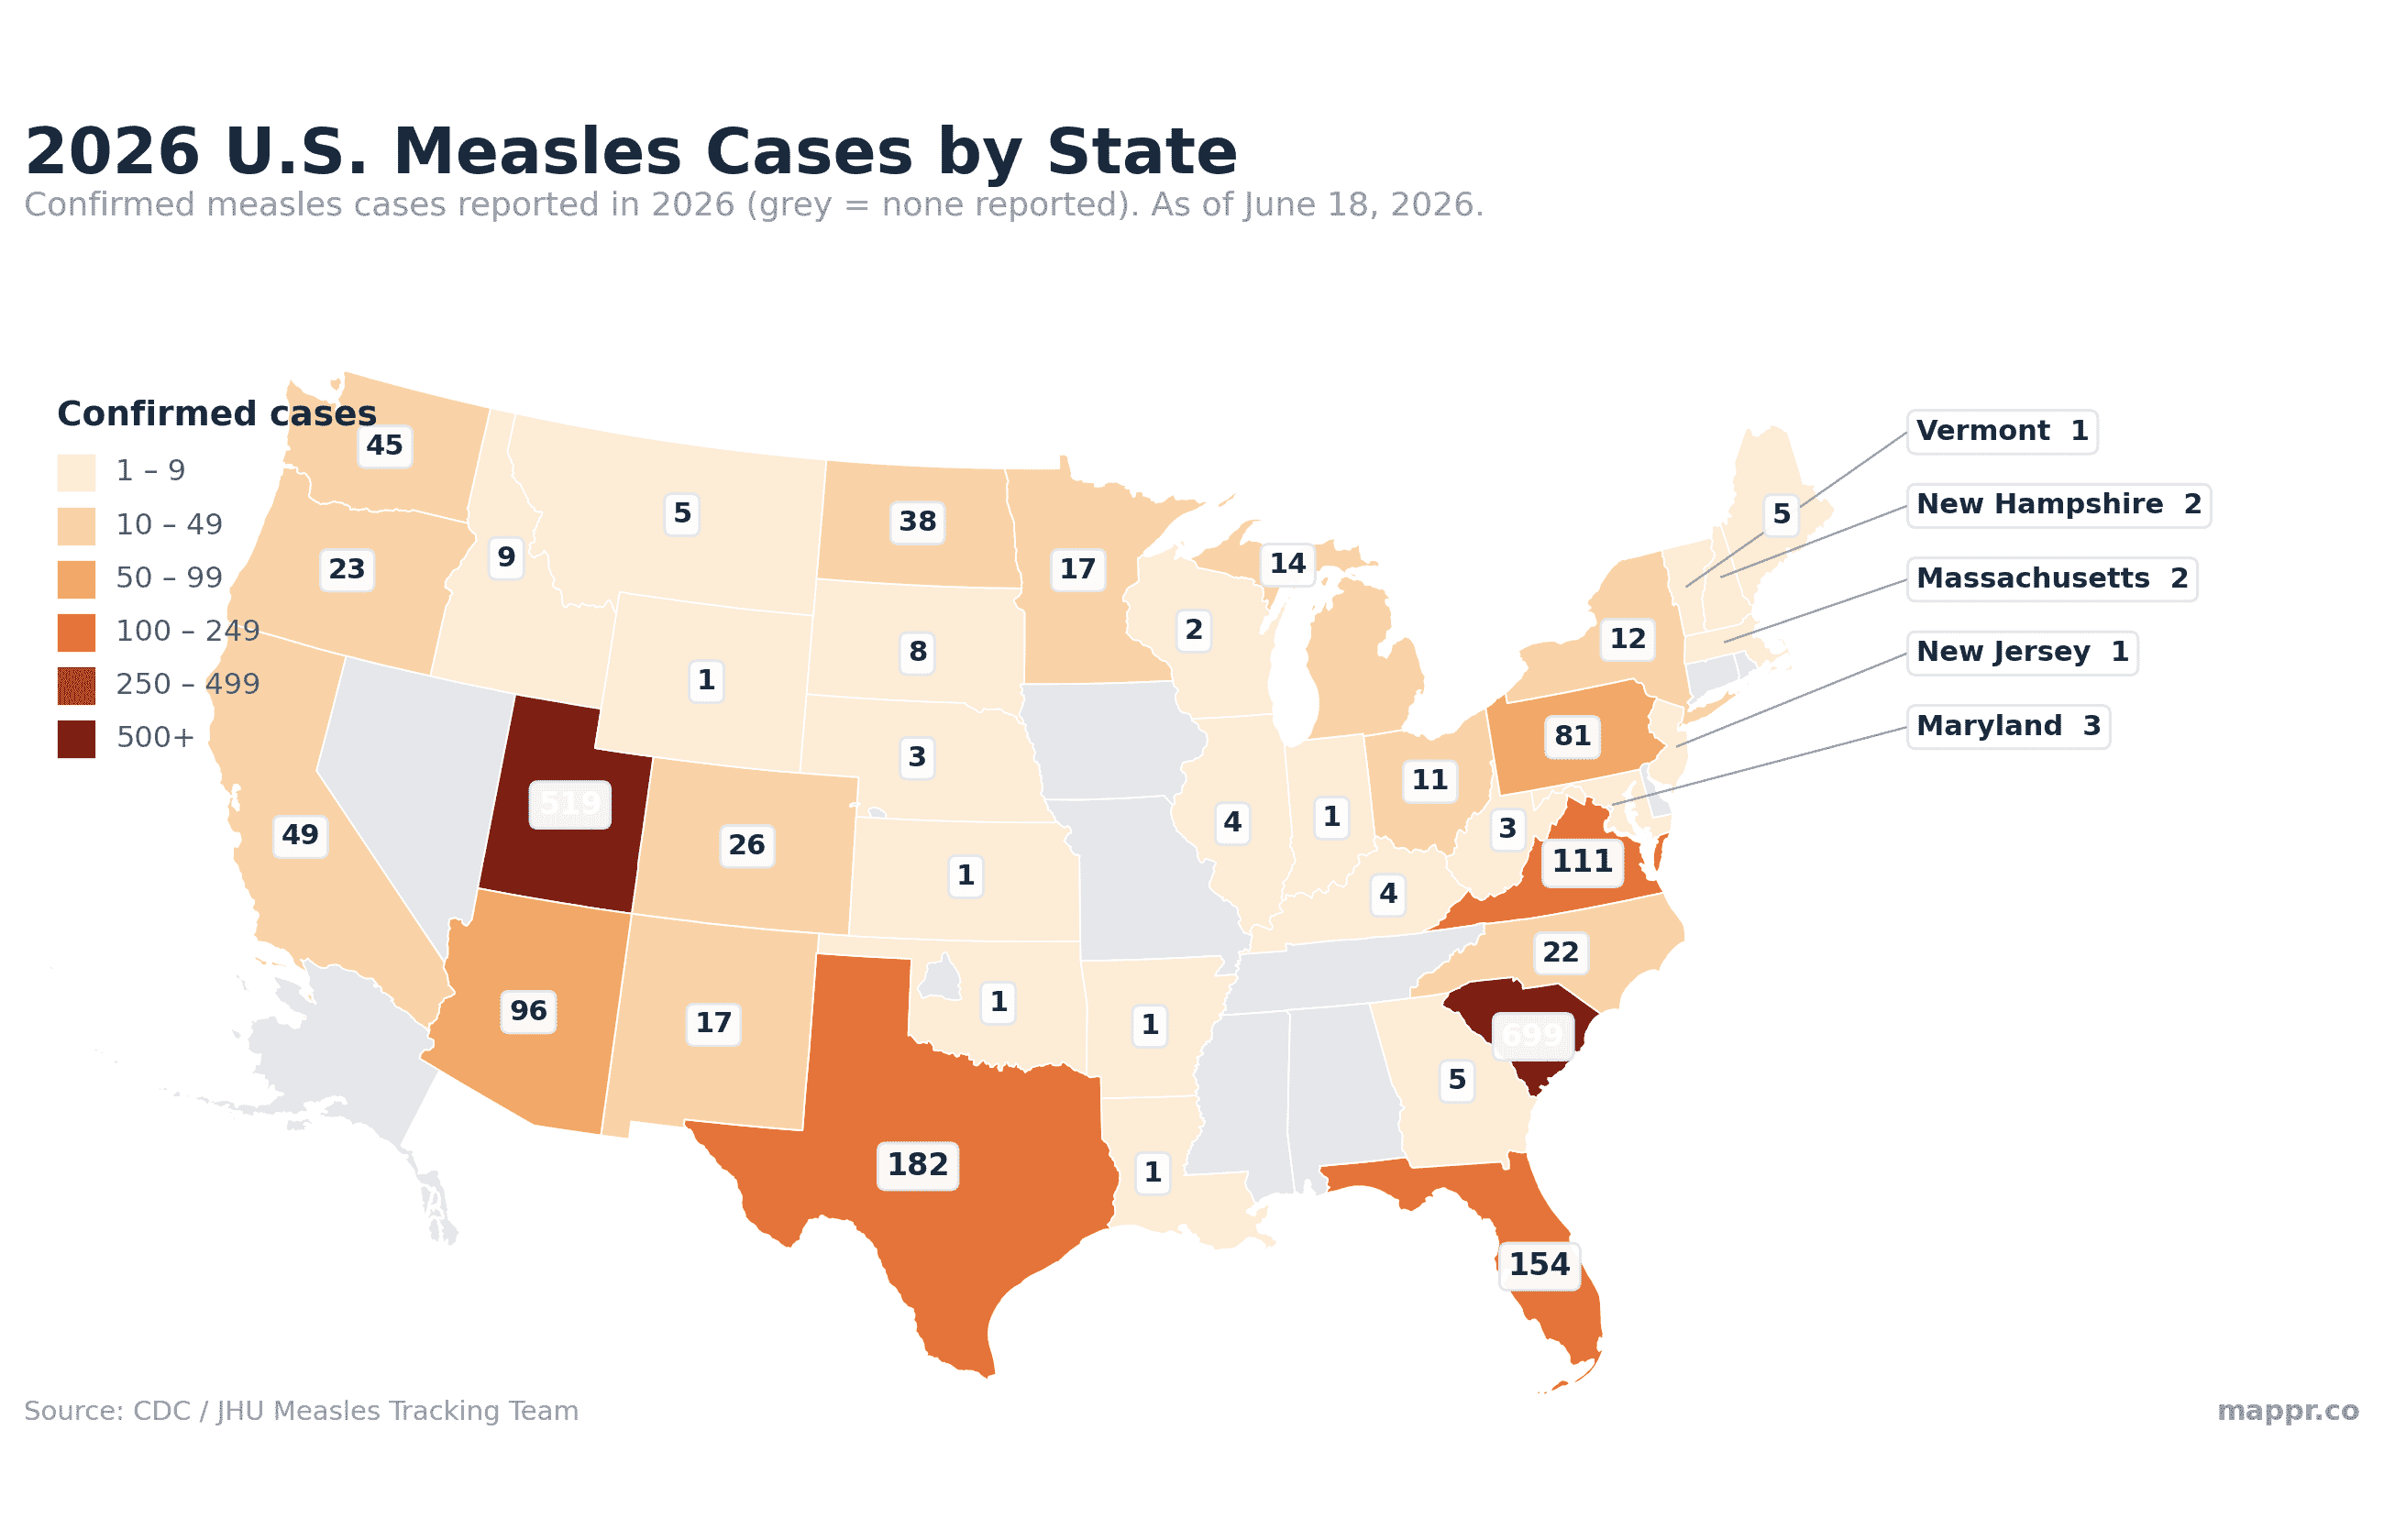
Two states stand out immediately. South Carolina (around 700 cases) and Utah (around 520) together account for more than half of all 2026 cases. Behind them, Texas (180+) and Florida (150+) — the epicentres of earlier outbreaks — remain hotspots, followed by Virginia, Arizona and Pennsylvania. Virginia has become the fastest-growing front of the outbreak, climbing to about 111 cases — the bulk of them in a single rural county (Buckingham) — a sign measles is still spreading into new communities.
Measles cases per 100,000 people
Raw case counts favour big states, so it is worth looking at cases per capita. On this measure the picture sharpens dramatically: Utah (about 15 per 100,000) and South Carolina (about 13) are in a league of their own, with North Dakota a distant third. Texas and Florida, which loomed large on the raw map, fade to a pale orange — they have many cases, but spread across tens of millions of people. Per capita, the 2026 outbreak is overwhelmingly a story of a few intense, localised clusters.
The 10 states with the most measles cases in 2026
Hardest hit
Top 10 States by 2026 Measles Cases
Confirmed 2026 cases, cases per 100,000 residents, and kindergarten MMR vaccination coverage.
| State | Cases | Per 100k | MMR |
|---|---|---|---|
| 1. South Carolina | 699 | 12.8 | 91% |
| 2. Utah | 519 | 14.8 | 89% |
| 3. Texas | 182 | 0.6 | 93% |
| 4. Florida | 154 | 0.7 | 89% |
| 5. Virginia | 111 | 1.3 | 96% |
| 6. Arizona | 96 | 1.3 | 89% |
| 7. Pennsylvania | 81 | 0.5 | 92% |
| 8. California | 49 | 0.1 | 96% |
| 9. Washington | 45 | 0.6 | 91% |
| 10. North Dakota | 38 | 4.8 | 90% |
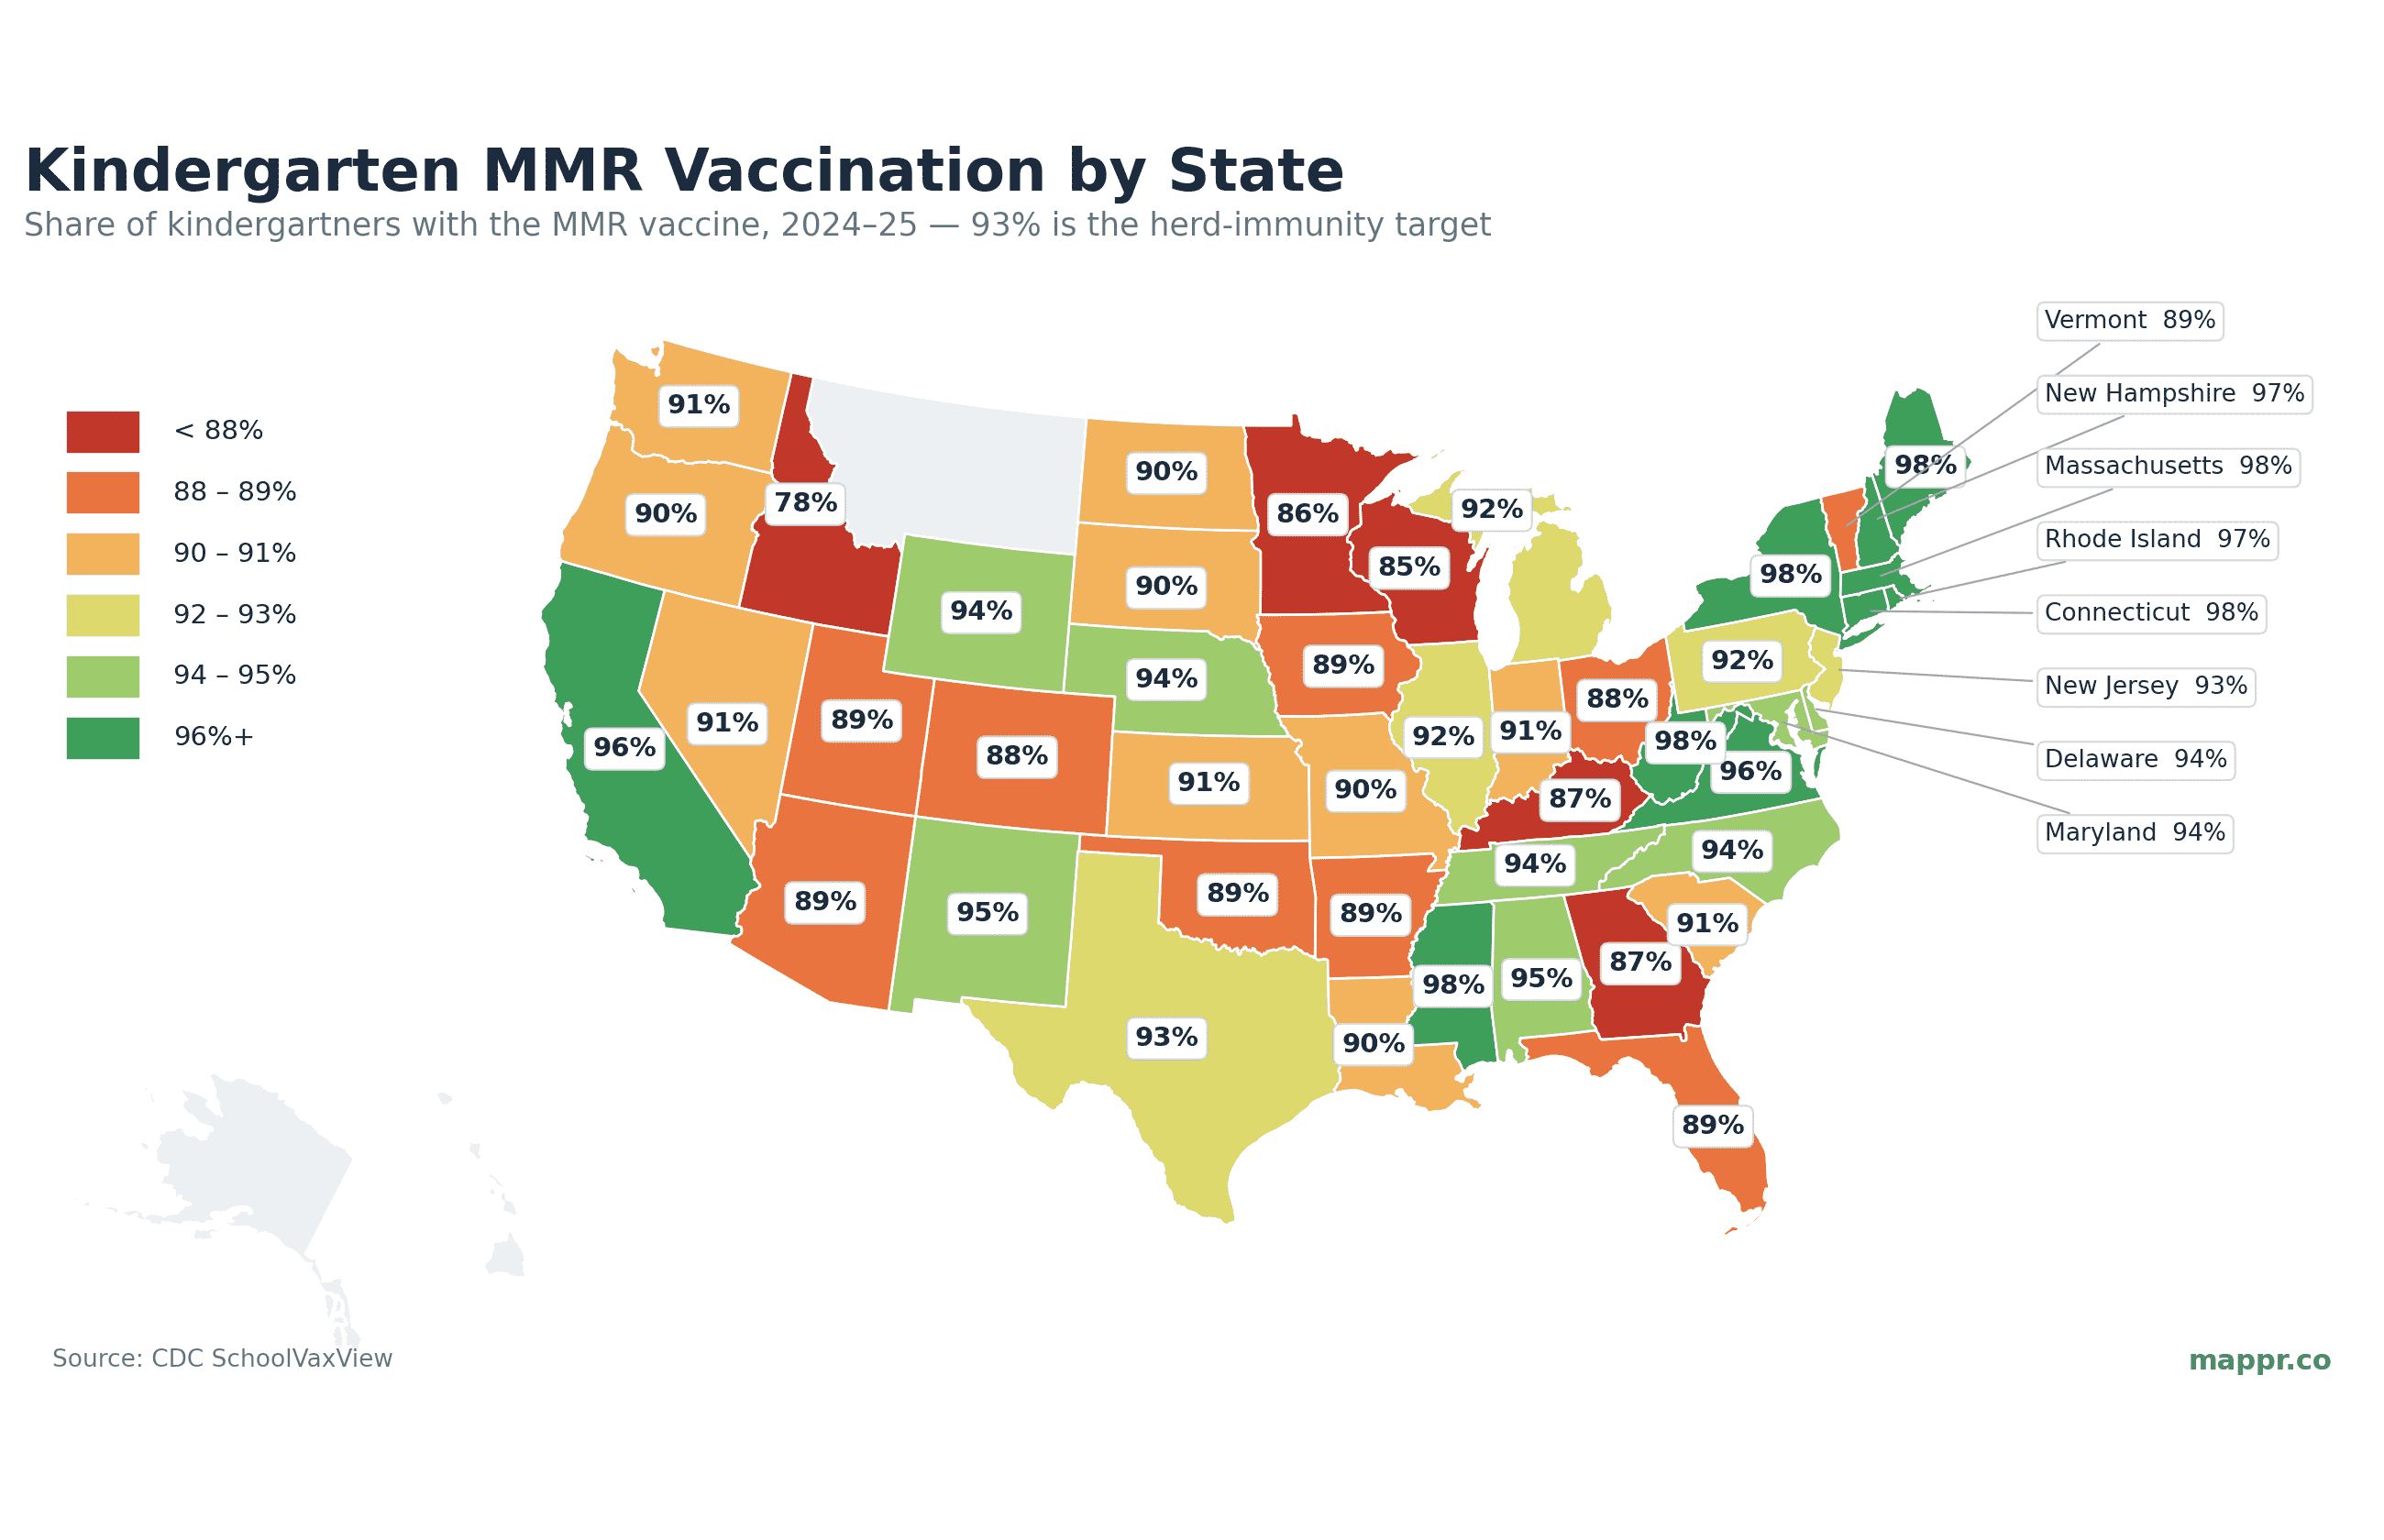
Vaccination gaps: the common thread
Why these states? Measles is one of the most contagious diseases known, and it needs very high vaccination coverage — around 95% — to stop it spreading. Nationally, kindergarten coverage for the measles, mumps and rubella (MMR) vaccine has slipped to 92.5% in the 2024–25 school year, below that threshold, while vaccine exemptions have risen to 3.6%. The CDC estimates roughly 286,000 kindergartners started school in 2024–25 without documented completion of the MMR series.
The connection shows up on the map. Several of the hardest-hit states — including Utah, Arizona and Florida, all around 88–89% — sit well below the 95% target, leaving pockets of children unprotected. Coverage isn’t the whole story (local clusters of unvaccinated families matter more than the statewide average), but the pattern is clear: where coverage falls, a single imported case can ignite an outbreak. Nationally, about 92% of 2026 cases have been in people who are unvaccinated or whose vaccination status is unknown.
Measles cases by year: a record-breaking resurgence
Step back and the scale of the resurgence is stark. After the 2019 post-elimination high of 1,274 cases, the pandemic years pushed measles to near-zero. Then it came roaring back: 2025 set a record of about 2,288 cases — the most since 1992, and the first U.S. measles deaths in a decade (three) — and 2026 has already passed 2,100 by mid-June. No measles deaths have been confirmed so far in 2026, but at this pace the year is on track to be the worst for measles in the United States in more than three decades.
Why is measles coming back?
Three forces are converging. First, falling vaccination rates: MMR coverage has drifted down since the pandemic, and exemptions are rising, creating under-protected communities. Second, a global resurgence: measles outbreaks are surging worldwide, so more infected travellers are arriving. Third, measles’ sheer contagiousness — one case can infect up to 90% of susceptible people nearby. Put together, a single imported case landing in a low-coverage community can spark the kind of large outbreaks now seen in South Carolina and Utah.
How to read these numbers
Measles figures are preliminary and change weekly. The CDC updates its national count on Thursdays and cautions that totals are provisional. Our national headline (about 2,104 cases) follows the CDC; the state-by-state maps use the Johns Hopkins tracker, which reports a slightly higher total (around 2,180) because of differences in timing and methodology. Per-capita rates use 2024 Census population estimates, and MMR coverage is the latest available CDC SchoolVaxView figure (mostly the 2024–25 school year). Treat the rankings as a strong guide to where measles is concentrated rather than an exact, final tally.
National case totals, outbreak counts, vaccination-status shares and historical comparisons follow the CDC; state- and county-level case data come from the Johns Hopkins measles tracker; vaccination coverage is from CDC SchoolVaxView; per-capita rates use U.S. Census population estimates. Figures are provisional and were current as of mid-June 2026 (CDC update of June 18).
Primary Data Sources:
- CDC — Measles Cases and Outbreaks – Official U.S. national case count, jurisdictions affected, outbreak-associated share, vaccination status of cases, hospitalizations and deaths.
- Johns Hopkins University — U.S. Measles Tracker (Measles Tracking Team Data) – State- and county-level confirmed case data used for the maps and the top-10 table.
- CDC SchoolVaxView — Vaccination coverage among kindergartners – State kindergarten MMR vaccination coverage, 2024–25 school year (or latest available).
- U.S. Census Bureau — State population estimates – 2024 state population estimates used to calculate cases per 100,000 residents.
Image Sources:
- Maps and charts by Mappr – All maps and charts are Mappr originals, built from the data sources above and U.S. Census state boundaries.