Key Takeaways
- National rate is 4.3%. As of April 2026 the U.S. unemployment rate held steady to 4.3% (seasonally adjusted). This page updates automatically each month.
- South Dakota has the lowest. South Dakota has the lowest unemployment in the country at 2.2%, with the Plains and Mountain West generally tightest.
- District of Columbia has the highest. District of Columbia tops the list at 6.2%. The West Coast and a few Northeast states tend to run above the national rate.
- The state split. 22 states are above the national rate and 26 are below it — the gap between the tightest and loosest state labor markets is several points wide.
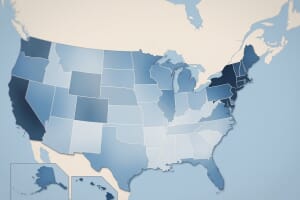
Unemployment varies widely across the United States. This page maps the latest seasonally adjusted unemployment rate for every state from the U.S. Bureau of Labor Statistics, and refreshes automatically each month when new data is released.
Unemployment rate by state

Highest and lowest unemployment states
District of Columbia currently has the highest unemployment rate at 6.2%, while South Dakota has the lowest at 2.2%. The chart below ranks the states furthest above and below the national rate of 4.3%.

National trend
How the national unemployment rate has moved over the past two years:

Full table: unemployment rate by state
All 50 states and the District of Columbia, sortable and searchable.
| Rank | State | Unemployment rate (%) |
|---|---|---|
| 1 | District of Columbia | 6.2 |
| 2 | California | 5.3 |
| 3 | Delaware | 5.3 |
| 4 | Nevada | 5.3 |
| 5 | Oregon | 5.2 |
| 6 | Washington | 5.2 |
| 7 | Illinois | 5.1 |
| 8 | Connecticut | 5.0 |
| 9 | Michigan | 5.0 |
| 10 | New Mexico | 4.9 |
| 11 | Florida | 4.8 |
| 12 | New Jersey | 4.8 |
| 13 | South Carolina | 4.8 |
| 14 | Alaska | 4.7 |
| 15 | Arizona | 4.7 |
| 16 | Massachusetts | 4.7 |
| 17 | New York | 4.6 |
| 18 | Minnesota | 4.5 |
| 19 | Rhode Island | 4.5 |
| 20 | Louisiana | 4.4 |
| 21 | Maryland | 4.4 |
| 22 | West Virginia | 4.4 |
| 23 | Arkansas | 4.3 |
| 24 | Kentucky | 4.3 |
| 25 | Texas | 4.3 |
| 26 | Pennsylvania | 4.2 |
| 27 | Oklahoma | 4.0 |
| 28 | Colorado | 3.9 |
| 29 | Kansas | 3.9 |
| 30 | Ohio | 3.9 |
| 31 | Mississippi | 3.8 |
| 32 | Missouri | 3.8 |
| 33 | Utah | 3.8 |
| 34 | Virginia | 3.8 |
| 35 | North Carolina | 3.7 |
| 36 | Idaho | 3.6 |
| 37 | Tennessee | 3.6 |
| 38 | Georgia | 3.5 |
| 39 | Montana | 3.5 |
| 40 | Wisconsin | 3.5 |
| 41 | Wyoming | 3.5 |
| 42 | Iowa | 3.3 |
| 43 | Indiana | 3.2 |
| 44 | Maine | 3.1 |
| 45 | New Hampshire | 3.1 |
| 46 | Nebraska | 3.0 |
| 47 | Alabama | 2.8 |
| 48 | Vermont | 2.6 |
| 49 | Hawaii | 2.5 |
| 50 | North Dakota | 2.4 |
| 51 | South Dakota | 2.2 |
About the data
Figures are seasonally adjusted unemployment rates from the BLS Local Area Unemployment Statistics (LAUS) program for states, and the national rate from the Current Population Survey. State data is typically released about three weeks after the reference month; this page updates automatically when it does.