📅 Last updated: June 9, 2026 · Spot prices as of: June 1, 2026 · Source: U.S. EIA (Brent & WTI). Updated monthly.
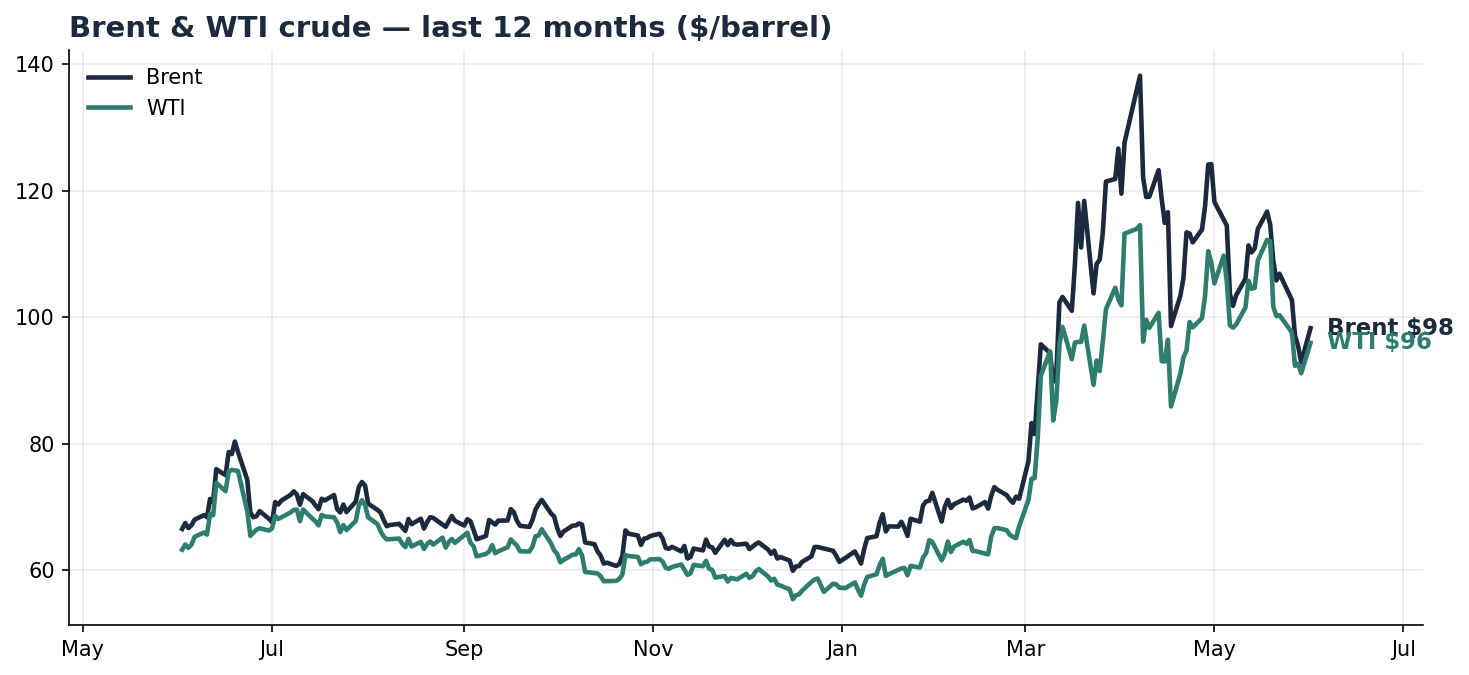
Brent & WTI crude oil prices today
Brent crude: $98.29 ▼ 16.9% (1mo) · ▲ 52.8% (1yr)
WTI crude: $95.96 ▼ 8.9% (1mo) · ▲ 56.1% (1yr)
What’s shaping oil prices right now
Global crude prices are being shaped by a tight but volatile mix of OPEC+ supply management, a still-firm demand outlook, and a significant geopolitical risk premium. OPEC+ has continued raising output quotas only gradually, which limits how fast extra supply reaches the market, while forecasts still show demand growing in 2026 even if the pace is softer than in earlier recovery years. At the same time, Middle East tensions, especially renewed Israel-Iran flare-ups and uncertainty around Persian Gulf shipping, are keeping traders cautious. Sanctions on Russian crude are also reshaping trade flows, redirecting barrels and adding to market friction.
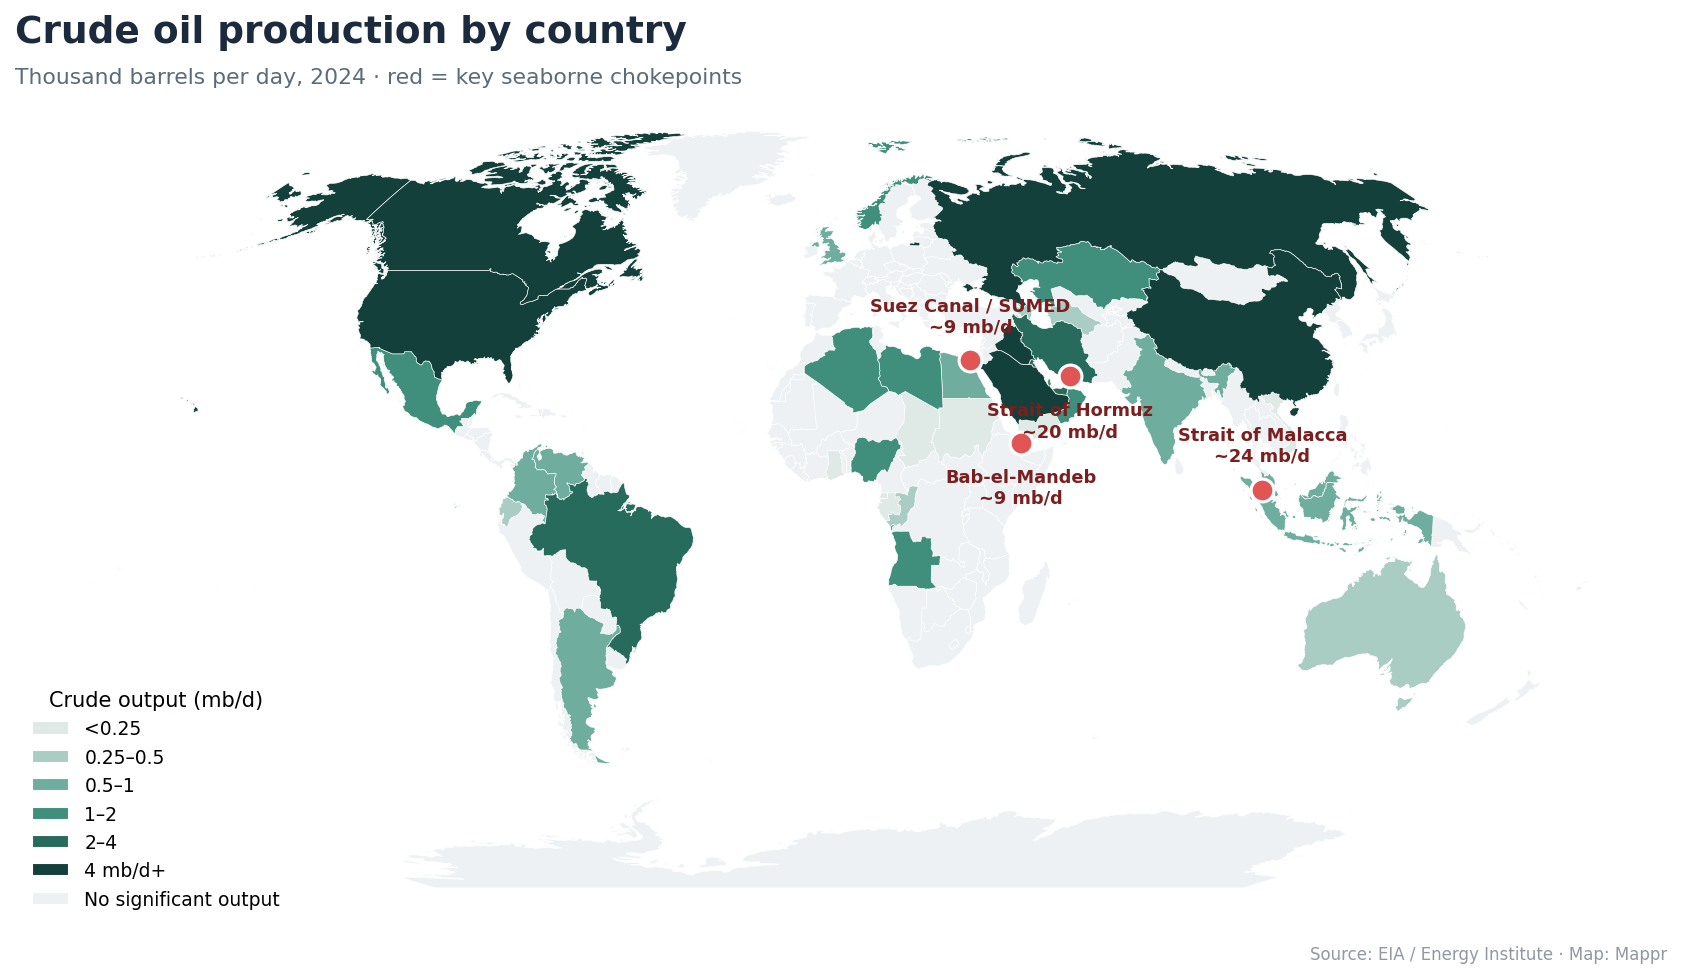
Where the world’s oil comes from
Crude is a single global market, so one barrel’s price moves the whole world — but it is pumped in a handful of places and shipped through a few narrow corridors. The map shows crude output by country, with the seaborne chokepoints (in red) whose disruption sends prices spiking far more than a localised conflict does.
Top 15 crude oil producers
| # | Country | Crude output (mb/d) |
|---|---|---|
| 1 | United States | 13.2 |
| 2 | Russia | 10.1 |
| 3 | Saudi Arabia | 9.0 |
| 4 | Canada | 4.9 |
| 5 | Iraq | 4.3 |
| 6 | China | 4.2 |
| 7 | Iran | 3.4 |
| 8 | Brazil | 3.4 |
| 9 | UAE | 3.3 |
| 10 | Kuwait | 2.7 |
| 11 | Mexico | 1.9 |
| 12 | Norway | 1.8 |
| 13 | Kazakhstan | 1.8 |
| 14 | Qatar | 1.8 |
| 15 | Nigeria | 1.4 |
The chokepoints that move oil prices
About a fifth of the world’s oil passes through the Strait of Hormuz between the Gulf and the Indian Ocean — the single most important oil artery on Earth. The Strait of Malacca carries crude to East Asia, Bab-el-Mandeb and the Suez Canal/SUMED link the Gulf to Europe. A threat to any of these moves prices far more than a strike that doesn’t touch oil infrastructure or transit — which is why markets price chokepoint risk so quickly.
For what this means at the pump, see our US gas prices by state and European fuel prices trackers.