Key Takeaways
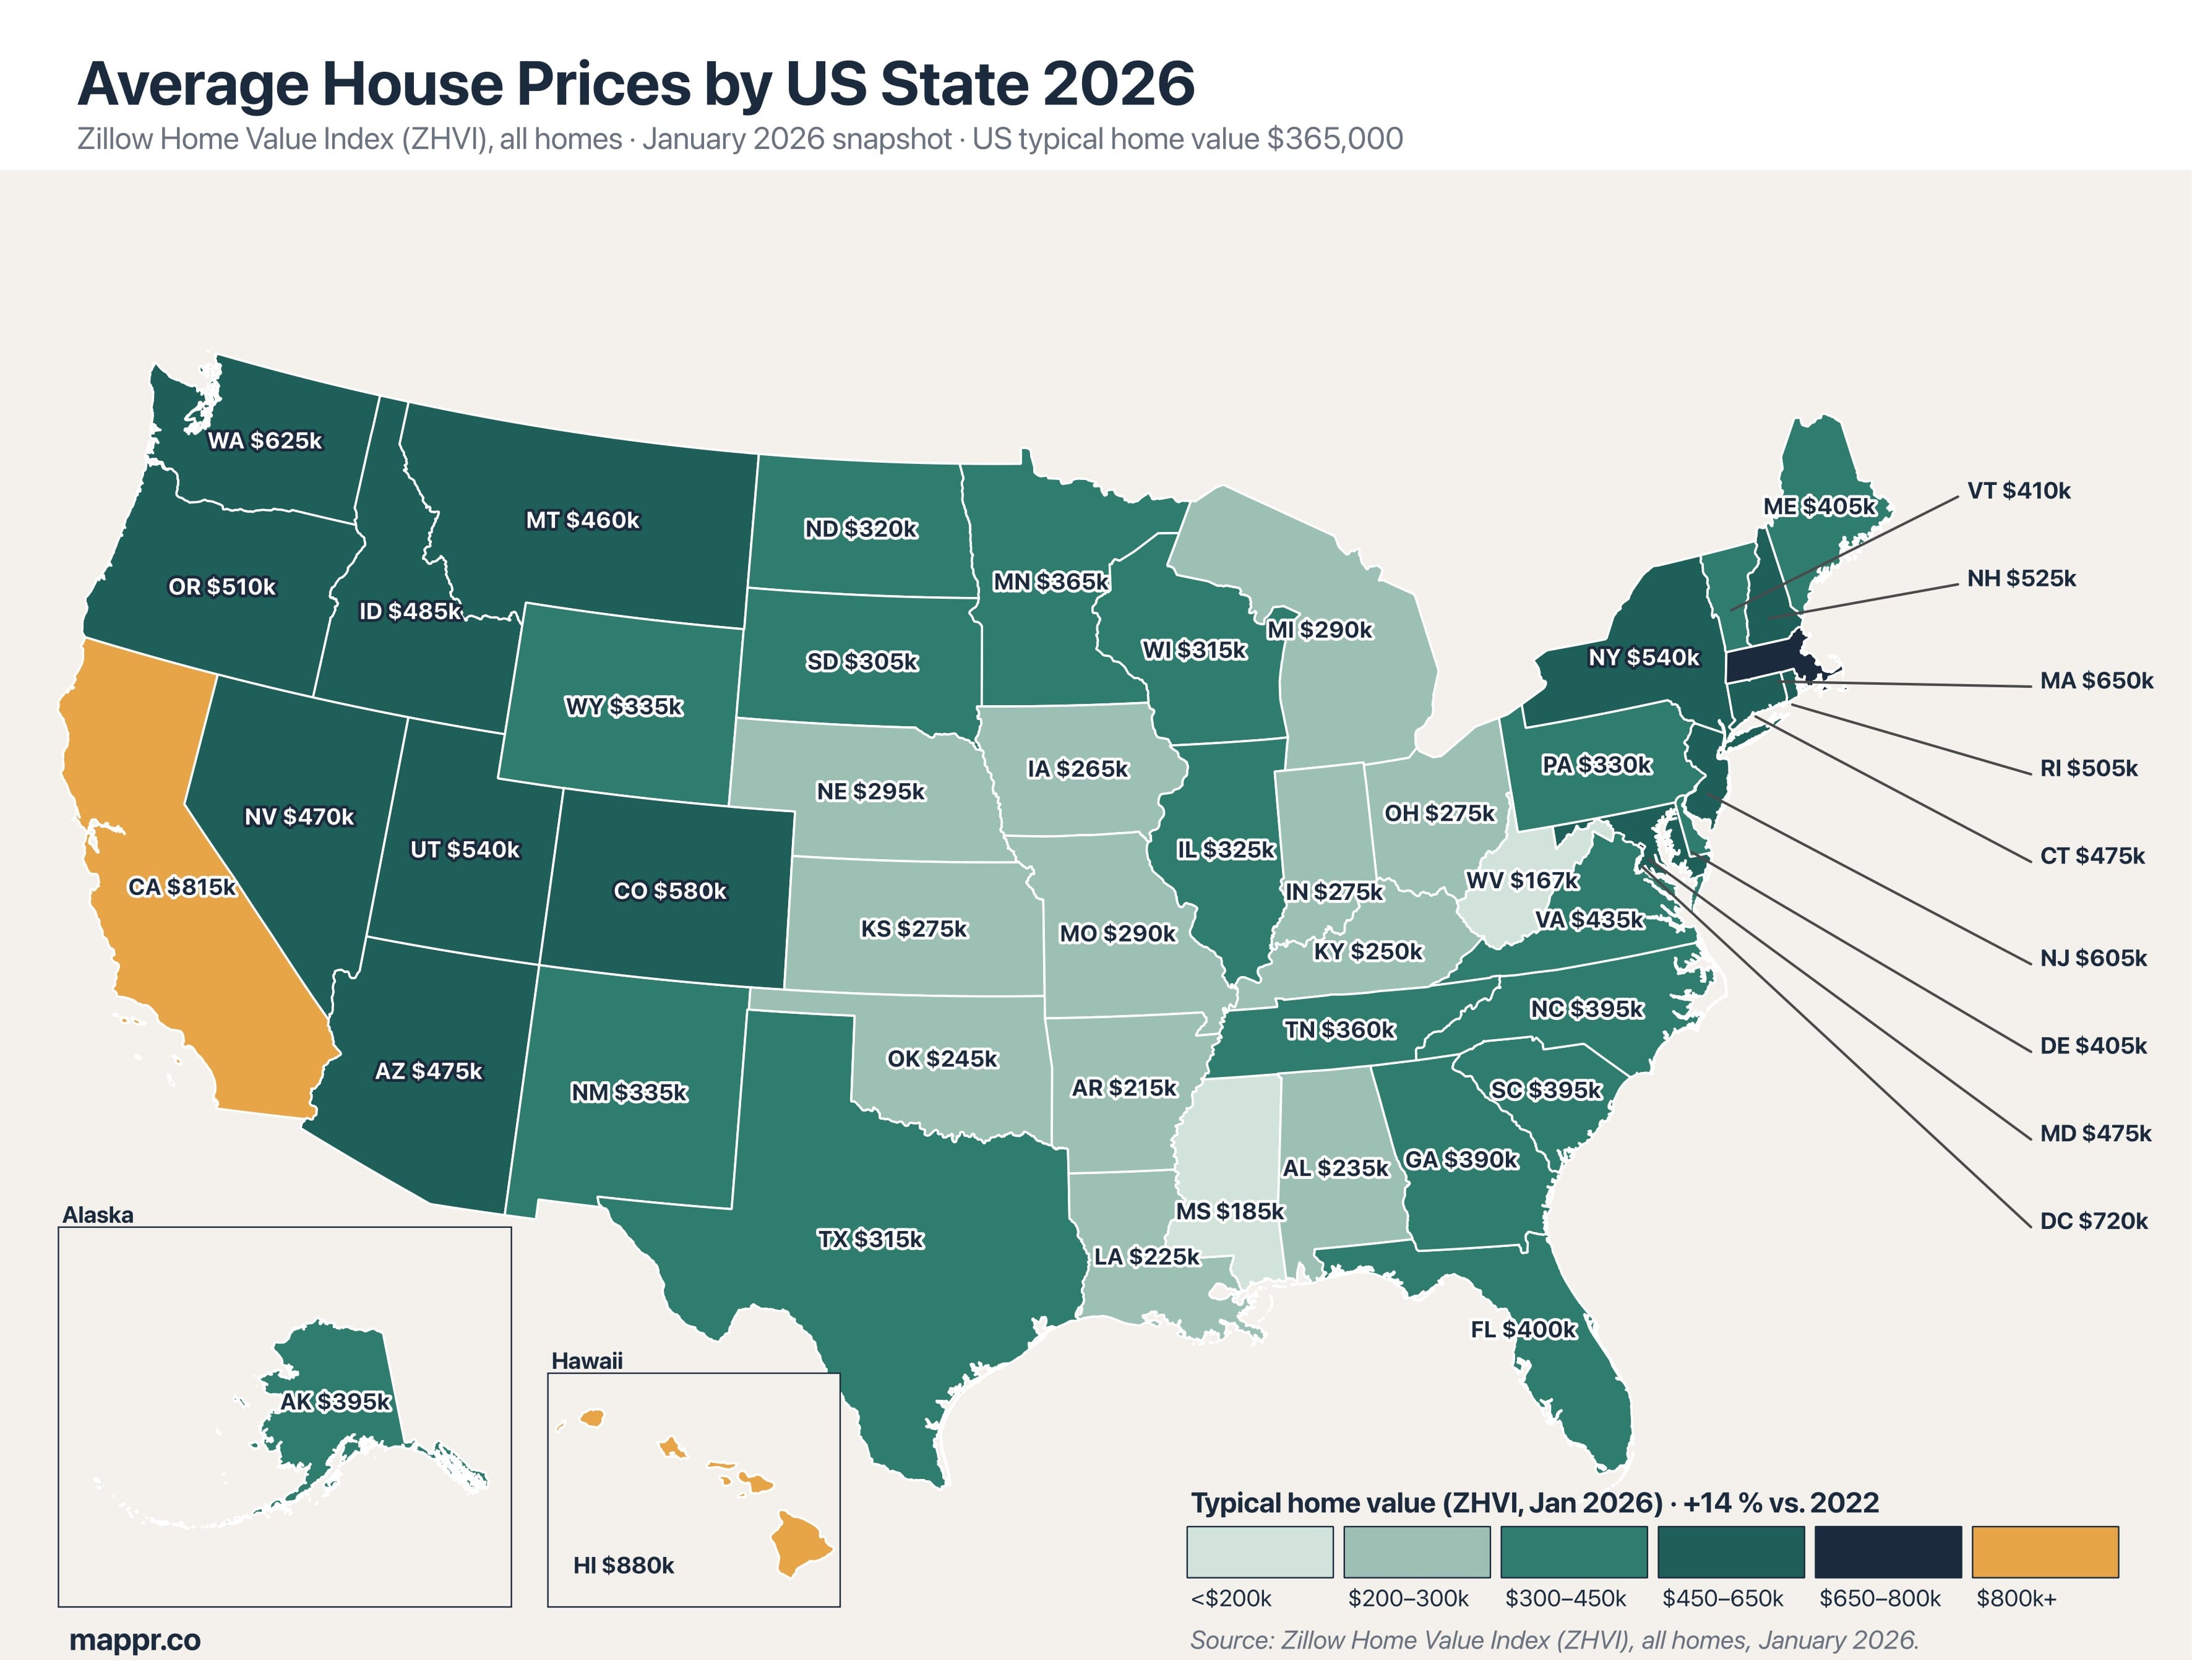
- National ZHVI: ≈$361,000 in January 2026. Zillow's typical home value across all US homes is just above $360k. The gap between the most and least expensive states is roughly 4.8× — $831k in Hawaii vs $173k in West Virginia.
- Hawaii is #1 at $831,355. Followed by California ($774,927), Massachusetts ($654,682), Washington state ($601,978), and Washington, DC ($586,048). Land scarcity, zoning limits, and high-income metros anchor the top of the ranking.
- West Virginia is #51 at $172,882. Followed by Mississippi ($190,099), Louisiana ($209,417), Oklahoma ($219,063), and Arkansas ($219,842). Rural states with slow population growth cluster at the bottom.
- Connecticut, New Hampshire, New Jersey lead post-2022 gains. Since January 2022, CT (+34.5%), NH (+32.2%), NJ (+28.8%), RI (+28.9%) have all risen roughly a third. The Northeast has been the fastest-appreciating region of the post-pandemic market.
- Only DC and Louisiana are below their January 2022 values. DC is −8.0% over four years — unique among states and territories. Louisiana is −2.2%, reflecting insurance-cost pressure and out-migration. Every other state has gained at least some ground.
Where you buy a home in the United States matters more than almost any other financial decision you make. The same budget that buys a four-bedroom house in West Virginia will stretch to a studio condo — if you’re lucky — in coastal California or Hawaii. In January 2026, Zillow’s Home Value Index (ZHVI) puts the national typical home value at around $361,000, but that single number hides a spread of roughly 4.8× between the most and least expensive states.
This page tracks the typical home value in every US state (and the District of Columbia) using Zillow’s all-homes ZHVI series — a smoothed, seasonally adjusted estimate of the typical value for homes in the 35th–65th percentile range. We show the January 2026 ranking, compare it against January 2022 to highlight the biggest post-pandemic movers, and set the numbers in regional and policy context. The map below is a Jenks six-class choropleth built directly on Zillow’s state-level data.
The figures below are statewide averages — but home values can vary enormously from one neighborhood to the next. To see the typical home value for a specific area, try our free Average Home Prices by ZIP Code tool and look up any US ZIP code.
Full Ranking: Typical Home Value by US State, January 2026
The table below lists every state and DC by ZHVI, ranked highest to lowest, with the four-year percentage change against January 2022 in the rightmost column. The national typical home value is about $361,000; 25 states are above the national number and 26 (including DC) are below.
| Rank | Code | State | ZHVI (Jan 2026) | vs 2022 |
|---|---|---|---|---|
| 1 | HI | Hawaii | $831,355 | ▲ +9.1% |
| 2 | CA | California | $774,927 | ▲ +9.0% |
| 3 | MA | Massachusetts | $654,682 | ▲ +22.8% |
| 4 | WA | Washington | $601,978 | ▲ +8.7% |
| 5 | DC | District of Columbia | $586,048 | ▼ -8.0% |
| 6 | NJ | New Jersey | $564,630 | ▲ +28.8% |
| 7 | CO | Colorado | $545,073 | ▲ +3.5% |
| 8 | UT | Utah | $537,471 | ▲ +8.0% |
| 9 | NH | New Hampshire | $506,147 | ▲ +32.2% |
| 10 | NY | New York | $502,770 | ▲ +22.1% |
| 11 | OR | Oregon | $499,555 | ▲ +4.2% |
| 12 | RI | Rhode Island | $496,455 | ▲ +28.9% |
| 13 | ID | Idaho | $472,542 | ▲ +1.6% |
| 14 | MT | Montana | $464,006 | ▲ +15.2% |
| 15 | NV | Nevada | $447,492 | ▲ +8.5% |
| 16 | CT | Connecticut | $432,908 | ▲ +34.5% |
| 17 | MD | Maryland | $429,159 | ▲ +11.6% |
| 18 | AZ | Arizona | $423,136 | ▲ +1.7% |
| 19 | VA | Virginia | $411,284 | ▲ +19.3% |
| 20 | ME | Maine | $405,314 | ▲ +23.0% |
| 21 | DE | Delaware | $402,078 | ▲ +17.4% |
| 22 | VT | Vermont | $390,321 | ▲ +13.8% |
| 23 | AK | Alaska | $383,900 | ▲ +10.9% |
| 24 | FL | Florida | $375,382 | ▲ +11.0% |
| 25 | WY | Wyoming | $361,072 | ▲ +18.1% |
| 26 | MN | Minnesota | $344,594 | ▲ +11.4% |
| 27 | NC | North Carolina | $335,595 | ▲ +17.0% |
| 28 | TN | Tennessee | $332,443 | ▲ +16.2% |
| 29 | GA | Georgia | $332,066 | ▲ +13.7% |
| 30 | WI | Wisconsin | $326,317 | ▲ +26.7% |
| 31 | NM | New Mexico | $314,965 | ▲ +19.8% |
| 32 | SD | South Dakota | $314,491 | ▲ +17.4% |
| 33 | SC | South Carolina | $302,514 | ▲ +17.3% |
| 34 | TX | Texas | $301,264 | ▲ +5.9% |
| 35 | IL | Illinois | $282,902 | ▲ +23.2% |
| 36 | PA | Pennsylvania | $281,493 | ▲ +19.7% |
| 37 | ND | North Dakota | $281,055 | ▲ +14.3% |
| 38 | NE | Nebraska | $274,917 | ▲ +22.4% |
| 39 | MO | Missouri | $261,311 | ▲ +20.3% |
| 40 | MI | Michigan | $257,499 | ▲ +20.5% |
| 41 | IN | Indiana | $252,200 | ▲ +22.4% |
| 42 | KS | Kansas | $243,364 | ▲ +24.4% |
| 43 | OH | Ohio | $240,317 | ▲ +25.5% |
| 44 | AL | Alabama | $234,771 | ▲ +11.0% |
| 45 | KY | Kentucky | $230,918 | ▲ +21.6% |
| 46 | IA | Iowa | $229,754 | ▲ +20.8% |
| 47 | AR | Arkansas | $219,842 | ▲ +13.6% |
| 48 | OK | Oklahoma | $219,063 | ▲ +19.1% |
| 49 | LA | Louisiana | $209,417 | ▼ -2.2% |
| 50 | MS | Mississippi | $190,099 | ▲ +5.1% |
| 51 | WV | West Virginia | $172,882 | ▲ +18.2% |
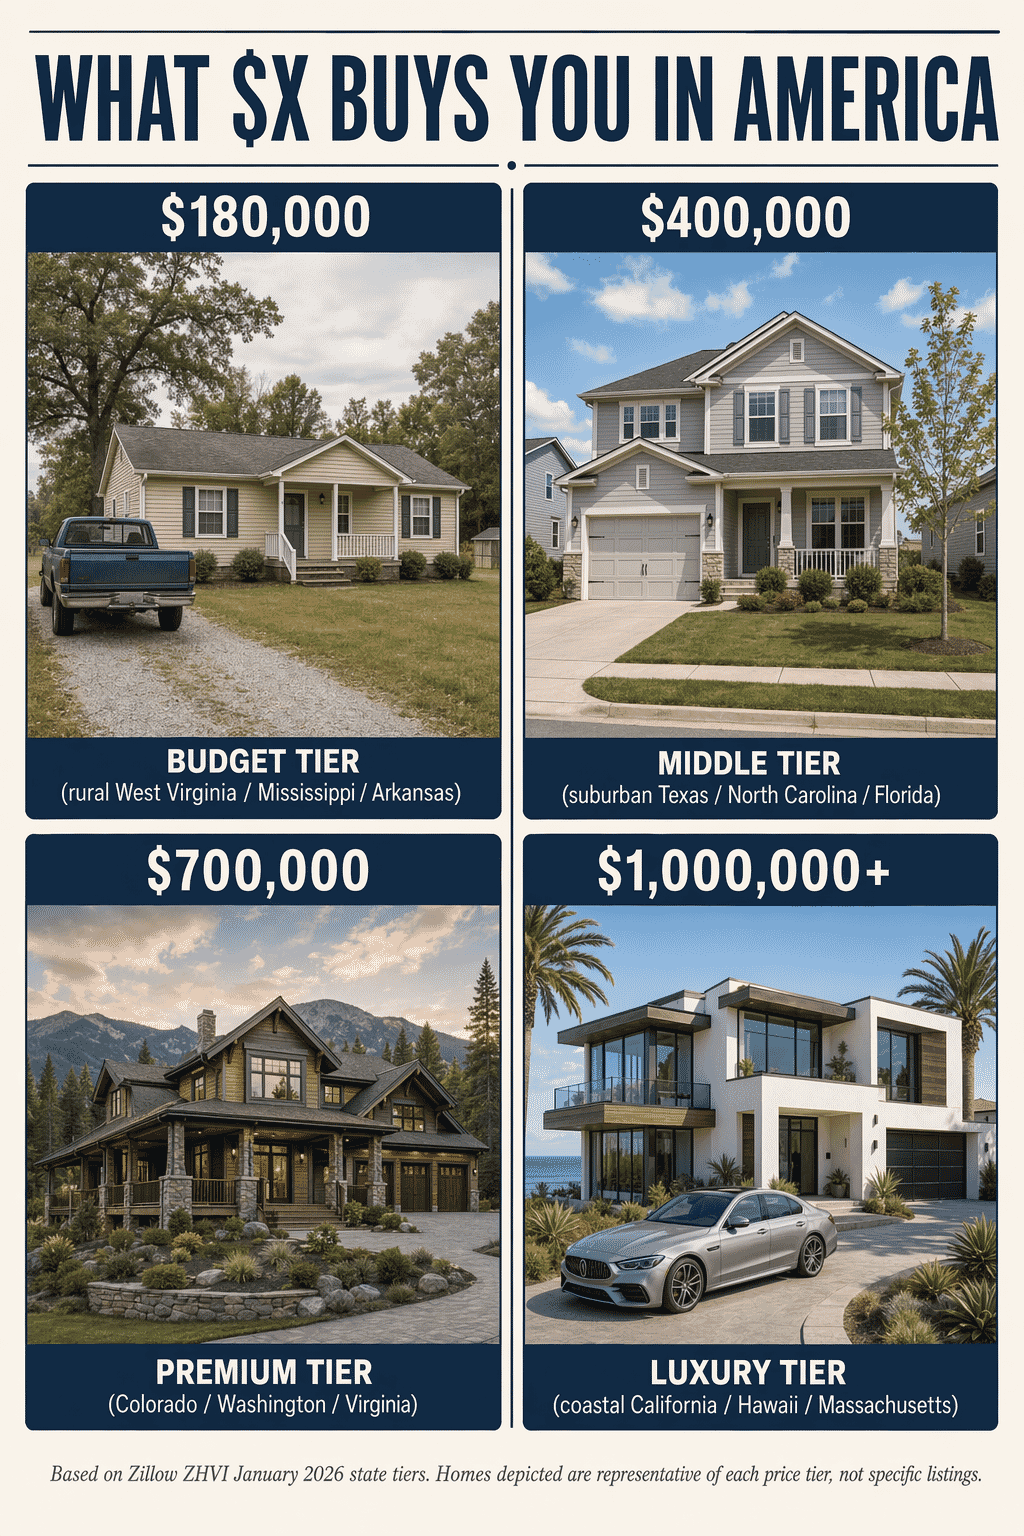
The Three Tiers of US Housing: Coastal, Interior, and Heartland
🌊 Tier 1 — The Coastal Premium: $500k+
The ten most expensive states form a remarkably consistent geographic band: three Pacific states (Hawaii, California, Washington), three Northeast states (Massachusetts, New Jersey, New Hampshire), plus New York, the District of Columbia, Colorado, and Utah. Every one of these is either a coastal metro cluster or a high-demand inland state with strict supply constraints (Colorado, Utah). The common structural features: tight zoning, geographic constraints (mountains, coastline, water), and strong high-income labour markets.
🏞️ Tier 2 — Middle America: $250k–$500k
The broad middle of the US market sits between a quarter- and a half-million dollars. This is where most of the country lives — Florida ($375k), Georgia ($332k), North Carolina ($336k), Texas ($301k), Pennsylvania ($281k), Illinois ($283k), Michigan ($257k). Prices here have been pushed up sharply since 2022 by Sun Belt in-migration and lingering supply constraints, but they remain genuinely affordable relative to coastal comparables.
🌾 Tier 3 — Rural and South-Central: Under $250k
Nine states still have a typical home value below $250,000: Alabama, Kentucky, Iowa, Arkansas, Oklahoma, Louisiana, Mississippi, West Virginia, plus a handful of others just above the line. The common denominator is slow population growth and industrial decline or stagnation. These states also tend to have much lower cost of living overall — a $200k house in Mississippi buys substantially more life than a $200k house in Sacramento would.
Biggest Gainers Since 2022: The Northeast Surge
The post-pandemic period (January 2022 → January 2026) rearranged the US housing hierarchy. While coastal California and DC lagged or fell, the Northeast corridor — Connecticut, New Hampshire, Rhode Island, New Jersey — led the nation. Connecticut’s ZHVI rose 34.5% over four years, New Hampshire 32.2%, Rhode Island 28.9%, New Jersey 28.8%. These four states share a pattern: limited housing supply, strong remote-work in-migration from New York and Boston, and constrained metro-adjacent land.
| Code | State | Jan 2022 | Jan 2026 | % change |
|---|---|---|---|---|
| CT | Connecticut | $321,889 | $432,908 | ▲ +34.5% |
| NH | New Hampshire | $382,951 | $506,147 | ▲ +32.2% |
| RI | Rhode Island | $385,236 | $496,455 | ▲ +28.9% |
| NJ | New Jersey | $438,535 | $564,630 | ▲ +28.8% |
| WI | Wisconsin | $257,561 | $326,317 | ▲ +26.7% |
| OH | Ohio | $191,446 | $240,317 | ▲ +25.5% |
| KS | Kansas | $195,592 | $243,364 | ▲ +24.4% |
| IL | Illinois | $229,706 | $282,902 | ▲ +23.2% |
| ME | Maine | $329,626 | $405,314 | ▲ +23.0% |
| MA | Massachusetts | $532,997 | $654,682 | ▲ +22.8% |
The Lagging Markets: DC, Louisiana, and the Sun Belt Cool-Off
Only two places in the entire US have a lower ZHVI today than they did four years ago: the District of Columbia (−8.0%) and Louisiana (−2.2%). DC’s decline reflects the federal workforce’s post-pandemic dispersal and a softer office-centric downtown. Louisiana’s dip tracks with rising insurance premiums (driven by hurricane risk) and sustained out-migration from New Orleans. Beyond those two, several formerly red-hot markets have cooled sharply — Idaho at +1.6% and Arizona at +1.7% are now among the slowest-appreciating in the country after leading the 2020–2022 Sun Belt surge.
| Code | State | Jan 2022 | Jan 2026 | % change |
|---|---|---|---|---|
| DC | District of Columbia | $637,138 | $586,048 | ▼ -8.0% |
| LA | Louisiana | $214,103 | $209,417 | ▼ -2.2% |
| ID | Idaho | $465,139 | $472,542 | ▲ +1.6% |
| AZ | Arizona | $416,147 | $423,136 | ▲ +1.7% |
| CO | Colorado | $526,623 | $545,073 | ▲ +3.5% |
What Drives the Differences?
Three structural factors explain most of the variation across states. Land supply: in Hawaii, every desirable acre is either already developed, state- or federally-owned, or constrained by zoning for agricultural, conservation, or resort use. California adds active earthquake and coastal zoning on top of that. At the other end, West Virginia has abundant cheap land and declining population. Income levels: median household income correlates closely with state ZHVI (r ≈ 0.75). Massachusetts, Maryland, and New Jersey — the three highest-income states — sit at or near the top of the ZHVI ranking. Mississippi and West Virginia — two of the lowest-income states — anchor the bottom. Migration dynamics: states seeing net in-migration (FL, TN, TX, NC) tend to see sustained price pressure; states losing population (WV, MS, LA) see slower growth.
Policy choices compound all three. California’s Proposition 13 (1978) caps property-tax reassessment, incentivising owners to stay in place rather than sell — which chokes supply. Texas’s no-state-income-tax regime attracts high earners and pushes up prices in Austin and Dallas specifically. New York’s rent-stabilisation laws compress the rental market but do little to soften sale prices. And in Louisiana and Florida, the post-2022 home-insurance crisis has quietly become a de-facto price ceiling for new buyers who can’t secure affordable coverage.
How the Zillow Home Value Index Is Calculated
The Zillow Home Value Index is not a simple median. It’s a smoothed, seasonally adjusted measure of the typical home value for homes in the 35th-to-65th percentile range within a region. That narrow band is chosen deliberately: it excludes both rock-bottom distressed sales and luxury outliers, giving a more stable reading of what “typical” means. The series is published monthly, and each monthly figure is a model estimate (not a transaction average) — Zillow uses their Zestimate algorithm to value every home they track, then aggregates.
Two implications for interpretation. First, ZHVI includes all homes that exist, not just those that sold — so it isn’t distorted by who happens to be transacting in any given month. Second, the model’s smoothing means one-off sharp movements in transaction medians (which can be noisy at the state level) are absorbed across trailing months. This makes ZHVI excellent for identifying trends and inter-regional comparisons; it’s less useful for predicting this week’s listing prices. For a deeper dive, Zillow publishes its full methodology note online.
All values are Zillow Home Value Index (ZHVI) state-level time series, typical home value for all homes. Figures correspond to January 2026. Percentage changes are calculated against January 2022.
🗺️ Go Deeper: Interactive Tools
Discover all our free interactive maps and tools.


