Key Takeaways
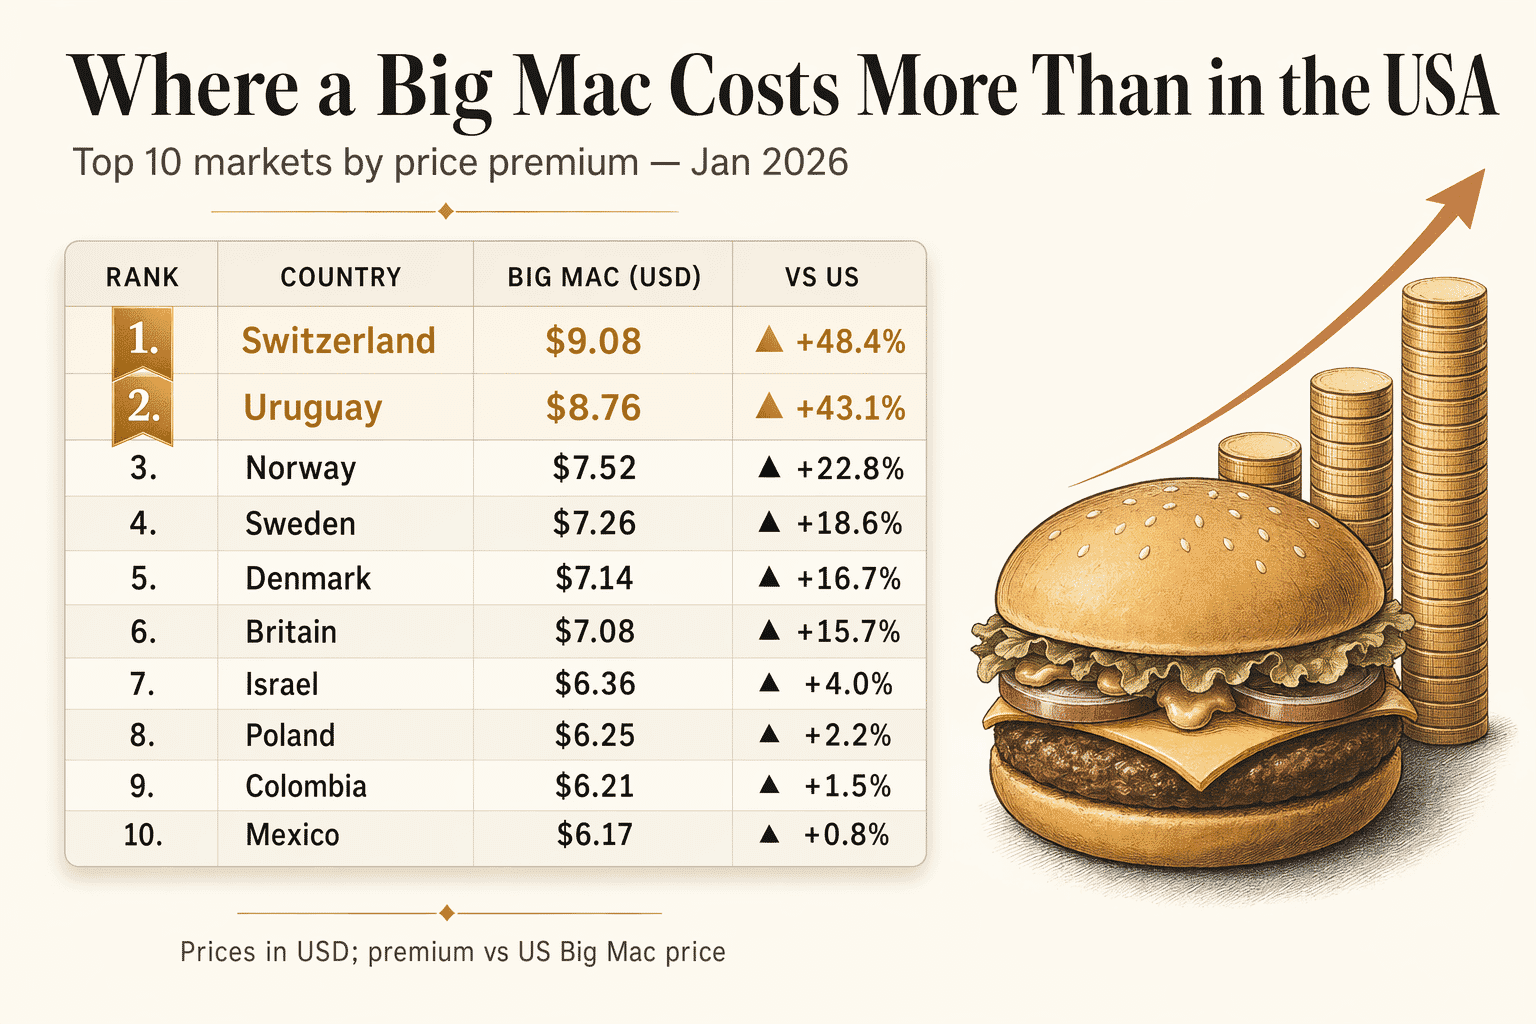
- Switzerland has the world's most expensive Big Mac — $9.08. That's +48.4% above the US price of $6.12, making the franc the most overvalued currency in the 54-country index by Big Mac parity.
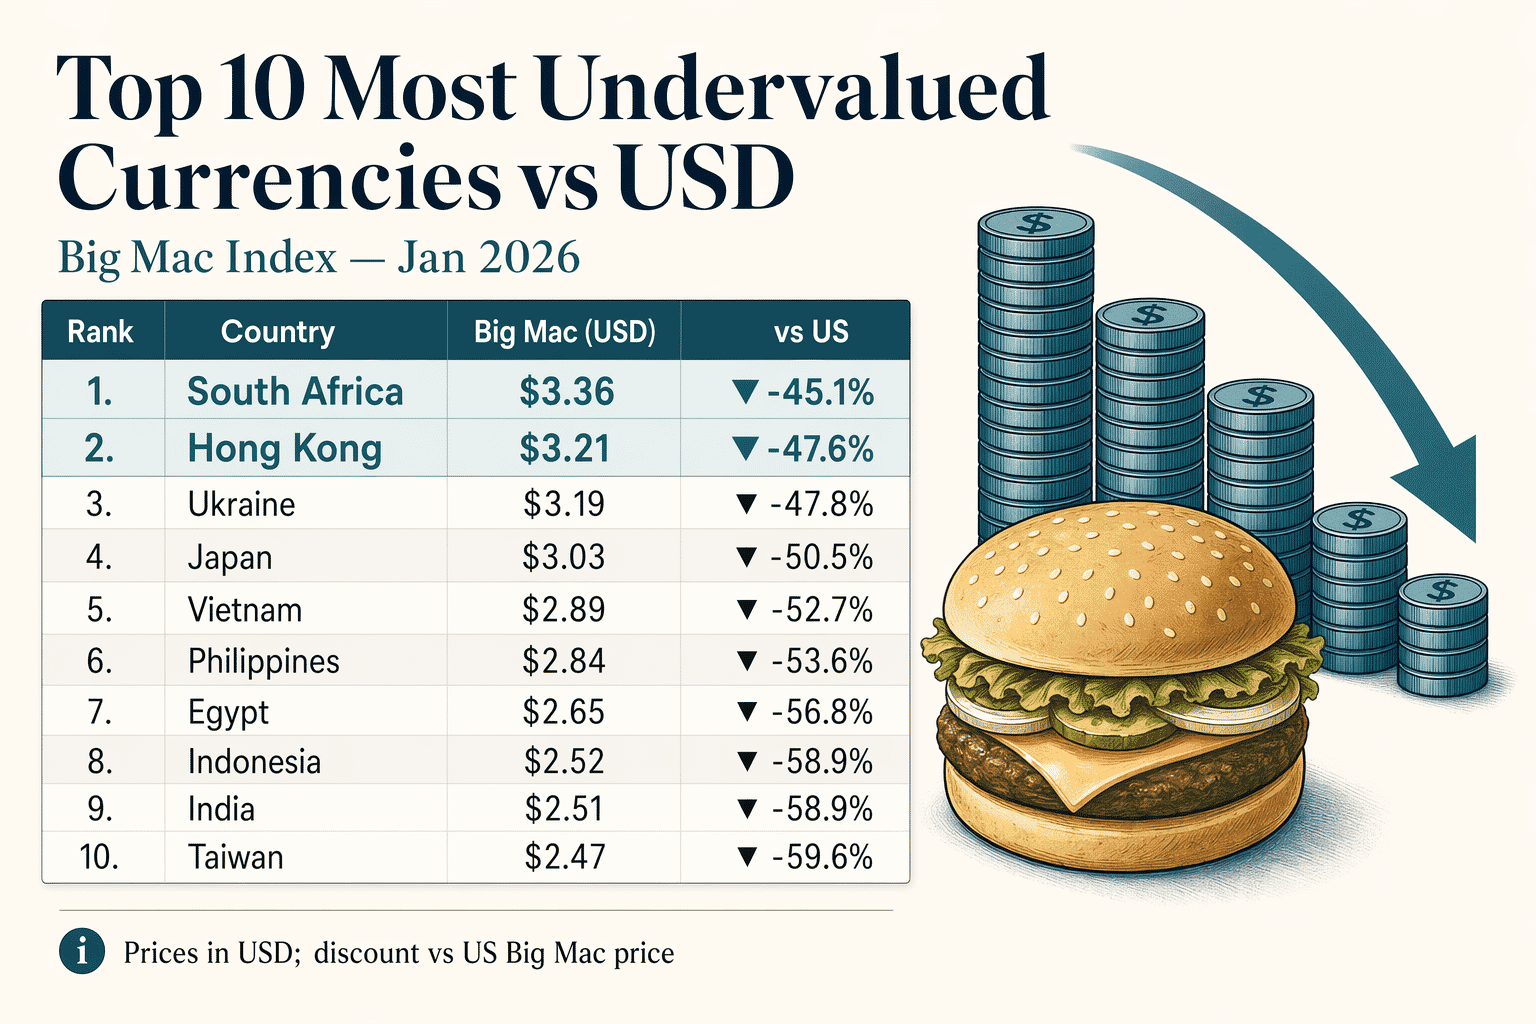
- Taiwan has the cheapest Big Mac — $2.47. An under-valuation of 59.6% vs the US dollar. The ten cheapest Big Macs are all in Asia (except Egypt), highlighting how much purchasing power a tourist gains there.
- US Big Mac: $6.12 (the global reference). The Economist uses the US price as the baseline for all over/undervaluation calculations. The US price rose from $5.69 in July 2024 to $6.12 in January 2026, reflecting the post-pandemic US restaurant inflation.
- Euro area Big Mac: $7.05 (15.3% overvalued). Across Eurozone countries, a Big Mac costs €6.55 on average. Germany, France, Ireland, and the Netherlands anchor the upper end; Greece, Portugal, and Estonia sit closer to parity.
- The gap: 3.7× between cheapest and priciest. $2.47 in Taiwan vs $9.08 in Switzerland — a 3.7x ratio. That's a stand-in measure for how much purchasing power differs across the world for everyday middle-income goods.
The Big Mac Index is The Economist’s informal 40-year-old measure of whether a country’s currency is over- or undervalued against the US dollar. The logic is simple: if purchasing power parity held, a Big Mac — a standardised bundle of beef, bun, cheese, sauce, lettuce, restaurant rent, and local wages — would cost the same in every country once converted to a single currency. It doesn’t. In January 2026, a Big Mac cost $6.12 in the United States, $9.08 in Switzerland, and $2.47 in Taiwan. Those gaps are the Index.
The Economist first published the Big Mac Index in September 1986, and it has been a standard PPP reference ever since — quoted in academic papers, cited by finance ministers, and reprinted in economics textbooks. This page tracks the January 2026 release across 54 countries, with our choropleth map below plus the full ranking, biggest over- and undervaluations, historical context, and the index’s well-known limitations.
Full Ranking: Big Mac Prices Worldwide, January 2026
The table below lists all 54 economies covered by The Economist in the January 2026 release. Prices are in US dollars at the prevailing exchange rate; the rightmost column shows the raw over- or under-valuation against the US baseline of $6.12. Values in green (▲) indicate the currency is overvalued against the US dollar by PPP; red (▼) indicates undervalued.
| Rank | Country / Area | Big Mac (USD) | vs US |
|---|---|---|---|
| 1 | 🇨🇭 Switzerland | $9.08 | ▲ +48.4% |
| 2 | 🇺🇾 Uruguay | $8.76 | ▲ +43.1% |
| 3 | 🇳🇴 Norway | $7.52 | ▲ +22.8% |
| 4 | 🇸🇪 Sweden | $7.26 | ▲ +18.6% |
| 5 | 🇩🇰 Denmark | $7.14 | ▲ +16.7% |
| 6 | 🇬🇧 Britain | $7.08 | ▲ +15.7% |
| 7 | 🇪🇺 Euro area | $7.05 | ▲ +15.3% |
| 8 | 🇮🇱 Israel | $6.36 | ▲ +4.0% |
| 9 | 🇵🇱 Poland | $6.25 | ▲ +2.2% |
| 10 | 🇨🇴 Colombia | $6.21 | ▲ +1.5% |
| 11 | 🇲🇽 Mexico | $6.17 | ▲ +0.8% |
| 12 | 🇺🇸 United States | $6.12 | ■ 0.0% |
| 13 | 🇨🇷 Costa Rica | $6.04 | ▼ -1.3% |
| 14 | 🇹🇷 Turkey | $5.90 | ▼ -3.5% |
| 15 | 🇸🇬 Singapore | $5.78 | ▼ -5.5% |
| 16 | 🇦🇺 Australia | $5.69 | ▼ -7.0% |
| 17 | 🇨🇦 Canada | $5.54 | ▼ -9.4% |
| 18 | 🇦🇷 Argentina | $5.53 | ▼ -9.6% |
| 19 | 🇨🇿 Czech Republic | $5.50 | ▼ -10.2% |
| 20 | 🇨🇱 Chile | $5.42 | ▼ -11.4% |
| 21 | 🇱🇧 Lebanon | $5.36 | ▼ -12.4% |
| 22 | United Arab Emirates | $5.17 | ▼ -15.5% |
| 23 | 🇸🇦 Saudi Arabia | $5.07 | ▼ -17.2% |
| 24 | 🇭🇳 Honduras | $5.06 | ▼ -17.3% |
| 25 | 🇵🇪 Peru | $5.03 | ▼ -17.8% |
| 26 | 🇭🇺 Hungary | $4.99 | ▼ -18.4% |
| 27 | 🇳🇿 New Zealand | $4.94 | ▼ -19.3% |
| 28 | Bahrain | $4.77 | ▼ -22.0% |
| 29 | 🇳🇮 Nicaragua | $4.75 | ▼ -22.4% |
| 30 | 🇶🇦 Qatar | $4.67 | ▼ -23.7% |
| 31 | 🇰🇼 Kuwait | $4.54 | ▼ -25.8% |
| 32 | 🇧🇷 Brazil | $4.45 | ▼ -27.3% |
| 33 | 🇬🇹 Guatemala | $4.30 | ▼ -29.7% |
| 34 | 🇹🇭 Thailand | $4.30 | ▼ -29.7% |
| 35 | 🇲🇩 Moldova | $4.09 | ▼ -33.2% |
| 36 | 🇻🇪 Venezuela | $4.04 | ▼ -33.9% |
| 37 | 🇷🇴 Romania | $3.98 | ▼ -35.0% |
| 38 | Oman | $3.97 | ▼ -35.1% |
| 39 | 🇦🇿 Azerbaijan | $3.91 | ▼ -36.2% |
| 40 | 🇵🇰 Pakistan | $3.86 | ▼ -36.9% |
| 41 | 🇰🇷 South Korea | $3.74 | ▼ -38.9% |
| 42 | 🇨🇳 China | $3.66 | ▼ -40.2% |
| 43 | 🇯🇴 Jordan | $3.53 | ▼ -42.3% |
| 44 | 🇲🇾 Malaysia | $3.39 | ▼ -44.6% |
| 45 | 🇿🇦 South Africa | $3.36 | ▼ -45.1% |
| 46 | 🇭🇰 Hong Kong | $3.21 | ▼ -47.6% |
| 47 | 🇺🇦 Ukraine | $3.19 | ▼ -47.8% |
| 48 | 🇯🇵 Japan | $3.03 | ▼ -50.5% |
| 49 | 🇻🇳 Vietnam | $2.89 | ▼ -52.7% |
| 50 | 🇵🇭 Philippines | $2.84 | ▼ -53.6% |
| 51 | 🇪🇬 Egypt | $2.65 | ▼ -56.8% |
| 52 | 🇮🇩 Indonesia | $2.52 | ▼ -58.9% |
| 53 | 🇮🇳 India | $2.51 | ▼ -58.9% |
| 54 | 🇹🇼 Taiwan | $2.47 | ▼ -59.6% |
Most Overvalued Currencies: The Swiss + Nordic Premium
The top of the ranking is dominated by Switzerland and Nordic / Western European economies. The Swiss franc is 48.4% above PPP — a reading that has held for over a decade and reflects Switzerland’s persistent current-account surplus, high wages, and expensive commercial rents. Uruguay comes in second at 43.1% overvalued, an unusual entry for an emerging-market currency driven by a combination of restaurant-sector concentration and recent peso appreciation.
Most Undervalued Currencies: Asia and Egypt Dominate the Cheap Tier
The bottom of the ranking is almost entirely Asian, with Egypt as the only non-Asian entry in the bottom 10. Taiwan (-59.6%), India (-58.9%), and Indonesia (-58.9%) offer a Big Mac for roughly a third of the US price — a stand-in for how much cheaper everyday restaurant meals are in these economies. Japan‘s undervaluation (-50.5%) is particularly striking given its advanced-economy status and reflects the yen’s persistent post-2022 weakness against the dollar.
40 Years of the Big Mac Index
The Economist published the first Big Mac Index in its September 1986 issue, conceived as a “light-hearted guide” by then-economics-editor Pam Woodall. The premise drew on the decades-old purchasing power parity theory championed by Gustav Cassel in the 1920s: in the long run, nominal exchange rates should converge so that identical traded goods cost the same anywhere. The Economist’s innovation was to pick a single, near-universally-available product — the McDonald’s Big Mac — and use its price to check whether currencies hit or missed PPP.
The Index has been published twice a year (January and July) ever since. In 2011 The Economist added a GDP-adjusted variant that controls for how rich a country is, recognising that services and non-traded inputs (labour, rent, advertising) are structurally cheaper in poorer economies. In 2019 they open-sourced the underlying data on GitHub, making the dataset properly reproducible. The Index has been cited in several Nobel-laureate papers on exchange-rate economics and remains one of the most-requested Economist infographics on social media.
How the Big Mac Index Is Calculated
The calculation is deliberately transparent. Step 1: The Economist collects the local-currency price of a Big Mac in each surveyed country from McDonald’s corporate or franchisee websites, or via in-country correspondents. Step 2: that price is converted to US dollars at the current market exchange rate. Step 3: the raw over- or undervaluation vs the US dollar is computed as (local USD price − US USD price) / US USD price. In January 2026 the US price is $6.12, so a country where a Big Mac costs $9.00 in USD terms is overvalued by (9.00 − 6.12) / 6.12 ≈ +47% — roughly Switzerland’s reading.
The GDP-adjusted index corrects for a known structural problem: poor countries systematically look “undervalued” on the raw index because wages and rent are cheaper, not because their currency is objectively weak. The adjusted variant regresses Big Mac prices on GDP per capita and reports each country’s deviation from its predicted price. Under this view, India and Indonesia look closer to fair value, while Switzerland and the Eurozone remain overvalued but by narrower margins.
Why a Burger Can’t Tell You Everything
The Big Mac Index is useful but limited — something The Economist has always been upfront about. Four critiques dominate the academic literature. Non-traded inputs: most of a Big Mac’s cost is local — rent, wages, marketing — not the traded beef and packaging, so PPP logic only partially applies. Market structure: McDonald’s has very different market power across countries. In India it’s a premium brand targeting the urban middle class; in the US it’s a value-tier option. Prices are set accordingly. Coverage: the Index excludes countries where McDonald’s doesn’t operate (notably most of Africa, Iran, North Korea). Relative, not absolute: the Index tells you whether a currency is over or undervalued relative to the US dollar at this moment — not whether the dollar itself is “correctly” priced. For deeper currency analysis, the IMF’s REER (Real Effective Exchange Rate) series and the BIS broad real-effective indices are more rigorous.
Treat the Big Mac Index as a thermometer, not a verdict. It’s an accessible way to see which currencies are stretched on the cheap-end and expensive-end tails, and it’s produced consistently for nearly four decades — a rare dataset in that regard.
All prices and over/undervaluation figures come from The Economist's January 2026 Big Mac Index. Data covers 54 economies; the US price is used as the baseline for comparison.
For a broader cost-of-living comparison, see our map of the price level index by country.


