Key Takeaways
- Arkansas & Mississippi are the cheapest. Both sit about 13% below the U.S. average price level, followed by Iowa, Oklahoma and Louisiana — the South and Great Plains dominate the low end.
- Housing is the deciding factor. Goods cost roughly the same everywhere, but housing swings enormously — around 55–60% of the U.S. average in the cheapest states versus well over 100% on the coasts.
- The priciest states cost ~25% more. California, Hawaii, Washington D.C., New Jersey and New York all run 8–11% above the U.S. average — so a dollar stretches about a quarter further in Arkansas than in California.
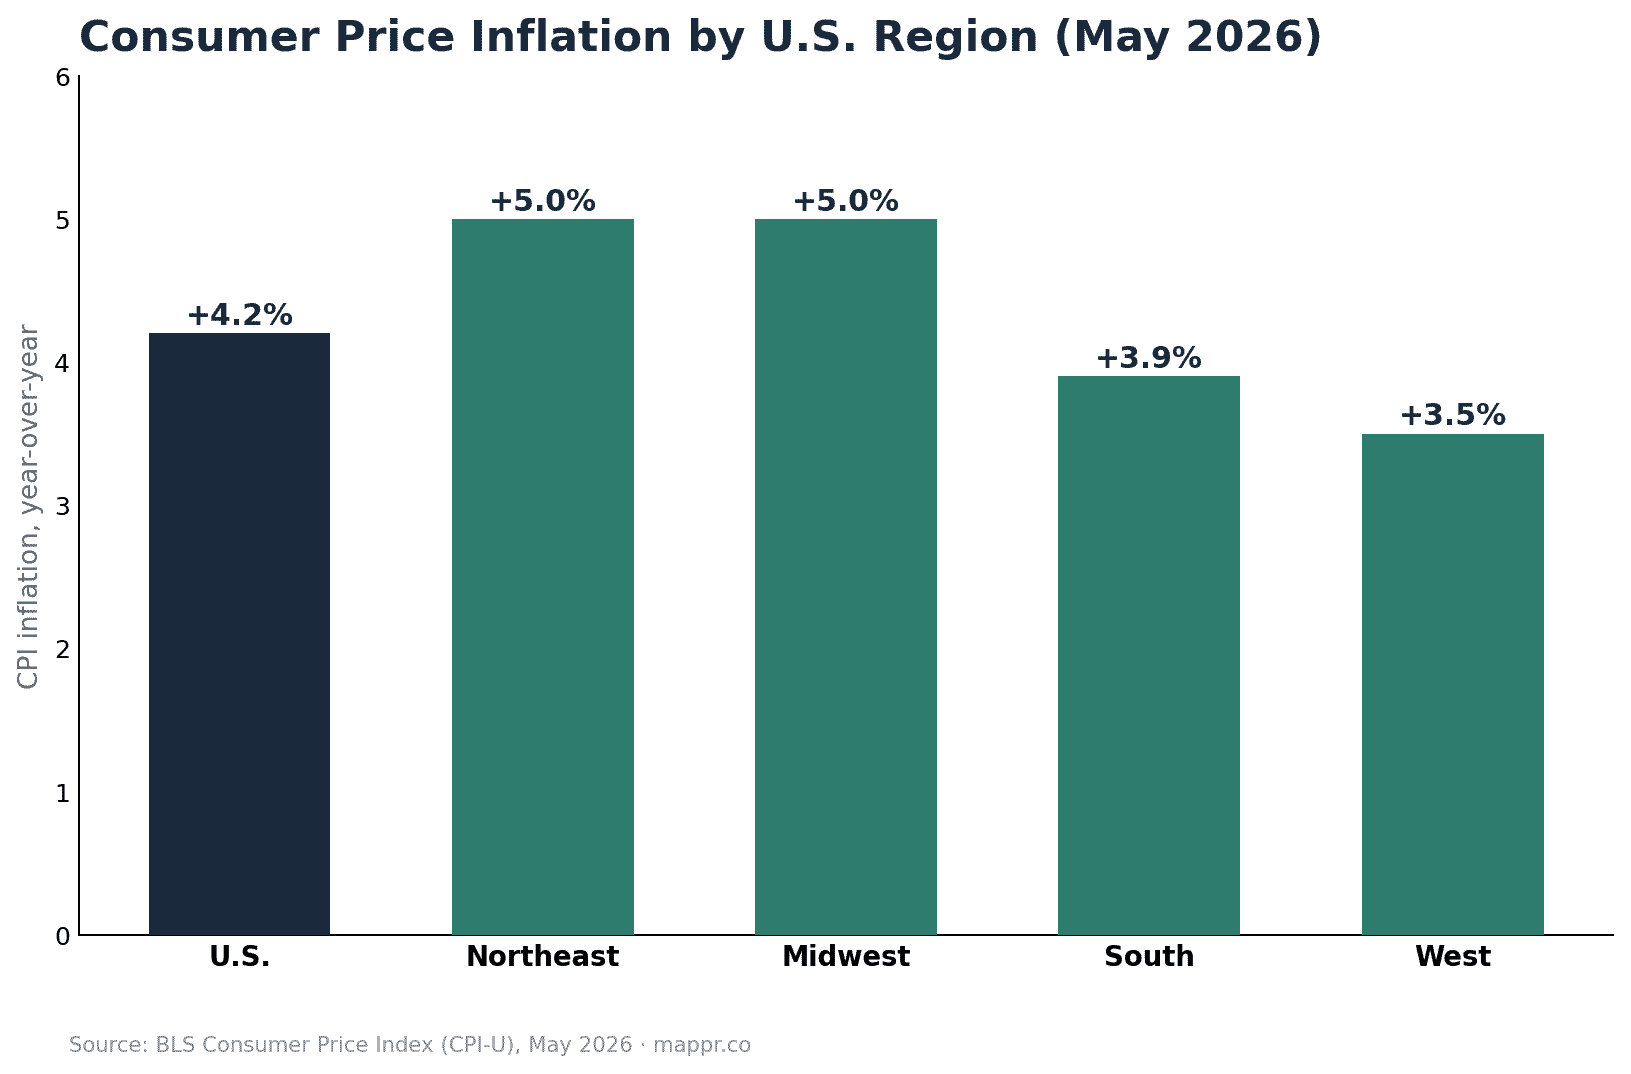
- Prices still rising in 2026. Consumer prices were up +4.2% year-over-year nationally (May 2026), with the Northeast and Midwest running hottest at +5.0%.
- "Cheap" means price level, not income. Low-cost states also tend to have lower wages — affordability is about how far your money goes locally, measured here by federal Regional Price Parities.
Where your money goes furthest in America depends enormously on where you live. The federal government measures this with Regional Price Parities (RPPs) — an index of the overall price level in each state where the U.S. average equals 100. By that measure, the cheapest states cluster firmly in the South and Great Plains, while the coasts and the Northeast are the most expensive. Here is the full 2026 picture, mapped.
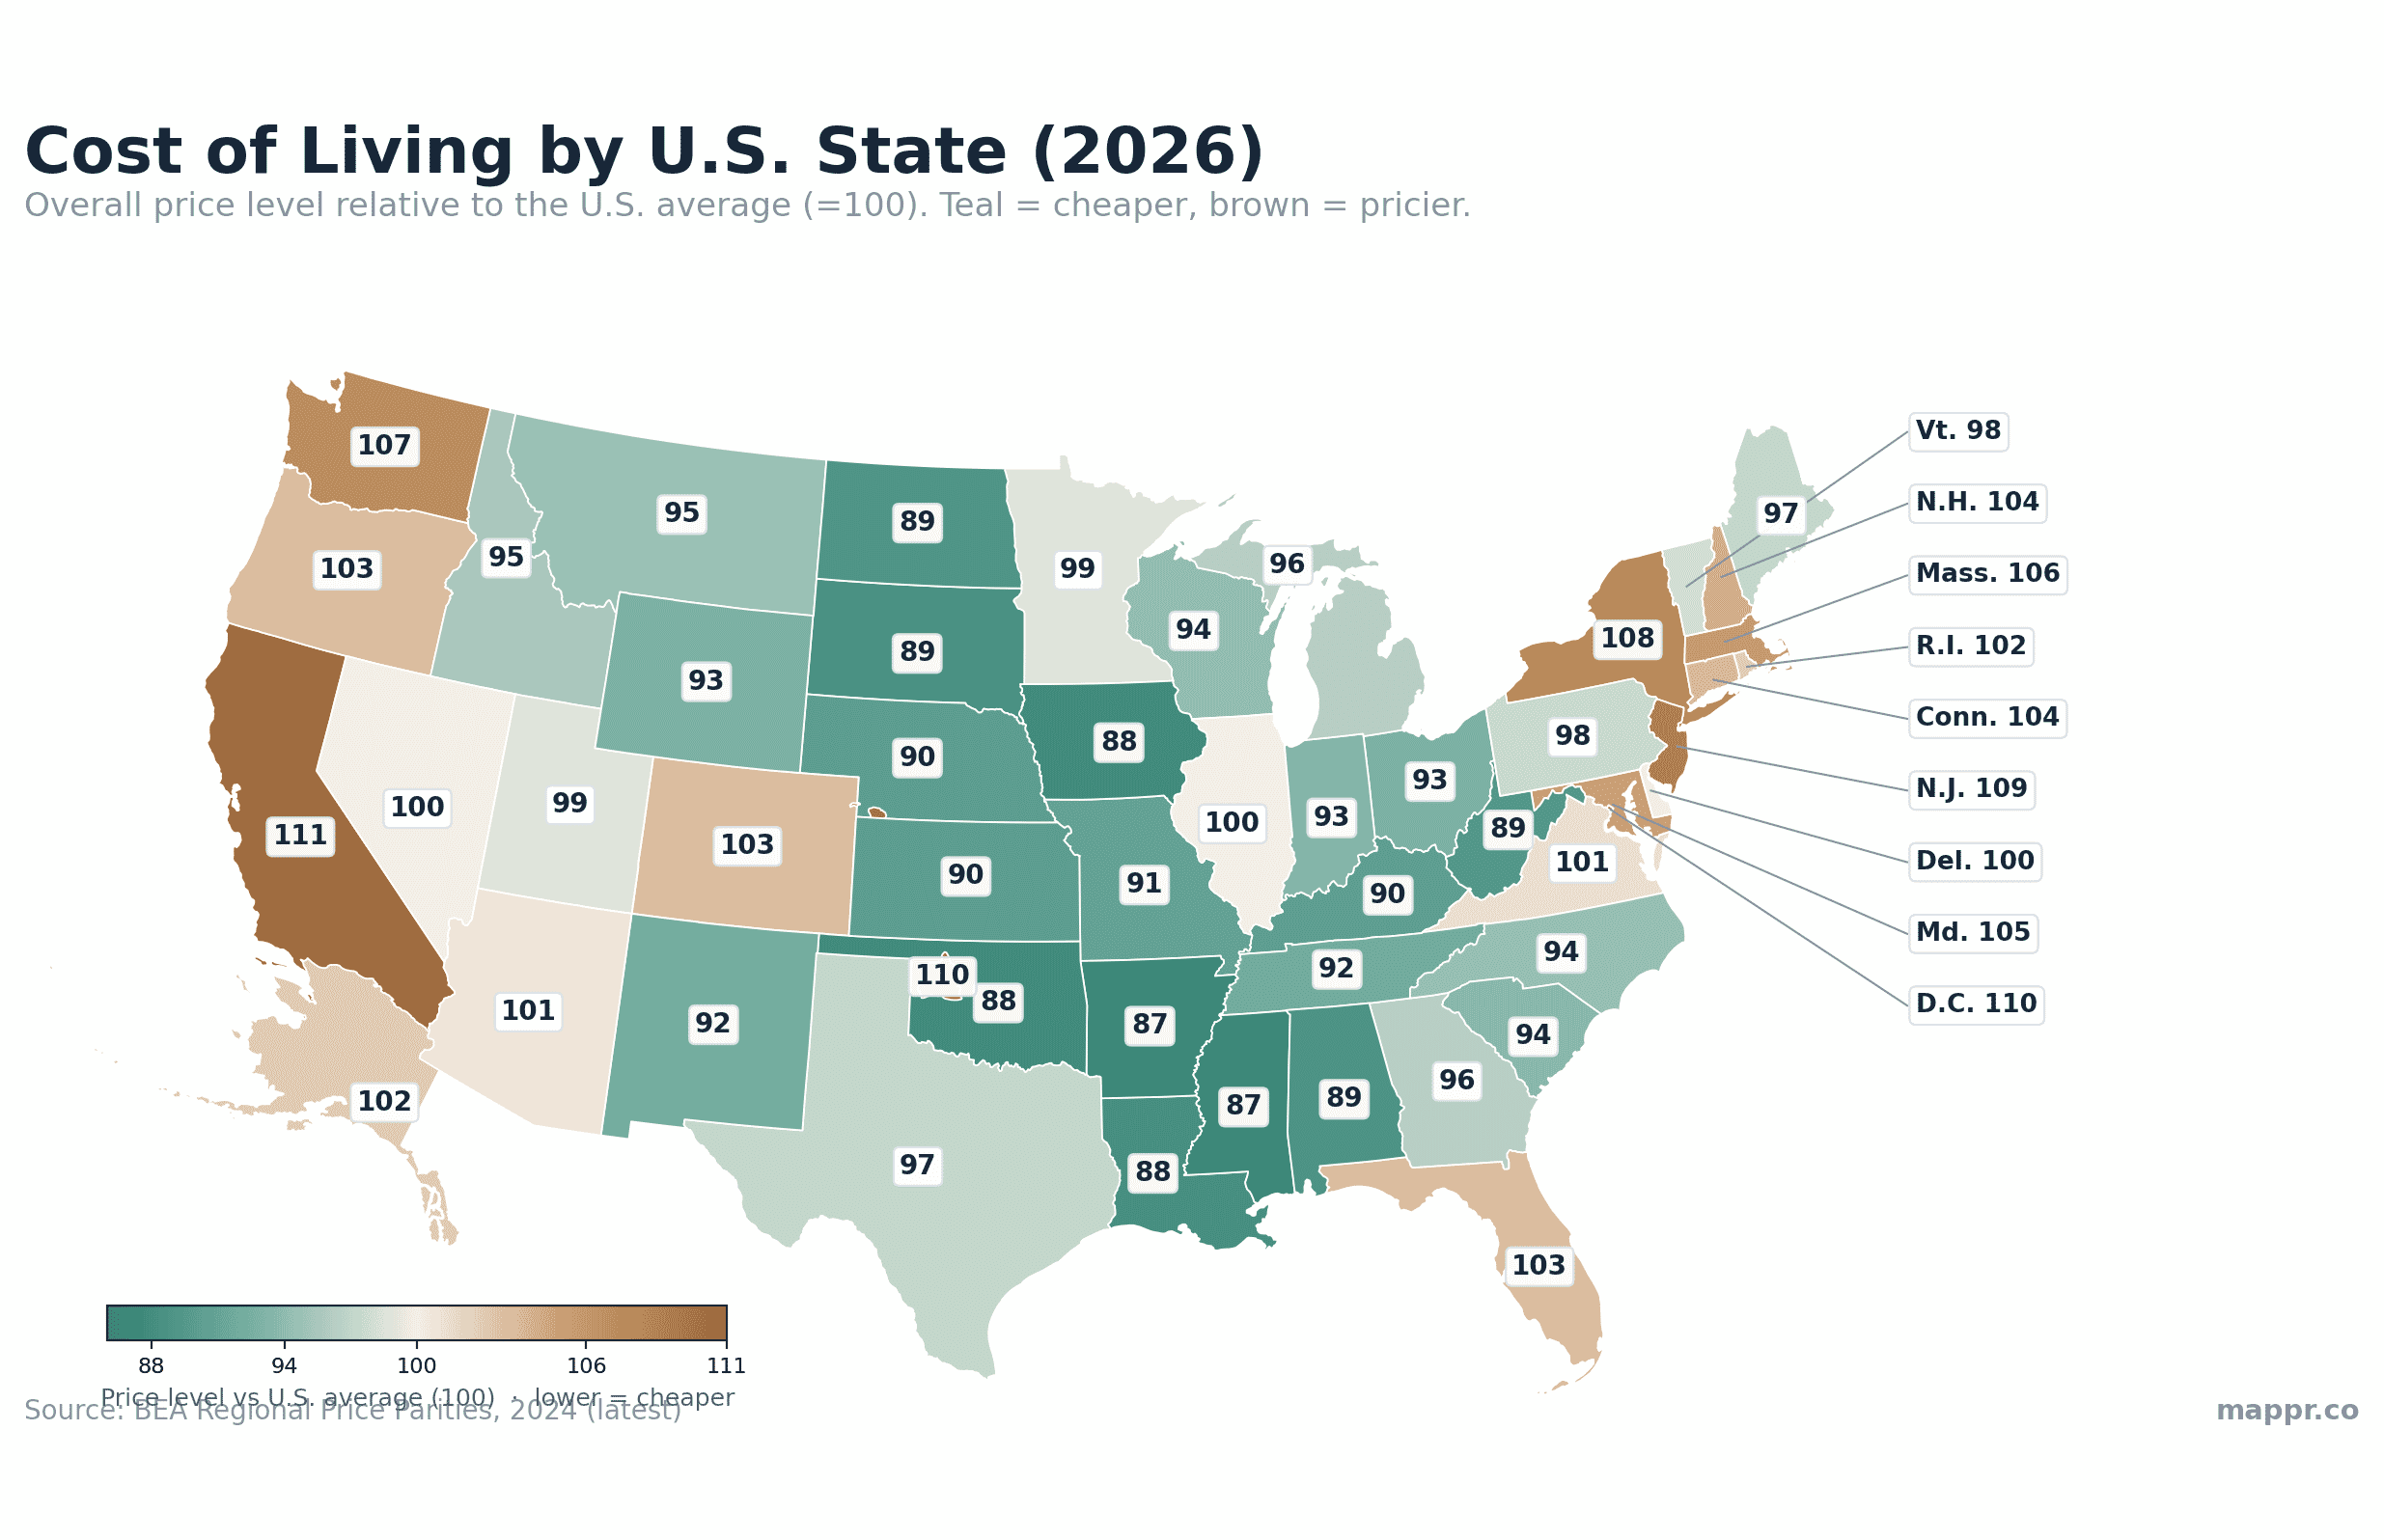
Cost of living by U.S. state, mapped
On the map below, teal states are cheaper than the U.S. average and brown states are more expensive. A clear pattern emerges: a broad band of affordability runs through the South and the Plains, while California, the Northeast corridor and Hawaii sit well above the line.
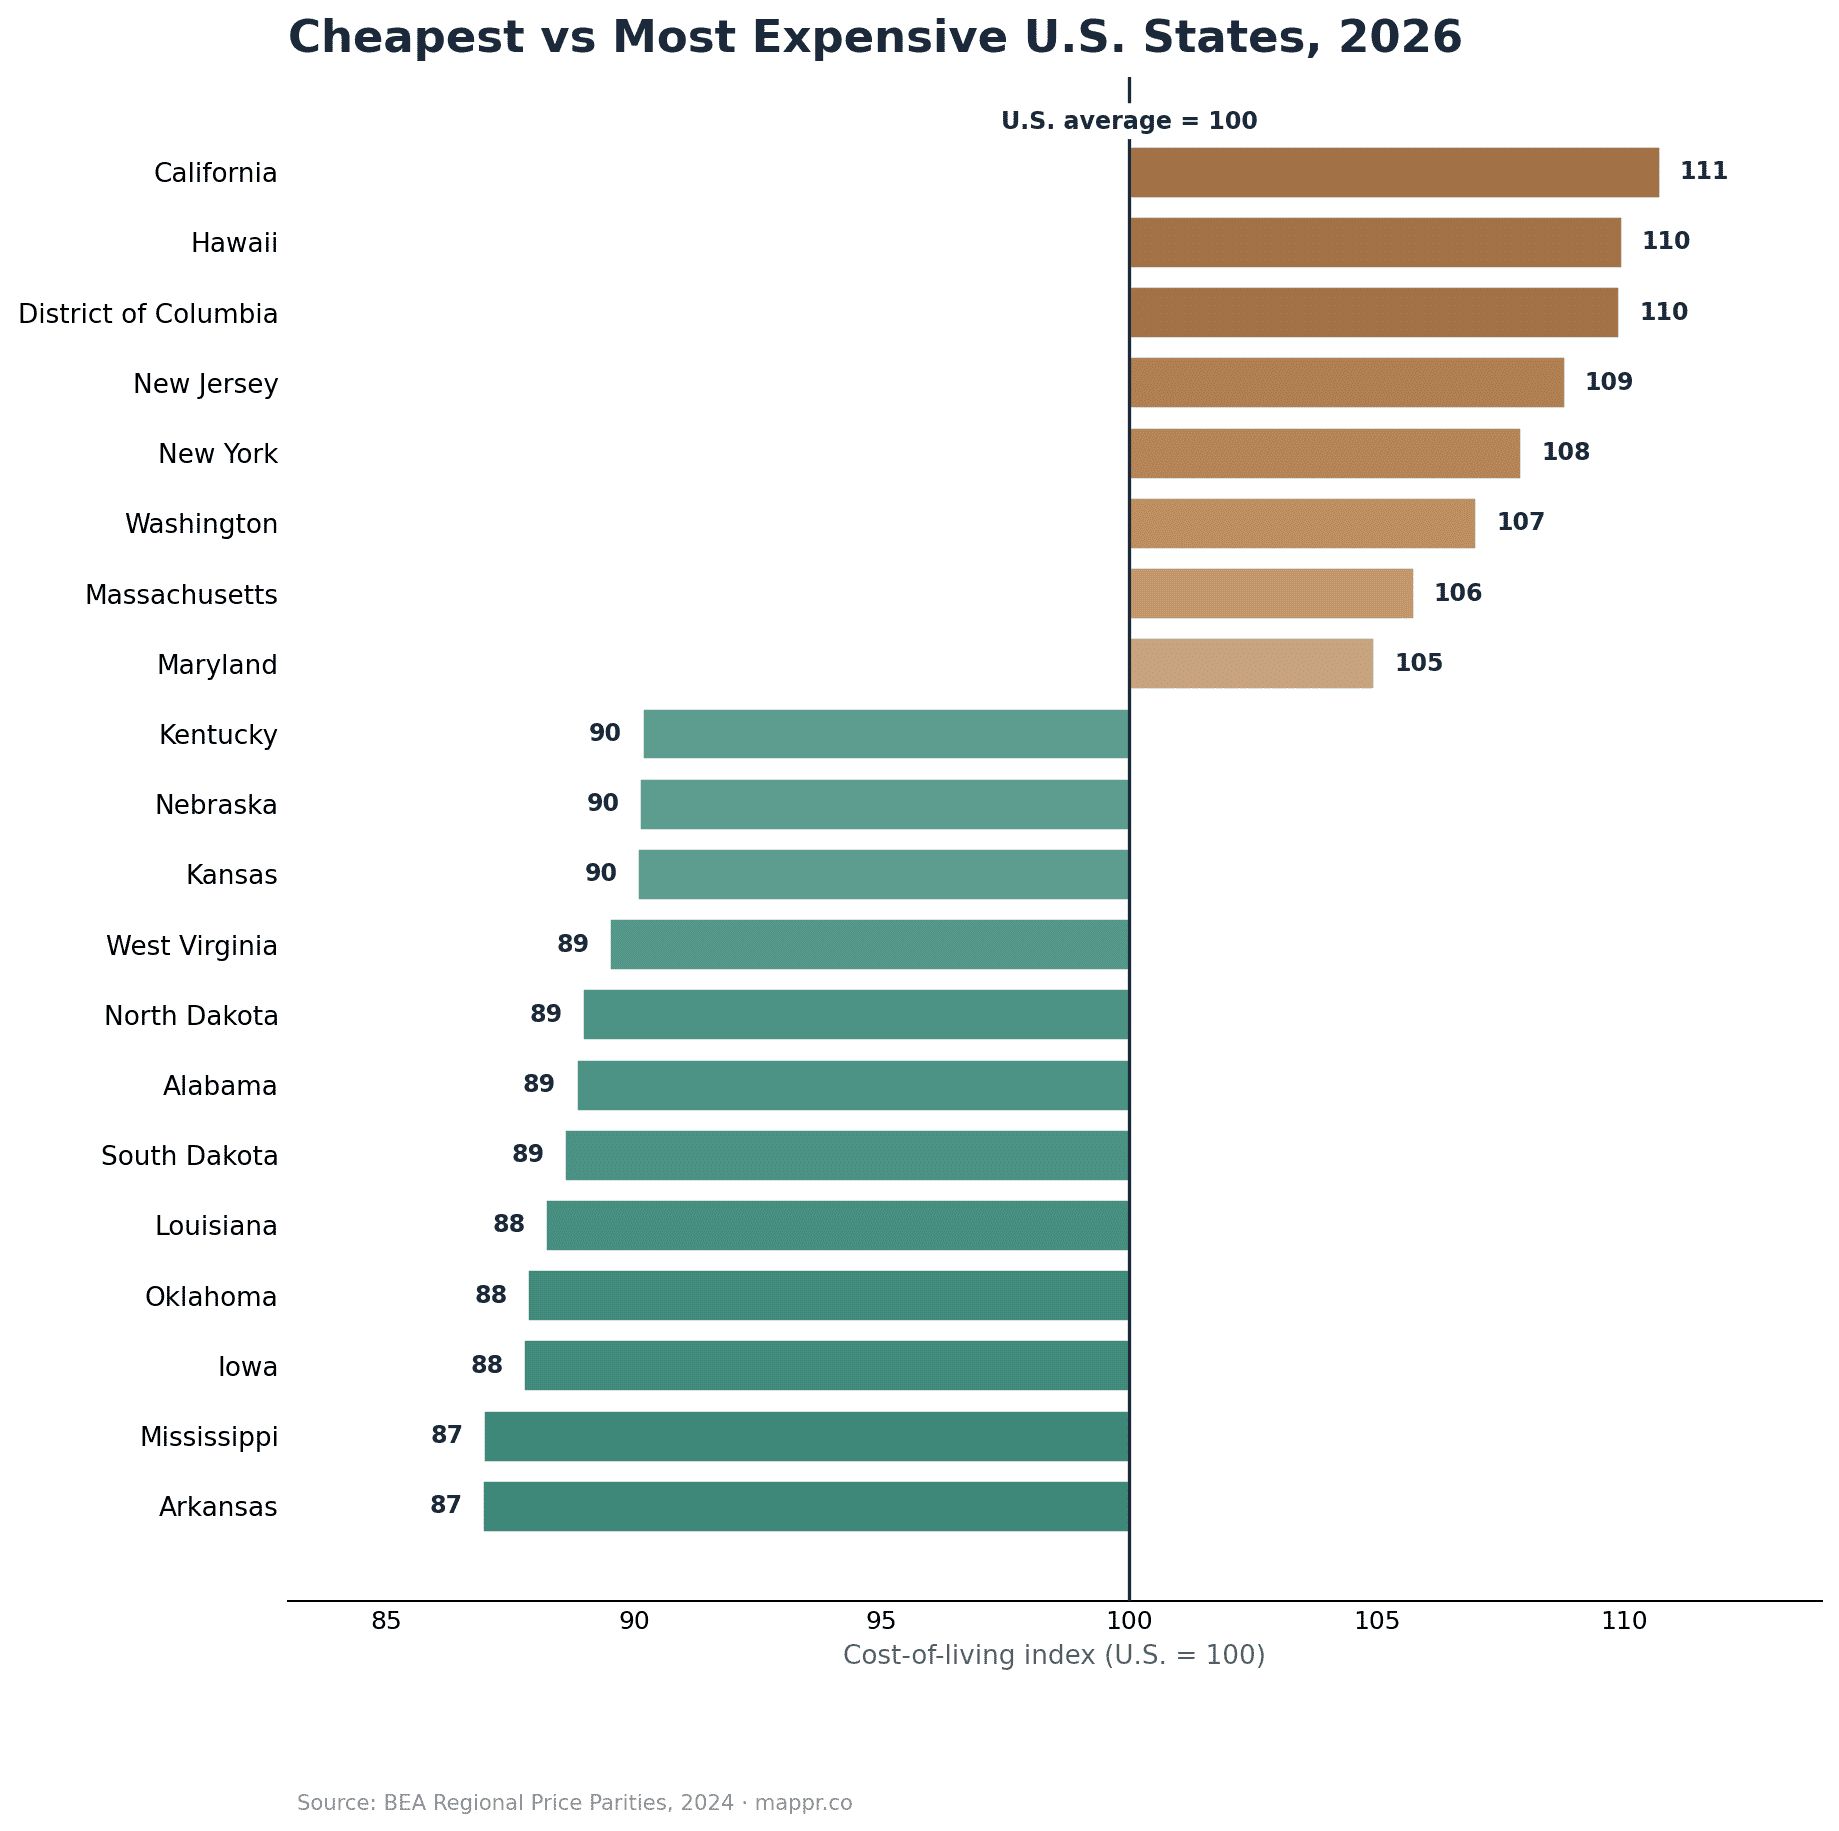
The cheapest (and most expensive) states
Arkansas and Mississippi are the most affordable states in the country, with overall price levels about 13% below the national average. Iowa, Oklahoma, Louisiana, South Dakota and Alabama round out the cheapest tier. At the other extreme, California is the priciest state (about 11% above average), just ahead of Hawaii, Washington D.C., New Jersey and New York. In practical terms, a dollar buys roughly a quarter more in Arkansas than it does in California.
Why these states are so cheap: it’s housing
Break the index into its parts and the reason is obvious. The cost of goods (groceries, fuel, retail) barely moves from state to state — typically within a few points of the national average — because they’re traded nationally. What really separates cheap states from expensive ones is housing. In Arkansas, Mississippi and West Virginia, housing costs run barely over half the national average, while in coastal states they can be double. The full table below — sortable and searchable — shows the breakdown for all 51 states and D.C.
| Rank | State | Overall (US=100) | Housing | Goods | Utilities | Other services |
|---|---|---|---|---|---|---|
| 1 | Arkansas | 86.9 | 58 | 94 | 75 | 95 |
| 2 | Mississippi | 87.0 | 56 | 96 | 78 | 96 |
| 3 | Iowa | 87.8 | 65 | 94 | 83 | 93 |
| 4 | Oklahoma | 87.8 | 63 | 94 | 74 | 95 |
| 5 | Louisiana | 88.2 | 63 | 94 | 71 | 96 |
| 6 | South Dakota | 88.6 | 68 | 95 | 80 | 92 |
| 7 | Alabama | 88.8 | 62 | 96 | 85 | 97 |
| 8 | North Dakota | 89.0 | 71 | 96 | 74 | 91 |
| 9 | West Virginia | 89.5 | 54 | 97 | 92 | 100 |
| 10 | Kansas | 90.1 | 71 | 94 | 88 | 94 |
| 11 | Nebraska | 90.1 | 75 | 94 | 76 | 93 |
| 12 | Kentucky | 90.2 | 64 | 96 | 75 | 97 |
| 13 | Missouri | 90.8 | 70 | 96 | 79 | 95 |
| 14 | Tennessee | 91.9 | 79 | 96 | 72 | 95 |
| 15 | New Mexico | 92.2 | 74 | 96 | 78 | 99 |
| 16 | Wyoming | 92.7 | 71 | 95 | 78 | 100 |
| 17 | Ohio | 92.8 | 73 | 94 | 96 | 99 |
| 18 | Indiana | 93.3 | 74 | 96 | 86 | 99 |
| 19 | South Carolina | 93.7 | 80 | 96 | 88 | 98 |
| 20 | Wisconsin | 94.1 | 79 | 94 | 90 | 100 |
| 21 | North Carolina | 94.3 | 81 | 97 | 89 | 98 |
| 22 | Montana | 94.6 | 85 | 96 | 72 | 99 |
| 23 | Idaho | 95.5 | 90 | 96 | 70 | 99 |
| 24 | Michigan | 96.2 | 82 | 96 | 100 | 101 |
| 25 | Georgia | 96.3 | 89 | 99 | 93 | 97 |
| 26 | Maine | 97.0 | 79 | 97 | 135 | 103 |
| 27 | Texas | 97.1 | 97 | 98 | 88 | 97 |
| 28 | Pennsylvania | 97.6 | 85 | 99 | 109 | 100 |
| 29 | Vermont | 98.0 | 87 | 97 | 126 | 102 |
| 30 | Minnesota | 98.6 | 91 | 101 | 91 | 100 |
| 31 | Utah | 98.9 | 108 | 96 | 79 | 99 |
| 32 | Delaware | 99.8 | 102 | 96 | 104 | 101 |
| 33 | Illinois | 100.0 | 94 | 104 | 85 | 100 |
| 34 | Nevada | 100.0 | 114 | 96 | 91 | 99 |
| 35 | Arizona | 100.7 | 107 | 95 | 92 | 103 |
| 36 | Virginia | 101.1 | 107 | 100 | 92 | 100 |
| 37 | Rhode Island | 102.3 | 106 | 97 | 147 | 103 |
| 38 | Alaska | 102.4 | 94 | 106 | 119 | 102 |
| 39 | Colorado | 103.1 | 127 | 99 | 85 | 100 |
| 40 | Oregon | 103.4 | 109 | 105 | 107 | 100 |
| 41 | Florida | 103.4 | 122 | 98 | 90 | 101 |
| 42 | Connecticut | 103.6 | 117 | 97 | 146 | 103 |
| 43 | New Hampshire | 104.2 | 115 | 99 | 134 | 104 |
| 44 | Maryland | 105.0 | 121 | 103 | 111 | 102 |
| 45 | Massachusetts | 105.8 | 128 | 99 | 152 | 103 |
| 46 | Washington | 107.0 | 126 | 104 | 93 | 104 |
| 47 | New York | 107.9 | 122 | 107 | 134 | 104 |
| 48 | New Jersey | 108.8 | 134 | 107 | 114 | 104 |
| 49 | District of Columbia | 109.9 | 155 | 107 | 113 | 103 |
| 50 | Hawaii | 110.0 | 125 | 112 | 190 | 103 |
| 51 | California | 110.7 | 154 | 106 | 159 | 103 |
The 2026 inflation backdrop
Affordability is also moving. The Bureau of Labor Statistics’ Consumer Price Index shows prices up +4.2% year-over-year nationally as of May 2026. Inflation isn’t even across the country: the Northeast and Midwest are running hottest at +5.0%, while the West (+3.5%) and South (+3.9%) are cooler — meaning the affordable southern states are also seeing slightly slower price growth.
A note on the data
The Consumer Price Index (CPI) tracks how prices change over time, but the BLS only publishes it nationally, for four broad regions and for some metro areas — there is no state-by-state CPI. To compare price levels between states, the standard federal measure is the Bureau of Economic Analysis’ Regional Price Parities, used for the ranking and map here. We pair it with the latest BLS CPI for the national inflation picture.
The bottom line
If stretching a budget is the goal, the South and the Plains win on price — led by Arkansas and Mississippi — almost entirely because housing is so much cheaper there. Just remember that lower costs usually come with lower local wages, so the real question isn’t just what things cost, but what they cost relative to what you earn.