The world spent $2.65 trillion on military defense in 2024 — the highest figure ever recorded and a continuation of nine consecutive years of growth. From Russia’s war in Ukraine to China’s military modernization and NATO’s rearmament push, defense budgets are surging across every continent.
Using data from the SIPRI Military Expenditure Database — the gold standard for global defense spending analysis — we’ve mapped military expenditure for 149 countries, broken down by total spending, per capita figures, GDP share, and how dramatically budgets have shifted since 2020.
Key Takeaways
- Global military spending reached $2.65 trillion in 2024, up 9.4% from 2023 in real terms — the steepest single-year increase in over a decade.
- The United States spent $997.3 billion — nearly 38% of the world total and more than the next 9 countries combined.
- Ukraine’s defense budget surged 846% since 2020, reaching $64.7 billion (34.5% of GDP) — the highest burden-to-GDP ratio of any country.
- Poland leads NATO’s rearmament at 4.2% of GDP, while Germany made the largest absolute increase in Europe (+66% since 2020).
- Israel spends the most per capita at $4,989 per person, followed by the US ($2,895) and Singapore ($2,591).
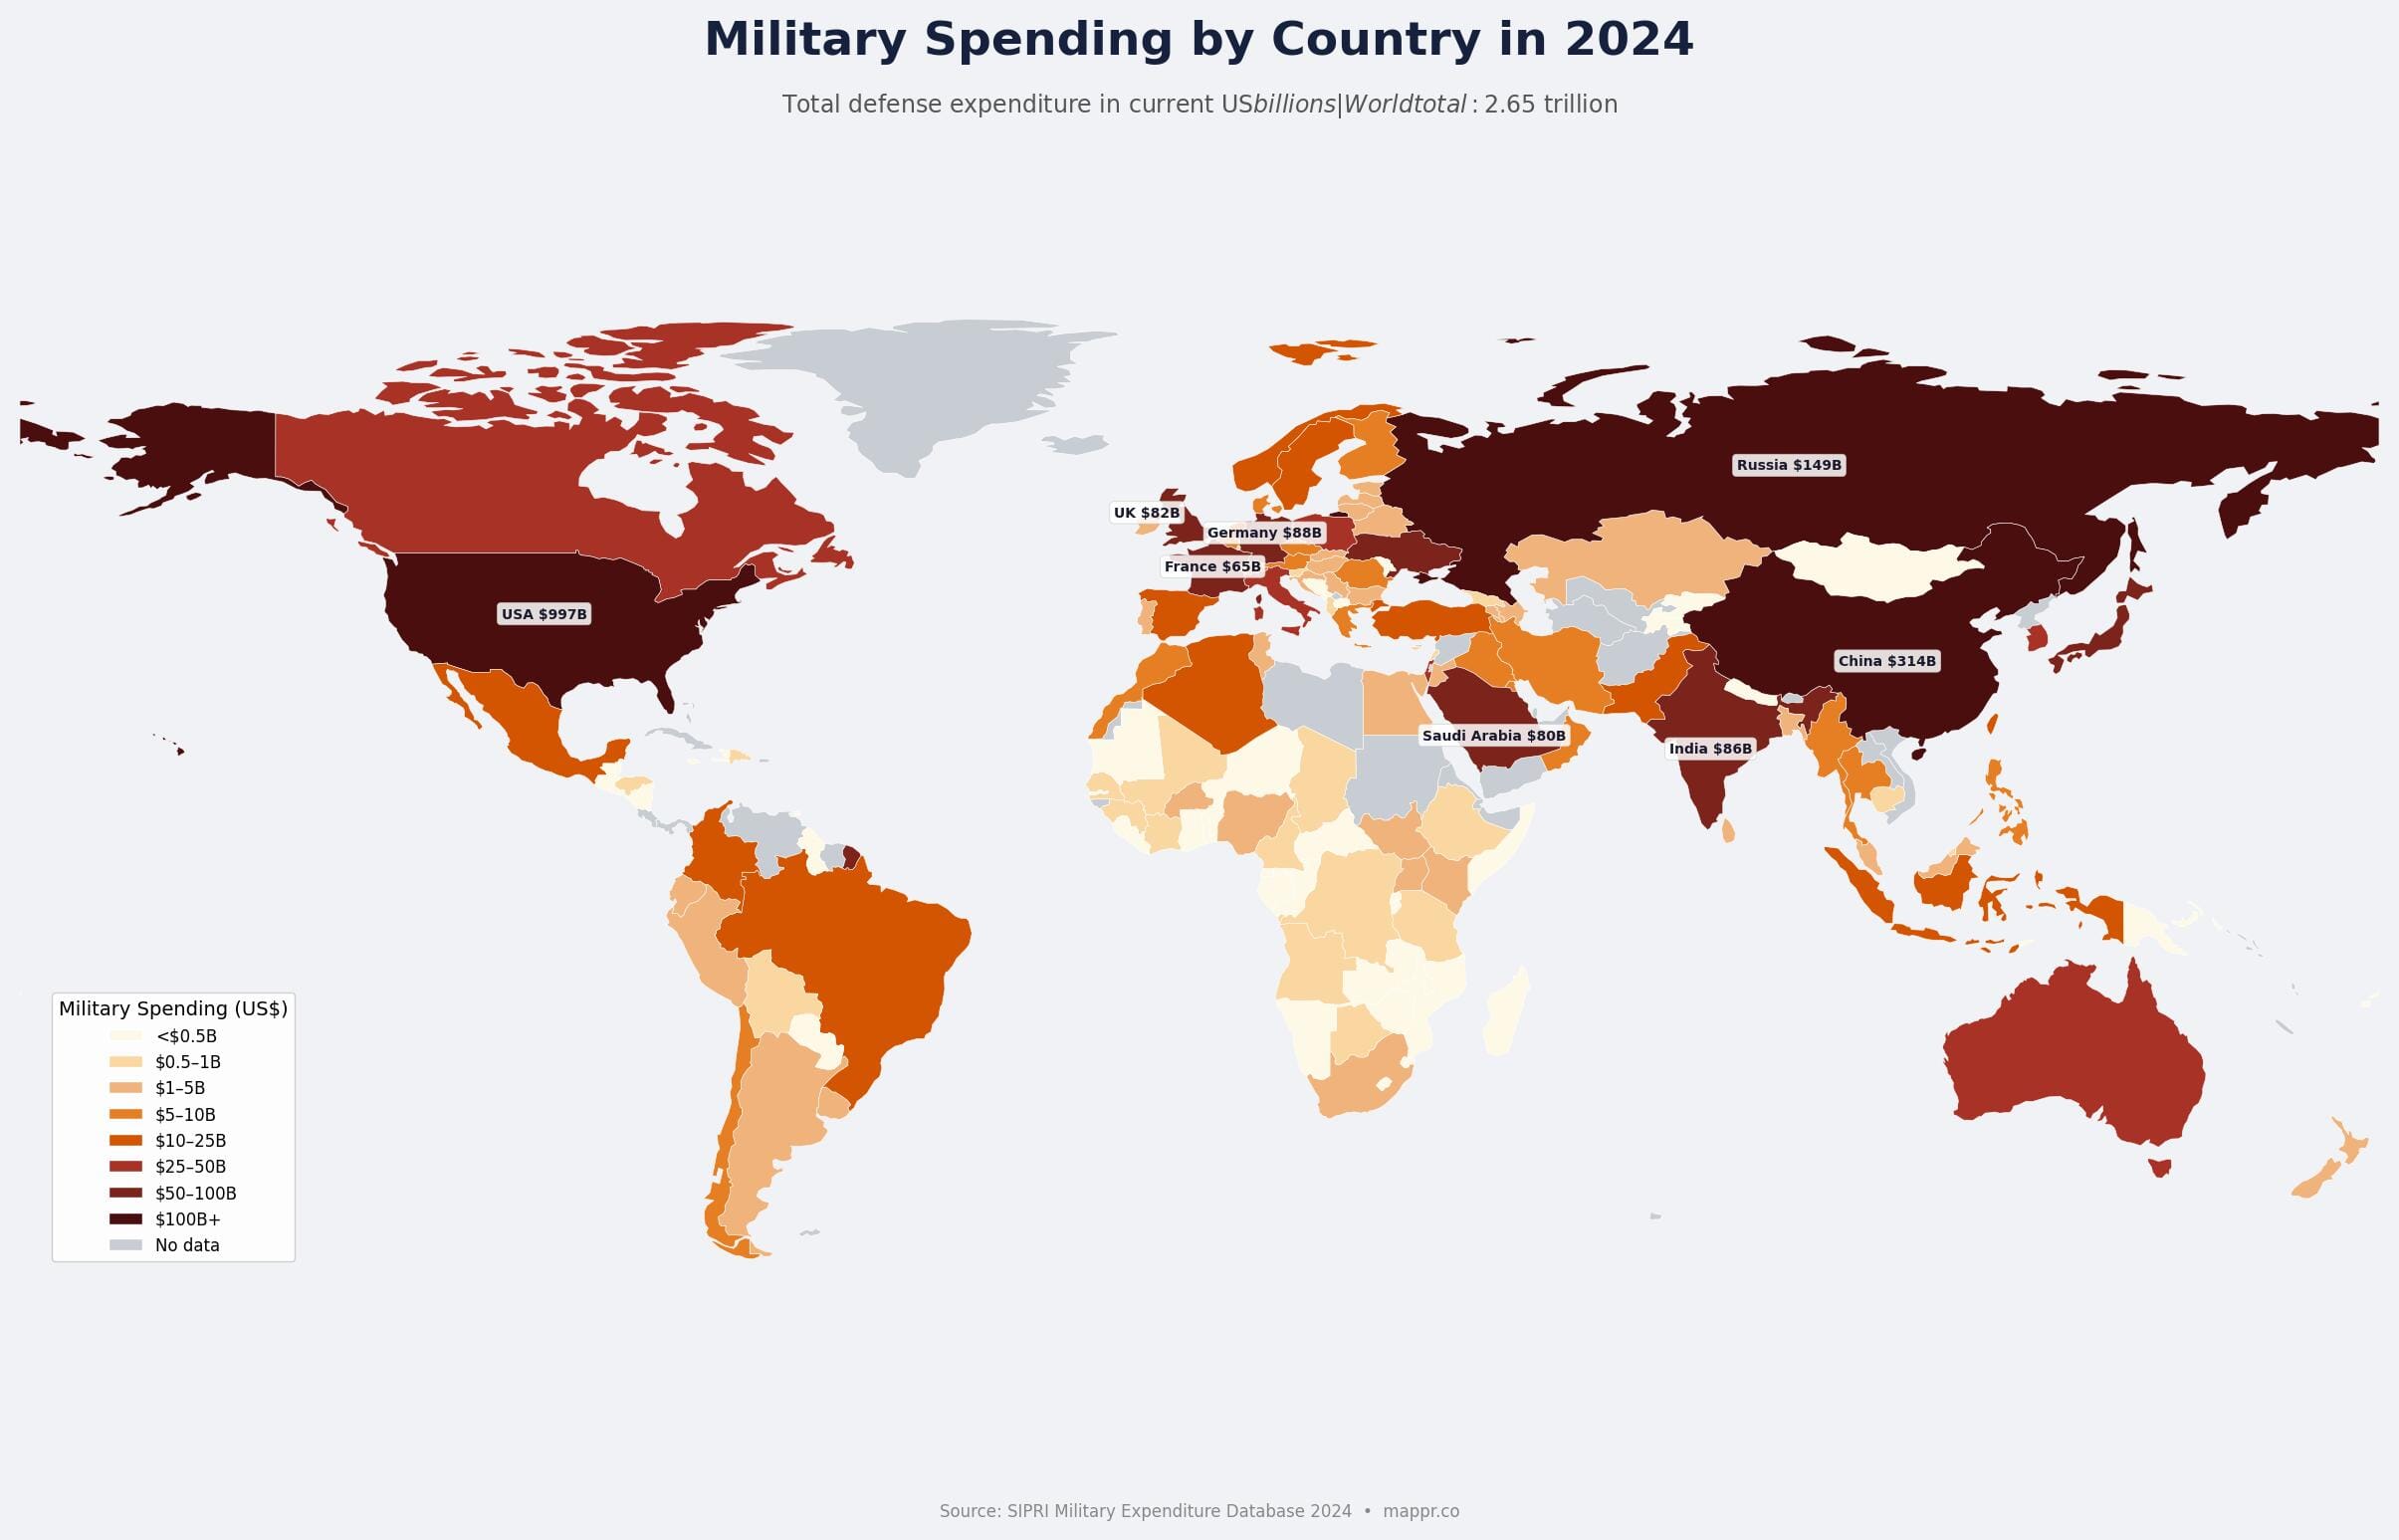
World Military Spending Map (2024)
The map below shows total military expenditure by country in current US dollars for 2024. The dominance of the United States is immediately apparent — it alone accounts for more defense spending than the rest of the top 10 combined. China, at $313.7 billion, is a distant second, followed by Russia ($149 billion), which has more than doubled its military budget since its full-scale invasion of Ukraine in 2022.

Interactive Map: Explore Military Spending by Country
Hover over any country to see its total defense budget, spending as a percentage of GDP, per capita figures, and how much spending has changed since 2020.
Top 15 Military Spenders: The $2.65 Trillion Picture
The concentration of military spending at the top is staggering. The 15 largest defense budgets account for roughly 82% of global military expenditure. The United States alone outspends the next nine countries combined.
Several entries on this list tell stories of geopolitical tension:
- Germany ($88.5B) has climbed to #4 globally — a position unthinkable a decade ago — following its 2022 Zeitenwende (watershed) moment that established a €100 billion special defense fund.
- Ukraine ($64.7B) cracks the top 10 while fighting Europe’s largest conflict since World War II, spending a staggering 34.5% of its GDP on defense.
- Israel ($46.5B) has more than doubled its military budget since 2020, driven by operations in Gaza and escalating regional tensions.
- Poland ($38.0B) now spends more on defense than Italy despite having a GDP less than half its size, reflecting its position as NATO’s eastern flank.
Military Spending Per Capita: A Different Story
Total spending tells one story. Per capita spending tells another entirely. When you divide military budgets by population, smaller wealthy nations and countries facing existential security threats rise to the top.
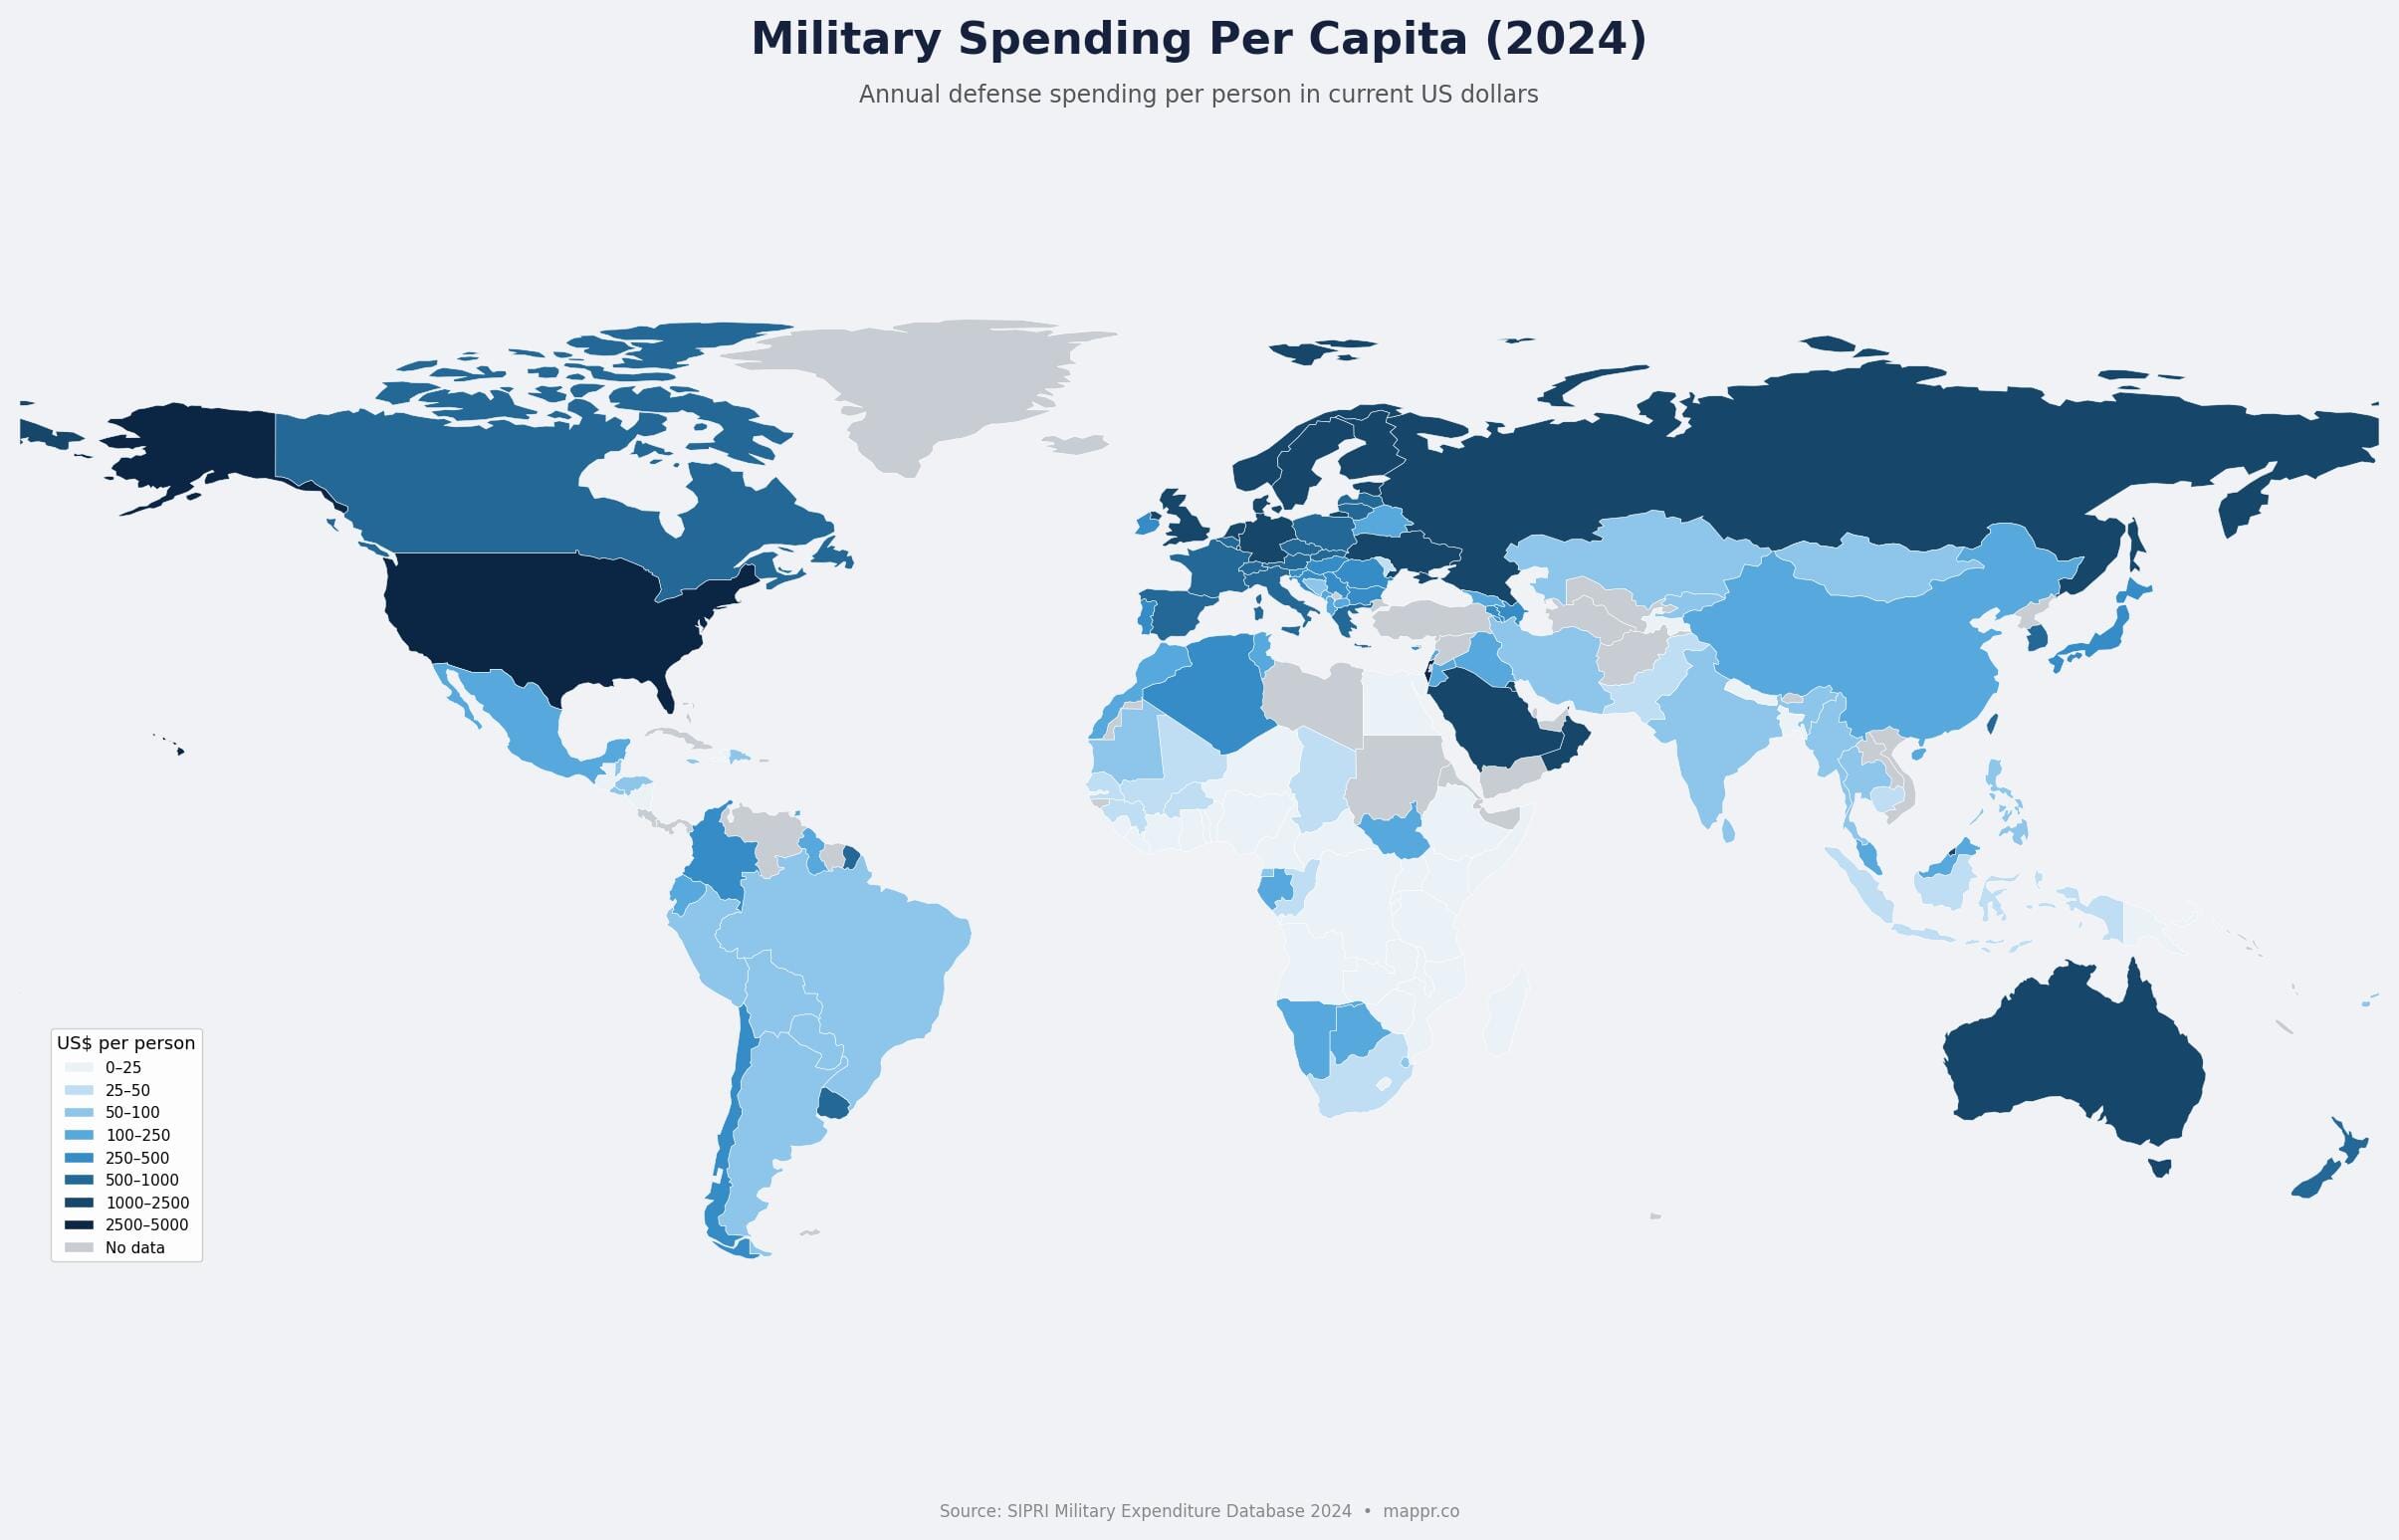
Israel leads the world at $4,989 per person — meaning every Israeli citizen effectively “pays” nearly $5,000 annually toward defense. The United States follows at $2,895 per person, while Singapore ($2,591), Saudi Arabia ($2,386), and Norway ($1,880) round out the top five.
The per capita lens reveals how Gulf states, Nordic nations, and frontline NATO members bear outsized defense burdens relative to their populations. Ukraine’s $1,728 per capita figure is particularly striking given the country’s relatively modest GDP per capita — reflecting the existential nature of its defense spending.
At the other end of the spectrum, populous developing nations like India ($60), Indonesia ($39), Bangladesh ($24), and Nigeria ($12) spend comparatively little per person despite large total budgets.
Military Spending as % of GDP: Who Bears the Heaviest Burden?
The most telling metric for understanding a country’s defense commitment is spending as a share of GDP. This shows how much of a nation’s economic output is dedicated to the military — and reveals the true weight of the defense burden.
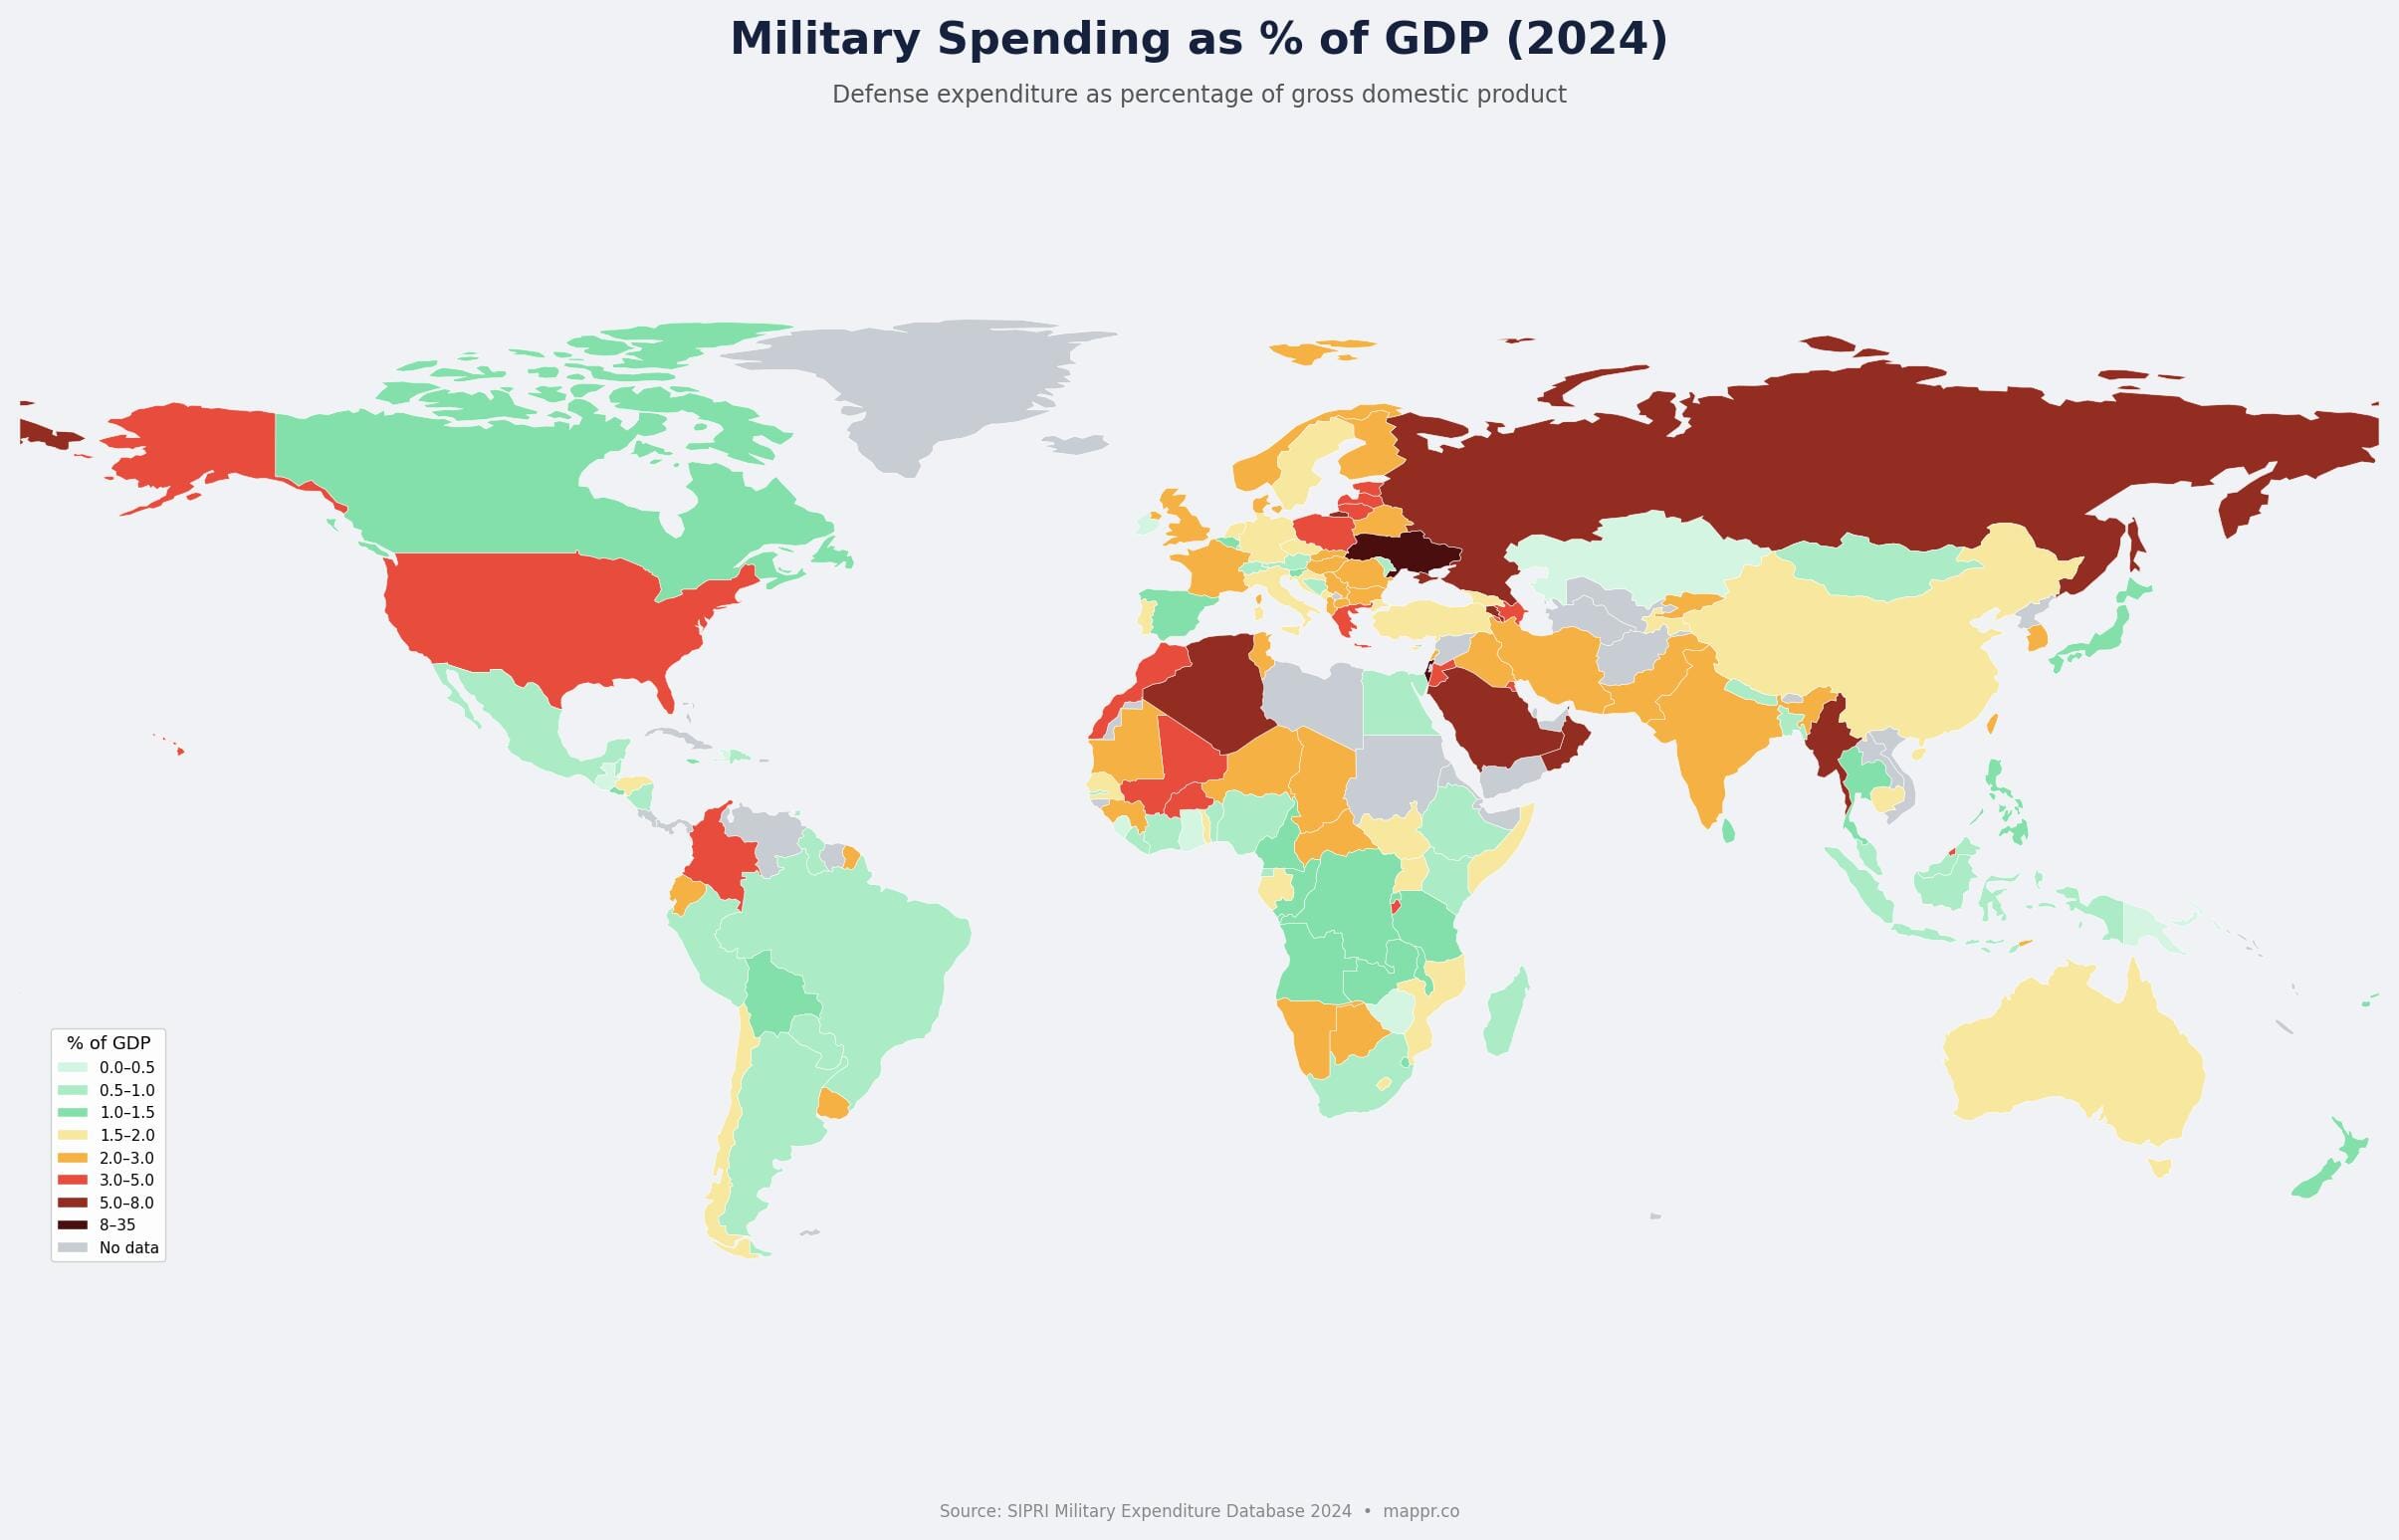
Ukraine leads the world at 34.5% of GDP — effectively one-third of the entire economy directed toward defense. This is an extraordinary wartime figure, surpassing even Cold War-era spending ratios for most nations.
Beyond Ukraine, the highest GDP shares are found among countries facing active conflicts or in volatile regions:
- Israel: 8.8% — Reflecting the Gaza conflict and broader regional security posture
- Algeria: 8.0% — North Africa’s largest military, driven by regional instability and Sahel conflicts
- Saudi Arabia: 7.3% — Maintaining one of the world’s most expensive militaries relative to GDP
- Russia: 7.1% — War economy in full gear, with military spending crowding out civilian priorities
- Myanmar: 6.8% — Military junta prioritizing defense amid ongoing civil war
The much-discussed NATO guideline of 2% of GDP — which was originally framed as a minimum target — is met by a growing but still minority share of alliance members. Poland (4.2%), Greece (3.1%), the United States (3.4%), the Baltic states (2.8–3.3%), and the UK (2.3%) exceed it comfortably, while major European economies like Germany (1.9%), Italy (1.6%), Spain (1.4%), and Canada (1.3%) continue to fall short.
NATO Europe: The 2% Target Map
The debate over NATO burden-sharing has intensified dramatically since Russia’s 2022 invasion of Ukraine. The alliance’s guideline that members spend at least 2% of GDP on defense has gone from an aspirational benchmark to an increasingly urgent expectation.
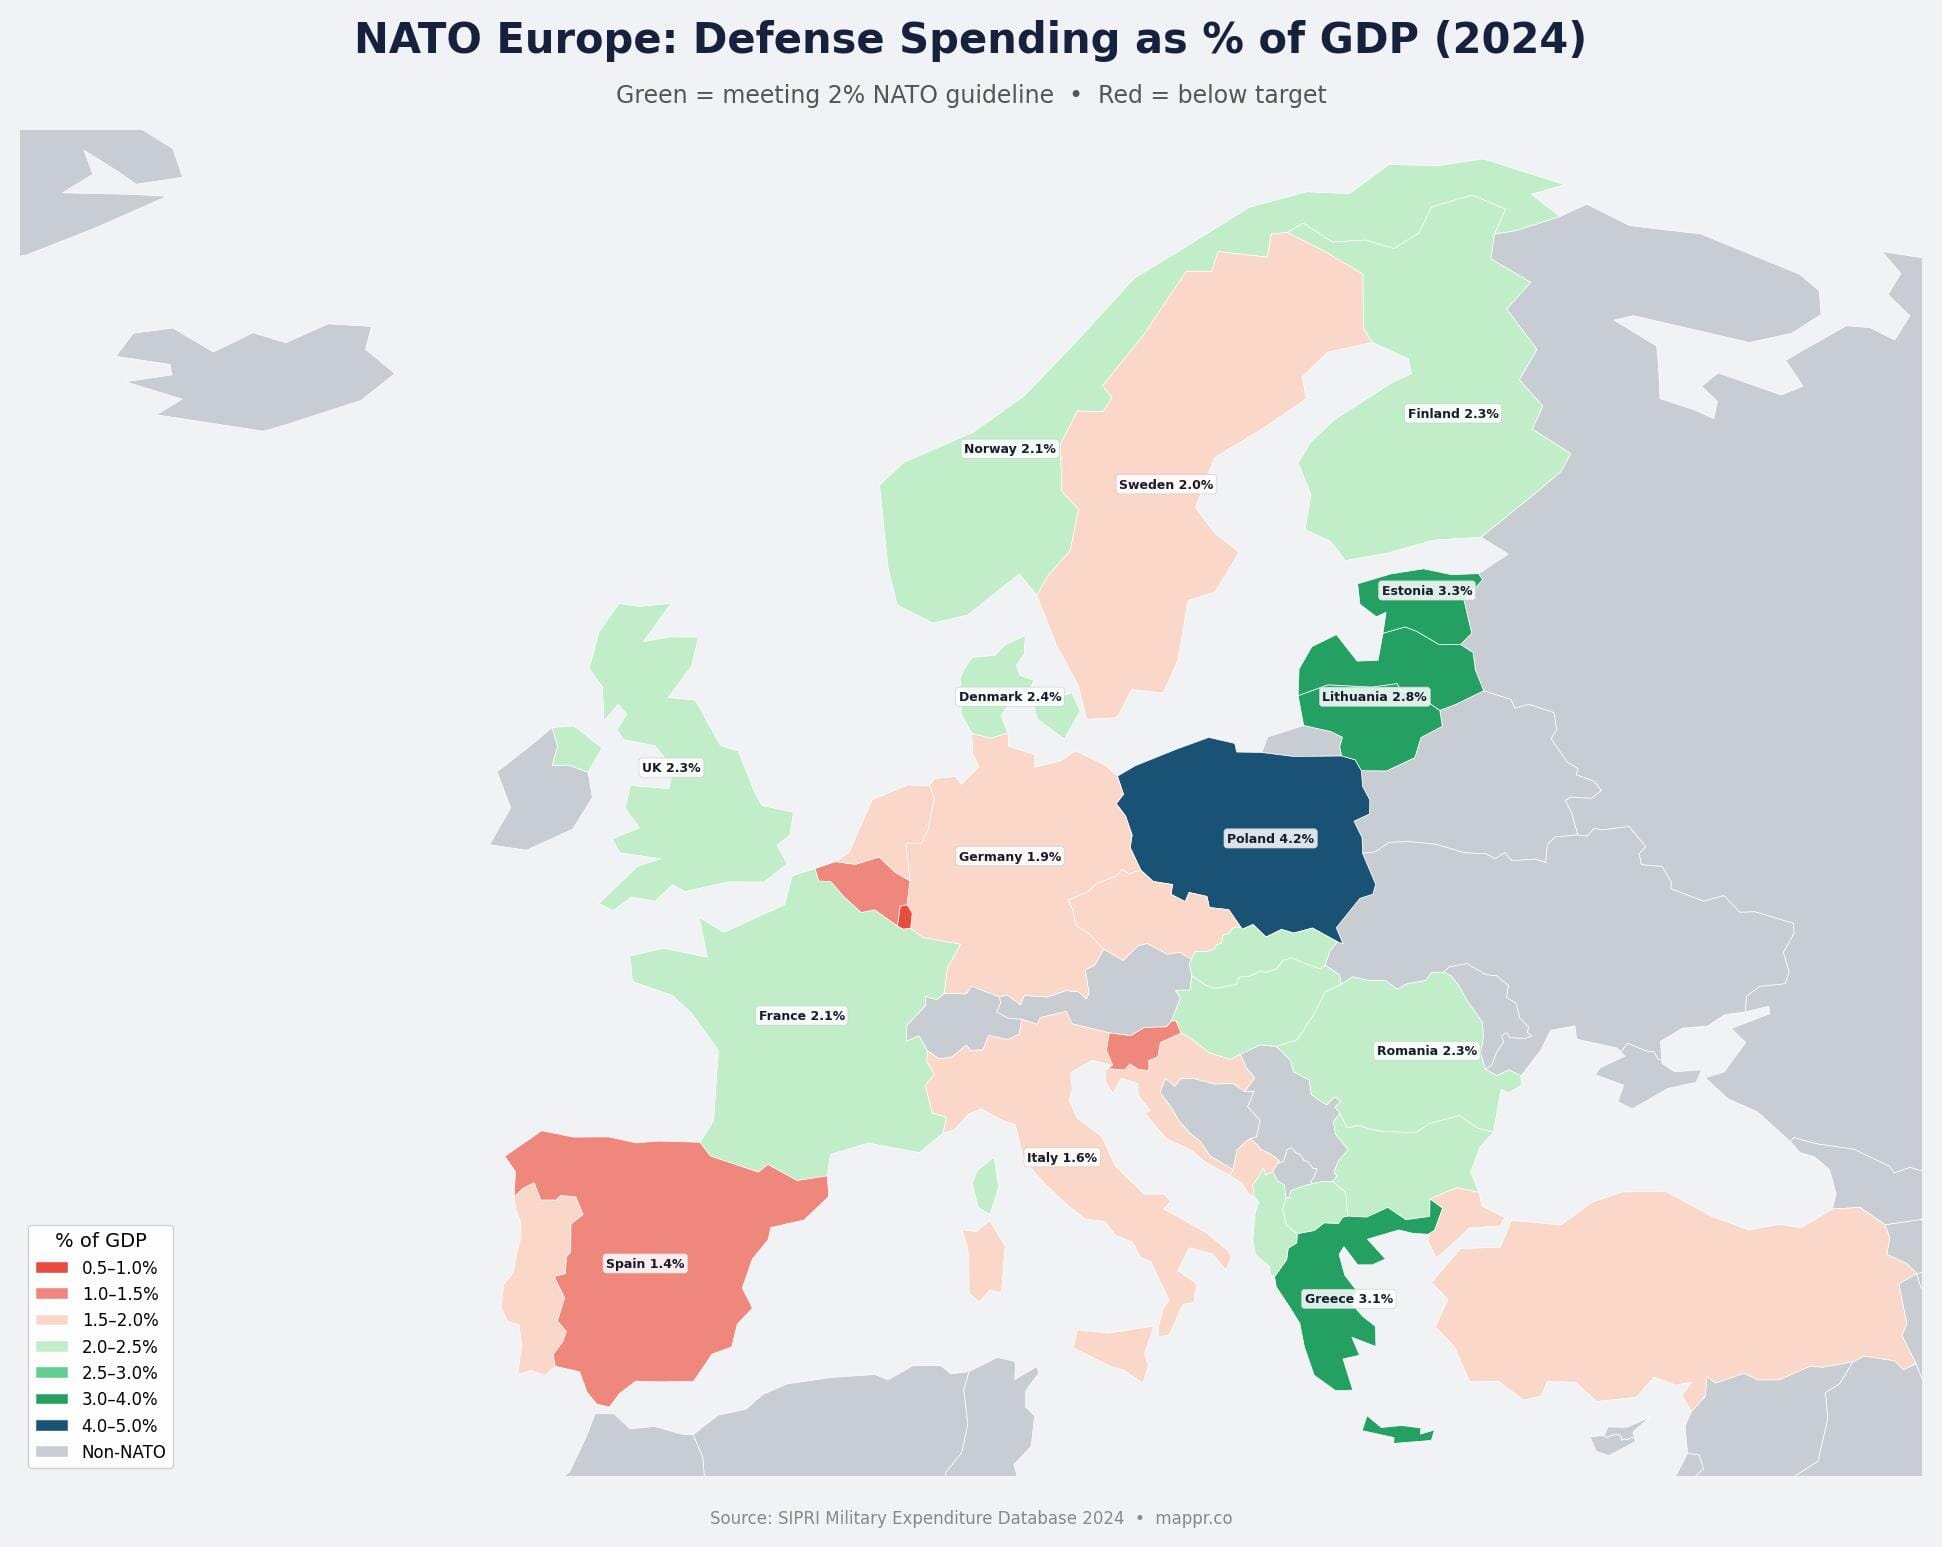
The geographic pattern is stark: NATO’s eastern and northern flanks are spending the most, while legacy Western European members — with the notable exception of the UK and France — are still catching up.
Poland stands out as the alliance’s most committed spender at 4.2% of GDP, having nearly tripled its defense budget since 2020 (+177%). The Baltic states — Estonia (3.3%), Lithuania (2.8%), and Latvia (3.1%) — spend well above the target despite their small economies, reflecting their proximity to Russia and the existential threat they perceive.
The Nordic shift has been particularly dramatic. Finland (2.3%) and Sweden (2.0%) — both of which joined NATO in 2023–2024 after decades of military non-alignment — have rapidly scaled up defense spending. Denmark (2.4%) has also surged, doubling its budget since 2020.
Where Military Spending Has Grown the Most Since 2020
The global surge in military spending becomes most visible when looking at the changes since 2020 — the year before Russia’s invasion of Ukraine reshaped security calculations worldwide.
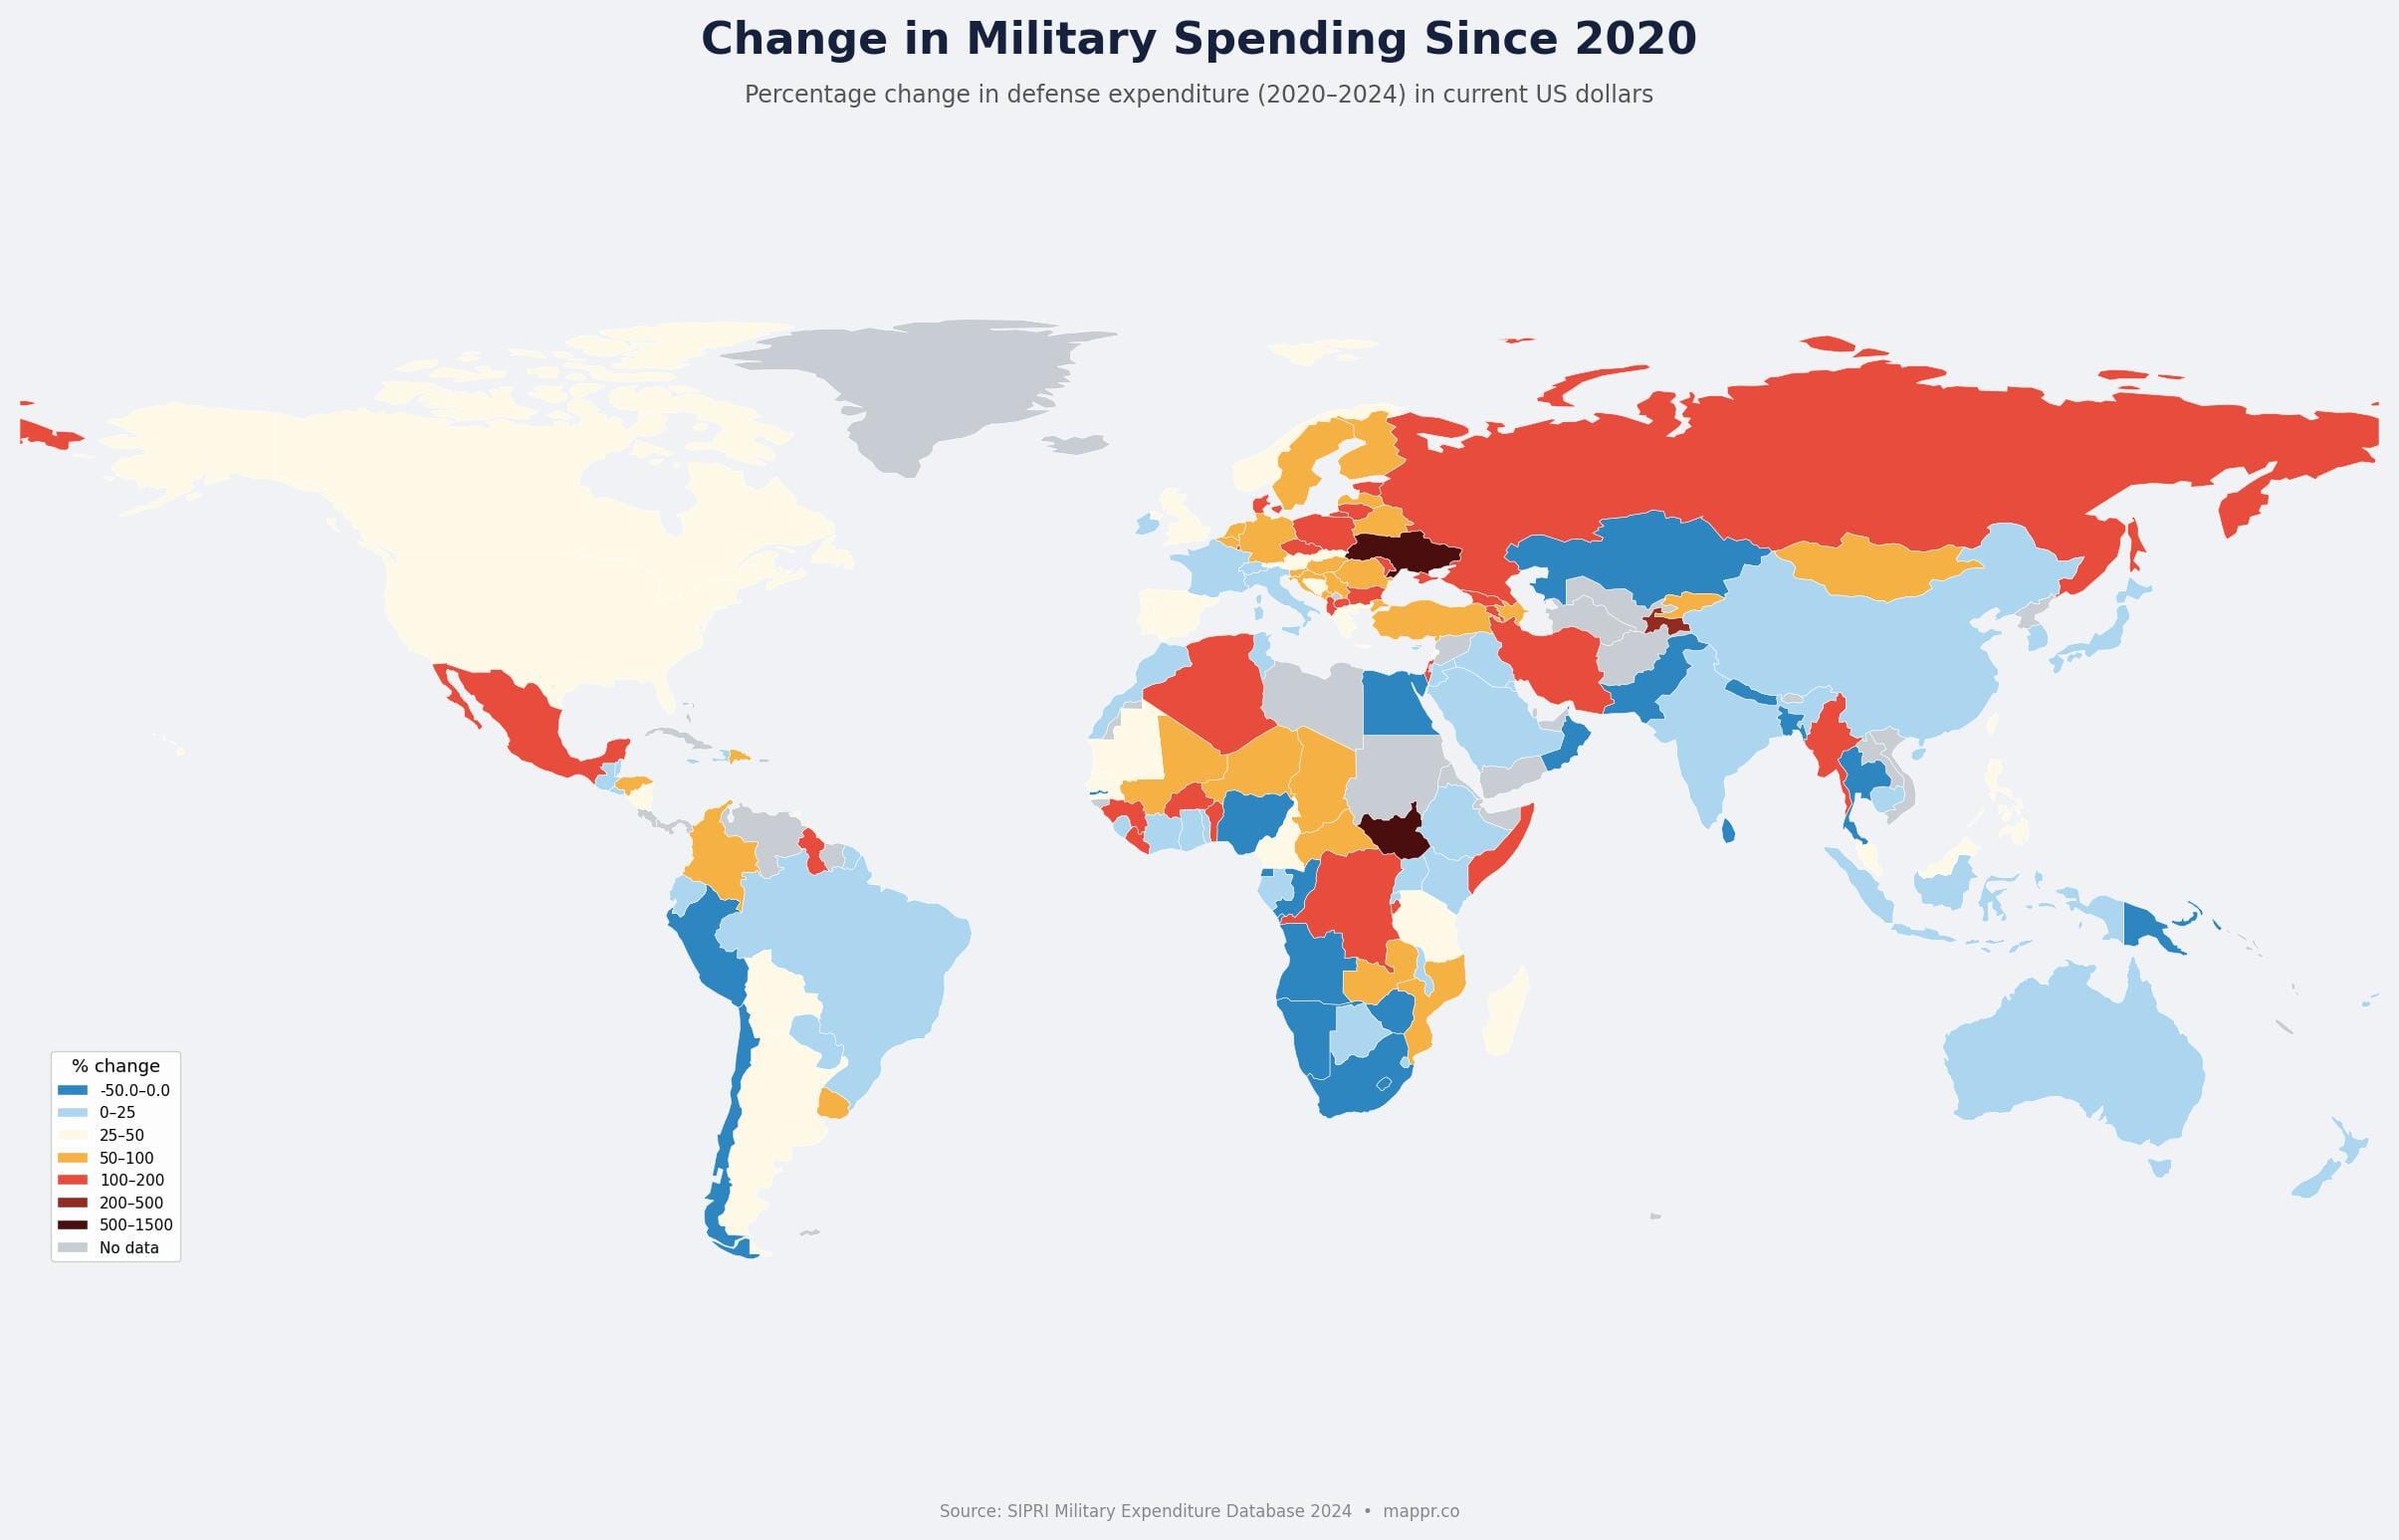
The standout increases tell a clear story of a world rearming in response to conflict and perceived threats. For context on how these conflicts reshape global trade routes, see our analysis of the Strait of Hormuz crisis:
- Ukraine: +846% — From $6.8B to $64.7B. A wartime economy mobilized for national survival.
- Poland: +177% — The largest percentage increase among established NATO members, from $13.7B to $38.0B.
- Russia: +141% — From $61.7B to $149.0B. The Kremlin’s war machine in overdrive.
- Algeria: +125% — Doubling its budget amid Sahel instability and regional competition with Morocco.
- Israel: +113% — From $21.8B to $46.5B, driven by the Gaza conflict beginning in late 2023.
- Denmark: +104%, Czechia: +101%, Sweden: +92% — European NATO members racing to catch up.
In contrast, only a handful of countries have reduced military spending since 2020: Pakistan (−0.7%), South Africa (−32%), Ethiopia (−24%), and Ghana (−39%) are among them — though these cuts often reflect economic constraints rather than improved security environments.
Regional Analysis: Who’s Spending and Why
Americas: The US Outspends Everyone
The Americas are dominated by the United States, whose $997.3 billion defense budget dwarfs all others in the region — and indeed the world. At 3.4% of GDP, the US maintains its position as the planet’s premier military power, with spending that funds 11 aircraft carrier groups, approximately 750 military bases in at least 80 countries, and a nuclear arsenal of roughly 5,500 warheads.
Canada ($29.3B, 1.3% of GDP) continues to face pressure from Washington to meet the NATO 2% target. Brazil ($20.9B) and Mexico ($16.7B) are the region’s other significant spenders, though Mexico’s dramatic 108% increase since 2020 largely reflects the militarization of public security and counter-narcotics operations rather than traditional defense buildups. Colombia ($15.1B, 3.4% of GDP) maintains one of the highest defense burdens in the hemisphere, driven by ongoing internal security operations and border concerns.
Europe: The Great Rearmament
Europe is undergoing its most significant military buildup since the Cold War. Russia’s invasion of Ukraine in February 2022 shattered the post-1991 peace dividend and forced a fundamental reassessment of European security (see also: safest countries in the world).
The numbers are striking. Germany’s Zeitenwende has translated into real budget increases, pushing spending to $88.5 billion — a 66% increase since 2020. The UK ($81.8B) and France ($64.7B) remain the continent’s other heavy hitters, though both face pressure to spend more. Italy ($38.0B), while still below NATO’s 2% target at 1.6% of GDP, has nonetheless increased spending by 15% since 2020.
But the real transformation is happening on NATO’s eastern and northern flanks. Poland is spending 4.2% of GDP on defense — more than double the NATO guideline — and has signed massive weapons procurement deals with the US and South Korea. The country is building what it calls “the strongest land army in Europe.” The Baltic states, Finland, Sweden, Romania, and the Czech Republic have all boosted defense spending by 80–115% since 2020.
Russia’s own defense spending ($149.0B, 7.1% of GDP) has reached levels that are increasingly unsustainable for its economy. With military expenditure consuming an estimated 40% of total federal spending, the Kremlin is prioritizing guns over butter in ways that will have long-term economic consequences.
Asia-Pacific: The Quiet Buildup
While Europe’s rearmament dominates headlines, Asia-Pacific’s military buildup is arguably more consequential for long-term global security. Our richest countries in Asia ranking shows how economic power fuels this buildup. China’s $313.7 billion defense budget — which many analysts believe understates true military spending by 30–40% — funds the world’s largest navy by hull count and an increasingly capable nuclear arsenal.
The response from China’s neighbors is palpable. Japan ($55.3B) has abandoned decades of pacifist-leaning defense policy, with Prime Minister Kishida’s government pledging to double defense spending to 2% of GDP by 2027. South Korea ($47.6B) maintains a formidable military posture against North Korea. Taiwan ($16.5B) has increased spending by 37% since 2020, driven by growing concern about a potential Chinese invasion. Australia ($33.8B) is investing heavily in nuclear-powered submarines through the AUKUS pact.
India ($86.1B, 2.3% of GDP) — the world’s fifth-largest military spender — is balancing modernization needs against border tensions with both China and Pakistan. Despite its large absolute spending, India’s per capita figure of just $60 highlights the challenge of defending the world’s most populous country on a developing nation’s budget.
Southeast Asian nations including Singapore ($15.1B), Indonesia ($11.0B), and the Philippines ($6.1B) are also expanding military capabilities, driven by South China Sea disputes and broader regional uncertainty.
Middle East: Permanent Militarization
The Middle East remains the most militarized region in the world relative to economic output. Saudi Arabia ($80.3B, 7.3% of GDP) is the world’s seventh-largest military spender, while Israel ($46.5B, 8.8% of GDP) has the highest GDP share of any developed economy.
Israel’s 113% spending increase since 2020 reflects the massive cost of operations in Gaza beginning in October 2023 and the broader multi-front security challenge posed by Hezbollah, Iranian proxies, and Iran itself. The country’s $4,989 per capita spending — the world’s highest — underscores the security-first orientation of Israeli governance.
Gulf states continue to maintain large defense establishments despite limited active threats. Kuwait ($7.8B, 4.8% of GDP), Oman ($5.8B, 5.6% of GDP), and Qatar ($5.2B, 2.3% of GDP) all spend at levels that far exceed global averages. Algeria ($21.8B, 8.0% of GDP) — North Africa’s military heavyweight — has surged spending by 125% since 2020, driven by Sahel instability, a strategic rivalry with Morocco, and border security concerns related to Libya.
Historical Context: How We Got Here
Global military spending in 2024 is not just high — it represents a fundamental shift from the post-Cold War trajectory of gradual demilitarization.
After the Cold War ended in 1991, the world experienced a “peace dividend” as nations — particularly the US and European states — reduced defense spending. Global military expenditure hit a post-Cold War low around 1998 before beginning to climb again after 9/11 and the subsequent wars in Afghanistan and Iraq.
A second dip occurred around 2011–2014 as austerity measures hit defense budgets and the US began winding down its Middle Eastern engagements. But since 2015, spending has risen every single year, driven by three reinforcing trends:
- Russia’s aggression in Ukraine (Crimea in 2014, full invasion in 2022) — triggering European rearmament at a scale not seen in decades
- China’s military modernization — driving defensive responses across the Indo-Pacific, particularly from Japan, Australia, Taiwan, and South Korea
- Middle East instability — the Gaza conflict, Houthi Red Sea attacks, Iran’s nuclear program, and Sahel insecurity sustaining high spending across the region
Over the past decade (2014–2024), the countries with the most dramatic spending increases include Ukraine (+1,128%), Poland (+289%), Algeria (+194%), Hungary (+187%), and the Baltic states (+150–200%). These figures represent a tectonic shift in global security priorities.
Complete Data: Military Spending by Country (Top 40)
The table below ranks the world’s 40 largest military spenders in 2024, including total expenditure, defense burden as a share of GDP, per capita spending, and how budgets have changed since 2020.
| # | Country | Spending (2024) | % of GDP | Per Capita | Change Since 2020 |
|---|---|---|---|---|---|
| 1 | 🇺🇸 United States | $997.3B | 3.4% | $2,895 | +28.1% |
| 2 | 🇨🇳 China | $313.7B | 1.7% | $221 | +21.6% |
| 3 | 🇷🇺 Russia | $149.0B | 7.1% | $1,026 | +141.4% |
| 4 | 🇩🇪 Germany | $88.5B | 1.9% | $1,044 | +65.9% |
| 5 | 🇮🇳 India | $86.1B | 2.3% | $60 | +18.1% |
| 6 | 🇬🇧 United Kingdom | $81.8B | 2.3% | $1,186 | +40.2% |
| 7 | 🇸🇦 Saudi Arabia | $80.3B | 7.3% | $2,386 | +24.4% |
| 8 | 🇺🇦 Ukraine | $64.7B | 34.5% | $1,728 | +846.2% |
| 9 | 🇫🇷 France | $64.7B | 2.1% | $973 | +21.1% |
| 10 | 🇯🇵 Japan | $55.3B | 1.4% | $446 | +7.5% |
| 11 | 🇰🇷 South Korea | $47.6B | 2.6% | $919 | +3.2% |
| 12 | 🇮🇱 Israel | $46.5B | 8.8% | $4,989 | +113.2% |
| 13 | 🇵🇱 Poland | $38.0B | 4.2% | $982 | +177.0% |
| 14 | 🇮🇹 Italy | $38.0B | 1.6% | $639 | +15.3% |
| 15 | 🇦🇺 Australia | $33.8B | 1.9% | $1,272 | +23.9% |
| 16 | 🇨🇦 Canada | $29.3B | 1.3% | $742 | +27.1% |
| 17 | 🇹🇷 Türkiye | $25.0B | 1.9% | — | +58.3% |
| 18 | 🇪🇸 Spain | $24.6B | 1.4% | $514 | +41.2% |
| 19 | 🇳🇱 Netherlands | $23.2B | 1.9% | $1,276 | +77.1% |
| 20 | 🇩🇿 Algeria | $21.8B | 8.0% | $469 | +124.7% |
| 21 | 🇧🇷 Brazil | $20.9B | 1.0% | $99 | +6.9% |
| 22 | 🇲🇽 Mexico | $16.7B | 0.9% | $128 | +107.9% |
| 23 | 🇹🇼 Taiwan | $16.5B | 2.1% | $708 | +37.0% |
| 24 | 🇨🇴 Colombia | $15.1B | 3.4% | $287 | +58.0% |
| 25 | 🇸🇬 Singapore | $15.1B | 2.8% | $2,591 | +53.7% |
| 26 | 🇸🇪 Sweden | $12.0B | 2.0% | $1,138 | +92.0% |
| 27 | 🇮🇩 Indonesia | $11.0B | 0.8% | $39 | +17.6% |
| 28 | 🇳🇴 Norway | $10.4B | 2.1% | $1,880 | +44.4% |
| 29 | 🇵🇰 Pakistan | $10.2B | 2.7% | $41 | -0.7% |
| 30 | 🇩🇰 Denmark | $10.0B | 2.4% | $1,670 | +103.8% |
| 31 | 🇷🇴 Romania | $8.7B | 2.3% | $457 | +72.5% |
| 32 | 🇧🇪 Belgium | $8.6B | 1.3% | $730 | +61.0% |
| 33 | 🇬🇷 Greece | $8.0B | 3.1% | $791 | +38.9% |
| 34 | 🇮🇷 Iran | $7.9B | 2.0% | $87 | +135.6% |
| 35 | 🇰🇼 Kuwait | $7.8B | 4.8% | $1,596 | +12.3% |
| 36 | 🇫🇮 Finland | $7.0B | 2.3% | $1,245 | +80.6% |
| 37 | 🇨🇭 Switzerland | $6.7B | 0.7% | $755 | +17.3% |
| 38 | 🇨🇿 Czechia | $6.5B | 1.9% | $605 | +100.6% |
| 39 | 🇮🇶 Iraq | $6.2B | 2.4% | $136 | +9.4% |
| 40 | 🇵🇭 Philippines | $6.1B | 1.3% | $53 | +30.4% |
Why Is the World Spending More on Defense?
The global surge in military spending is driven by multiple reinforcing factors that show no signs of abating:
1. The Ukraine War Effect
Russia’s full-scale invasion of Ukraine in February 2022 fundamentally changed European security calculations. For the first time since the Cold War, a major European nation was engaged in a full-scale conventional war. The response has been a pan-European rearmament effort, with NATO allies committing to sustained defense spending increases. The effect extends beyond direct military aid to Ukraine — it has driven domestic defense industrial expansion, new arms procurement programs, and the recruitment of additional military personnel across the alliance.
2. China’s Military Modernization
China’s People’s Liberation Army (PLA) has undergone the most rapid military modernization in history. Beijing has built the world’s largest navy by hull count, developed advanced hypersonic weapons, expanded its nuclear arsenal, and invested heavily in artificial intelligence and space warfare capabilities. This has prompted defensive responses across the Indo-Pacific, with Japan, Australia, South Korea, Taiwan, and the Philippines all increasing spending in response.
3. The NATO 2% Target
Originally agreed at the 2014 Wales Summit, the NATO guideline that members spend at least 2% of GDP on defense has gained new urgency. US political pressure — particularly prominent during both Trump administrations — has pushed European allies to accelerate spending increases. By 2024, 23 of 32 NATO allies were expected to meet or exceed the 2% target, up from just 3 in 2014. Some voices within the alliance now argue that 2% should be considered a floor, not a ceiling, with 2.5% or even 3% as the new benchmark.
4. Middle East Conflicts
The Israel-Hamas war that began in October 2023, coupled with Houthi attacks on Red Sea shipping, Iranian nuclear tensions, and Sahel instability, has sustained elevated defense spending across the Middle East and North Africa. Israel’s budget more than doubled, while Gulf states and North African nations have maintained already-high spending levels.
5. Defense Industrial Revitalization
After decades of post-Cold War drawdowns, defense industries are being rebuilt. The US, EU, and individual European nations have launched major initiatives to expand ammunition production, build new weapons systems, and secure supply chains for critical defense technologies. These investments require sustained increases in defense budgets beyond what direct military operations demand.
Frequently Asked Questions
Which country spends the most on military in 2024?
The United States is by far the world’s largest military spender at $997.3 billion in 2024, accounting for approximately 38% of global defense expenditure. This is nearly three times the amount spent by China ($313.7B), the second-largest spender. The US military budget funds approximately 1.3 million active-duty personnel, the world’s most advanced weapons systems, and a global network of military installations.
How much does NATO spend on defense?
NATO’s 32 member states collectively spent over $1.47 trillion on defense in 2024, accounting for more than 55% of global military expenditure. However, the burden is unevenly distributed — the United States alone accounts for roughly 68% of total NATO spending. The alliance’s 2% of GDP guideline is now met by a majority of members, though significant gaps remain, particularly among Western European nations.
Does China spend more on military than reported?
Many defense analysts believe China’s actual military spending significantly exceeds its official budget. SIPRI estimates China’s 2024 military expenditure at $313.7 billion, but other assessments — accounting for costs hidden in civilian budgets, paramilitary forces, and military-related R&D — suggest the true figure could be 30–40% higher, potentially reaching $400–450 billion. However, even at reported levels, China is the world’s second-largest military spender by a wide margin.
Why is Ukraine’s military spending so high as a share of GDP?
Ukraine’s defense spending reached 34.5% of GDP in 2024 — the highest ratio of any country in the world — because it is fighting a full-scale war against Russia. This extraordinary figure reflects the total mobilization of the Ukrainian economy for national defense. It’s worth noting that a significant portion of Ukraine’s military expenditure is funded by international aid, particularly from the United States, European Union, and individual European nations. Without this external support, the spending burden on Ukraine’s domestic economy would be even more unsustainable.
What is the NATO 2% target?
The NATO 2% target is a guideline, agreed at the 2014 Wales Summit, that each NATO member should spend at least 2% of its GDP on defense. It is not a legally binding requirement but has become an increasingly important political benchmark, particularly under US pressure. By 2024, about 23 of NATO’s 32 members were meeting or exceeding this target, up from just 3 in 2014. Poland (4.2%), Greece (3.1%), the US (3.4%), and the Baltic states (2.8–3.3%) are among those that significantly exceed it.
Methodology
All data in this analysis comes from the SIPRI Military Expenditure Database, accessed in March 2026. SIPRI (Stockholm International Peace Research Institute) is the internationally recognized standard for military expenditure data, used by governments, international organizations, and researchers worldwide.
Key notes on the data:
- Currency: All dollar figures are in current US dollars at 2024 prices and exchange rates unless otherwise noted.
- Coverage: Data is available for 149 countries for 2024. Some countries (notably North Korea, Eritrea, and several small nations) do not report military spending data.
- Estimates: SIPRI provides estimates for some countries where official data is incomplete or unreliable. These are noted in the original database.
- Scope: SIPRI’s definition of military expenditure includes all current and capital expenditure on armed forces, defense ministries, paramilitary forces (when judged to be trained and equipped for military operations), and military space activities.
- Percentage changes: Change since 2020 figures are calculated in current US dollars, which means they include the effects of inflation and exchange rate fluctuations.
- Maps and visualizations: Generated by mappr.co using SIPRI data. Static maps created with Natural Earth Data boundaries. Interactive map powered by MapTiler.


This analysis draws on multiple authoritative databases and research publications on global military spending.
Primary Data Sources:
- SIPRI Military Expenditure Database – Stockholm International Peace Research Institute (data covers 1949-2024)
- SIPRI Military Expenditure Database – DOI: 10.55163/CQGC9685
Reports and Analysis:
- SIPRI Press Release – World military expenditure reaches all-time high (April 2025)
- NATO Defence Expenditure – Defence Expenditure of NATO Countries
- IISS – The Military Balance 2025 – Annual assessment of global military capabilities and defence economics
Image Sources and Copyright Information
- Military Spending By Country In – World Map: SIPRI / mappr.co