
How Much Is Gas in the US Today?
Compare the average price of a gallon of gasoline across all 50 states and Washington, D.C. with the table below, updated every week from AAA’s daily fuel survey. Prices are shown for regular, mid-grade and premium gasoline plus diesel.
📅 Last updated: October 19, 2026 · Data from: October 19, 2026 · Source: AAA Gas Prices. Updated every week.
| State | Regular | Mid-Grade | Premium | Diesel |
|---|---|---|---|---|
| California | $6.17 | $6.40 | $6.60 | $8.49 |
| Hawaii | $5.63 | $5.86 | $6.12 | $7.20 |
| Nevada | $5.39 | $5.68 | $5.99 | $6.86 |
| Washington | $5.39 | $5.65 | $5.91 | $7.29 |
| Alaska | $4.95 | $5.11 | $5.42 | $6.55 |
| Oregon | $4.94 | $5.19 | $5.48 | $6.75 |
| Idaho | $4.81 | $5.10 | $5.36 | $6.42 |
| Utah | $4.78 | $5.06 | $5.31 | $6.35 |
| Illinois | $4.67 | $5.29 | $5.84 | $6.55 |
| Arizona | $4.61 | $4.96 | $5.29 | $6.37 |
| Michigan | $4.49 | $5.11 | $5.71 | $6.43 |
| Wyoming | $4.48 | $4.74 | $5.07 | $6.34 |
| Pennsylvania | $4.47 | $4.92 | $5.31 | $6.61 |
| Montana | $4.47 | $4.79 | $5.19 | $6.17 |
| New York | $4.42 | $4.95 | $5.35 | $6.50 |
| District of Columbia | $4.40 | $5.05 | $5.46 | $6.47 |
| Vermont | $4.39 | $4.94 | $5.38 | $6.39 |
| Connecticut | $4.36 | $4.99 | $5.39 | $6.44 |
| New Mexico | $4.35 | $4.79 | $5.11 | $6.13 |
| Maine | $4.34 | $4.91 | $5.38 | $6.43 |
| Colorado | $4.33 | $4.73 | $5.07 | $6.62 |
| Nebraska | $4.28 | $4.50 | $5.10 | $6.09 |
| Massachusetts | $4.27 | $4.91 | $5.32 | $6.33 |
| New Hampshire | $4.26 | $4.86 | $5.31 | $6.37 |
| Minnesota | $4.25 | $4.74 | $5.27 | $6.21 |
| New Jersey | $4.24 | $4.81 | $5.12 | $6.39 |
| South Dakota | $4.23 | $4.43 | $5.07 | $6.06 |
| Rhode Island | $4.23 | $4.96 | $5.35 | $6.34 |
| Wisconsin | $4.20 | $4.78 | $5.35 | $6.19 |
| West Virginia | $4.19 | $4.61 | $5.06 | $6.34 |
| North Dakota | $4.14 | $4.56 | $5.10 | $6.07 |
| Iowa | $4.13 | $4.46 | $5.02 | $6.10 |
| Maryland | $4.12 | $4.73 | $5.03 | $6.36 |
| Florida | $4.08 | $4.53 | $4.86 | $6.04 |
| Virginia | $4.06 | $4.54 | $4.93 | $6.29 |
| Delaware | $4.06 | $4.68 | $4.96 | $6.36 |
| Ohio | $4.04 | $4.60 | $5.13 | $6.20 |
| Kansas | $3.98 | $4.31 | $4.69 | $6.07 |
| Oklahoma | $3.94 | $4.37 | $4.67 | $5.93 |
| Kentucky | $3.93 | $4.51 | $4.92 | $6.11 |
| Missouri | $3.93 | $4.29 | $4.65 | $6.01 |
| Arkansas | $3.90 | $4.37 | $4.75 | $5.92 |
| Alabama | $3.90 | $4.36 | $4.75 | $5.92 |
| Mississippi | $3.89 | $4.34 | $4.73 | $5.86 |
| Louisiana | $3.86 | $4.32 | $4.72 | $5.81 |
| Indiana | $3.84 | $4.43 | $4.95 | $6.58 |
| Tennessee | $3.84 | $4.28 | $4.69 | $5.98 |
| South Carolina | $3.82 | $4.25 | $4.65 | $5.81 |
| Texas | $3.78 | $4.27 | $4.65 | $5.77 |
| Georgia | $3.73 | $4.20 | $4.63 | $5.73 |
| North Carolina | $3.61 | $4.07 | $4.47 | $5.61 |
Average retail prices per US gallon, including taxes. The national average for regular gasoline is $4.30/gal. Source: AAA Gas Prices.
State gasoline price averages. Source: AAA Gas Prices.
Gas Prices in the US Map
Static Map: Gas Prices by State
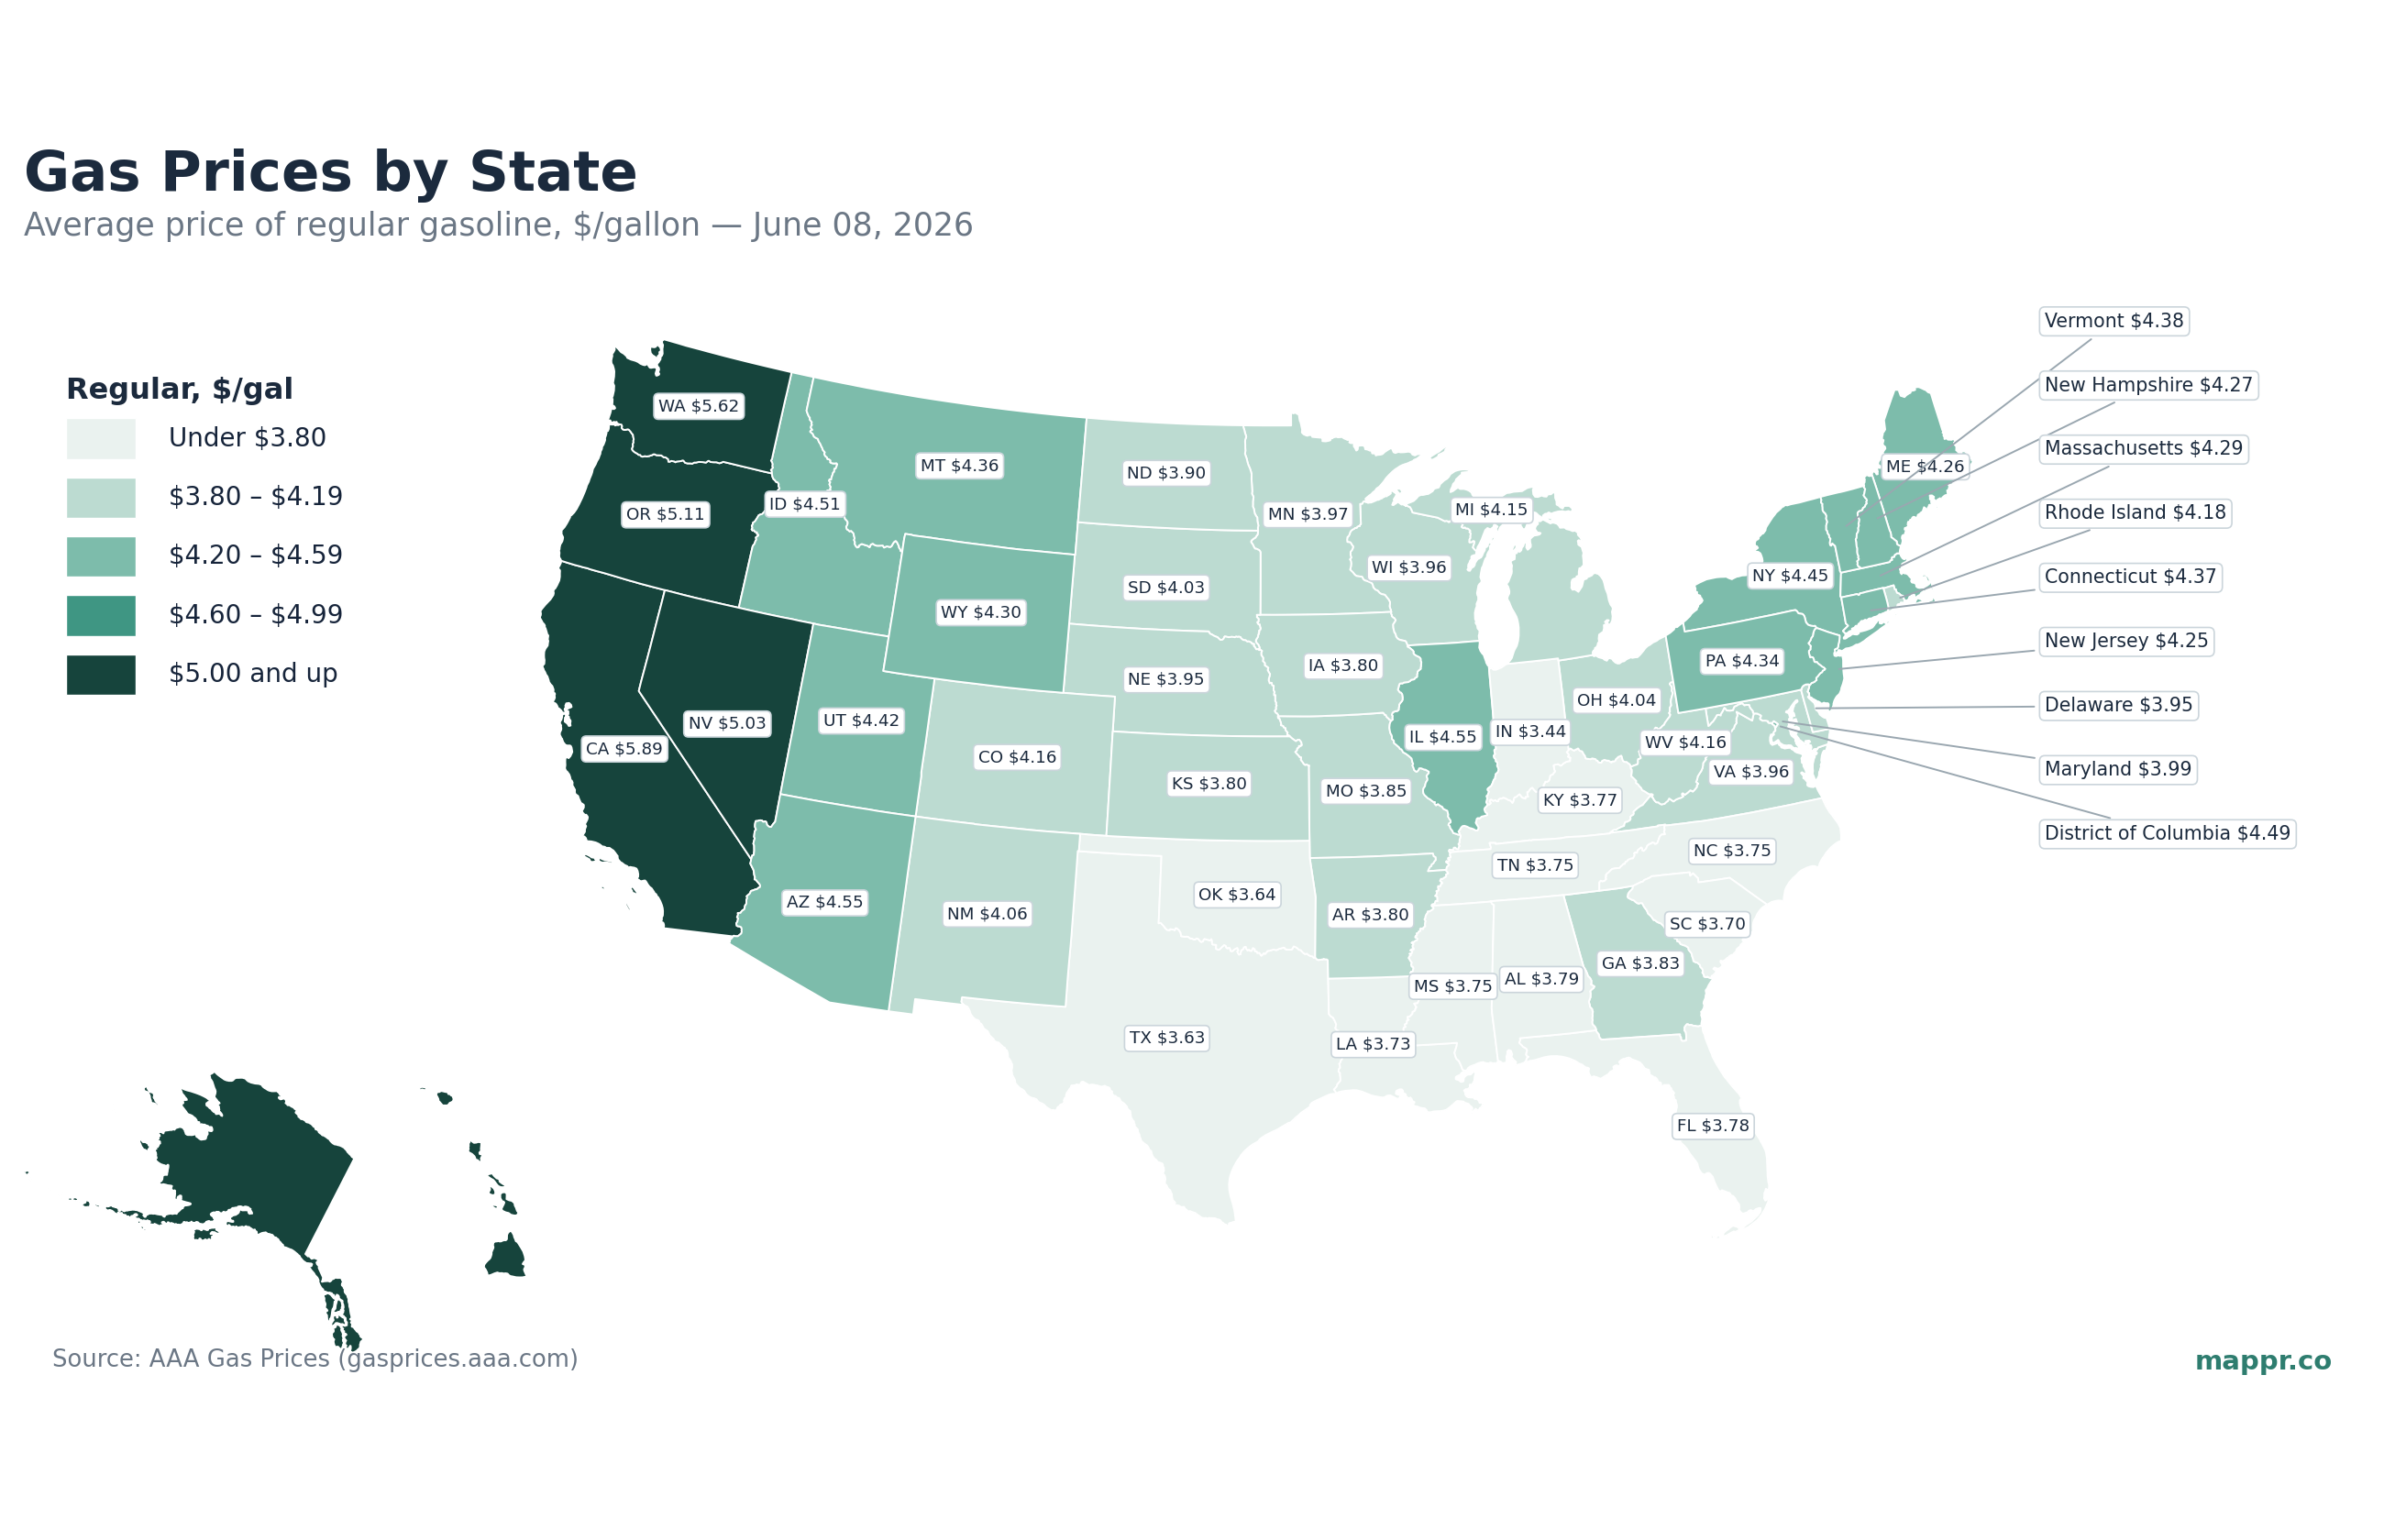
America’s gas-price map is, as ever, a story of the West Coast versus everywhere else. California is the most expensive state in the country at $6.17/gal, while North Carolina is the cheapest at $3.61/gal — a spread of $2.56 a gallon. The national average sits at $4.30/gal.
- West Coast premium: California, Washington, Oregon, Nevada, plus Hawaii and Alaska, carry the highest pump prices, driven by tight refining capacity, special clean-fuel blends and higher state taxes.
- Southern discount: Gulf and South-Central states such as Texas, Mississippi, Louisiana and Oklahoma stay well below the national average, helped by nearby refineries and low fuel taxes.
- The national average is $4.30/gal, and California’s drivers pay roughly 71% more than North Carolina’s.
The 50 states and Washington, D.C. span a wide range at the pump, from under $3.80/gal in the cheapest Southern states to well above $5.00/gal on the West Coast. The breakdown below groups every state by its current regular price.
$5.00 and up — the West Coast peak
- California — $6.17/gal
- Hawaii — $5.63/gal
- Nevada — $5.39/gal
- Washington — $5.39/gal
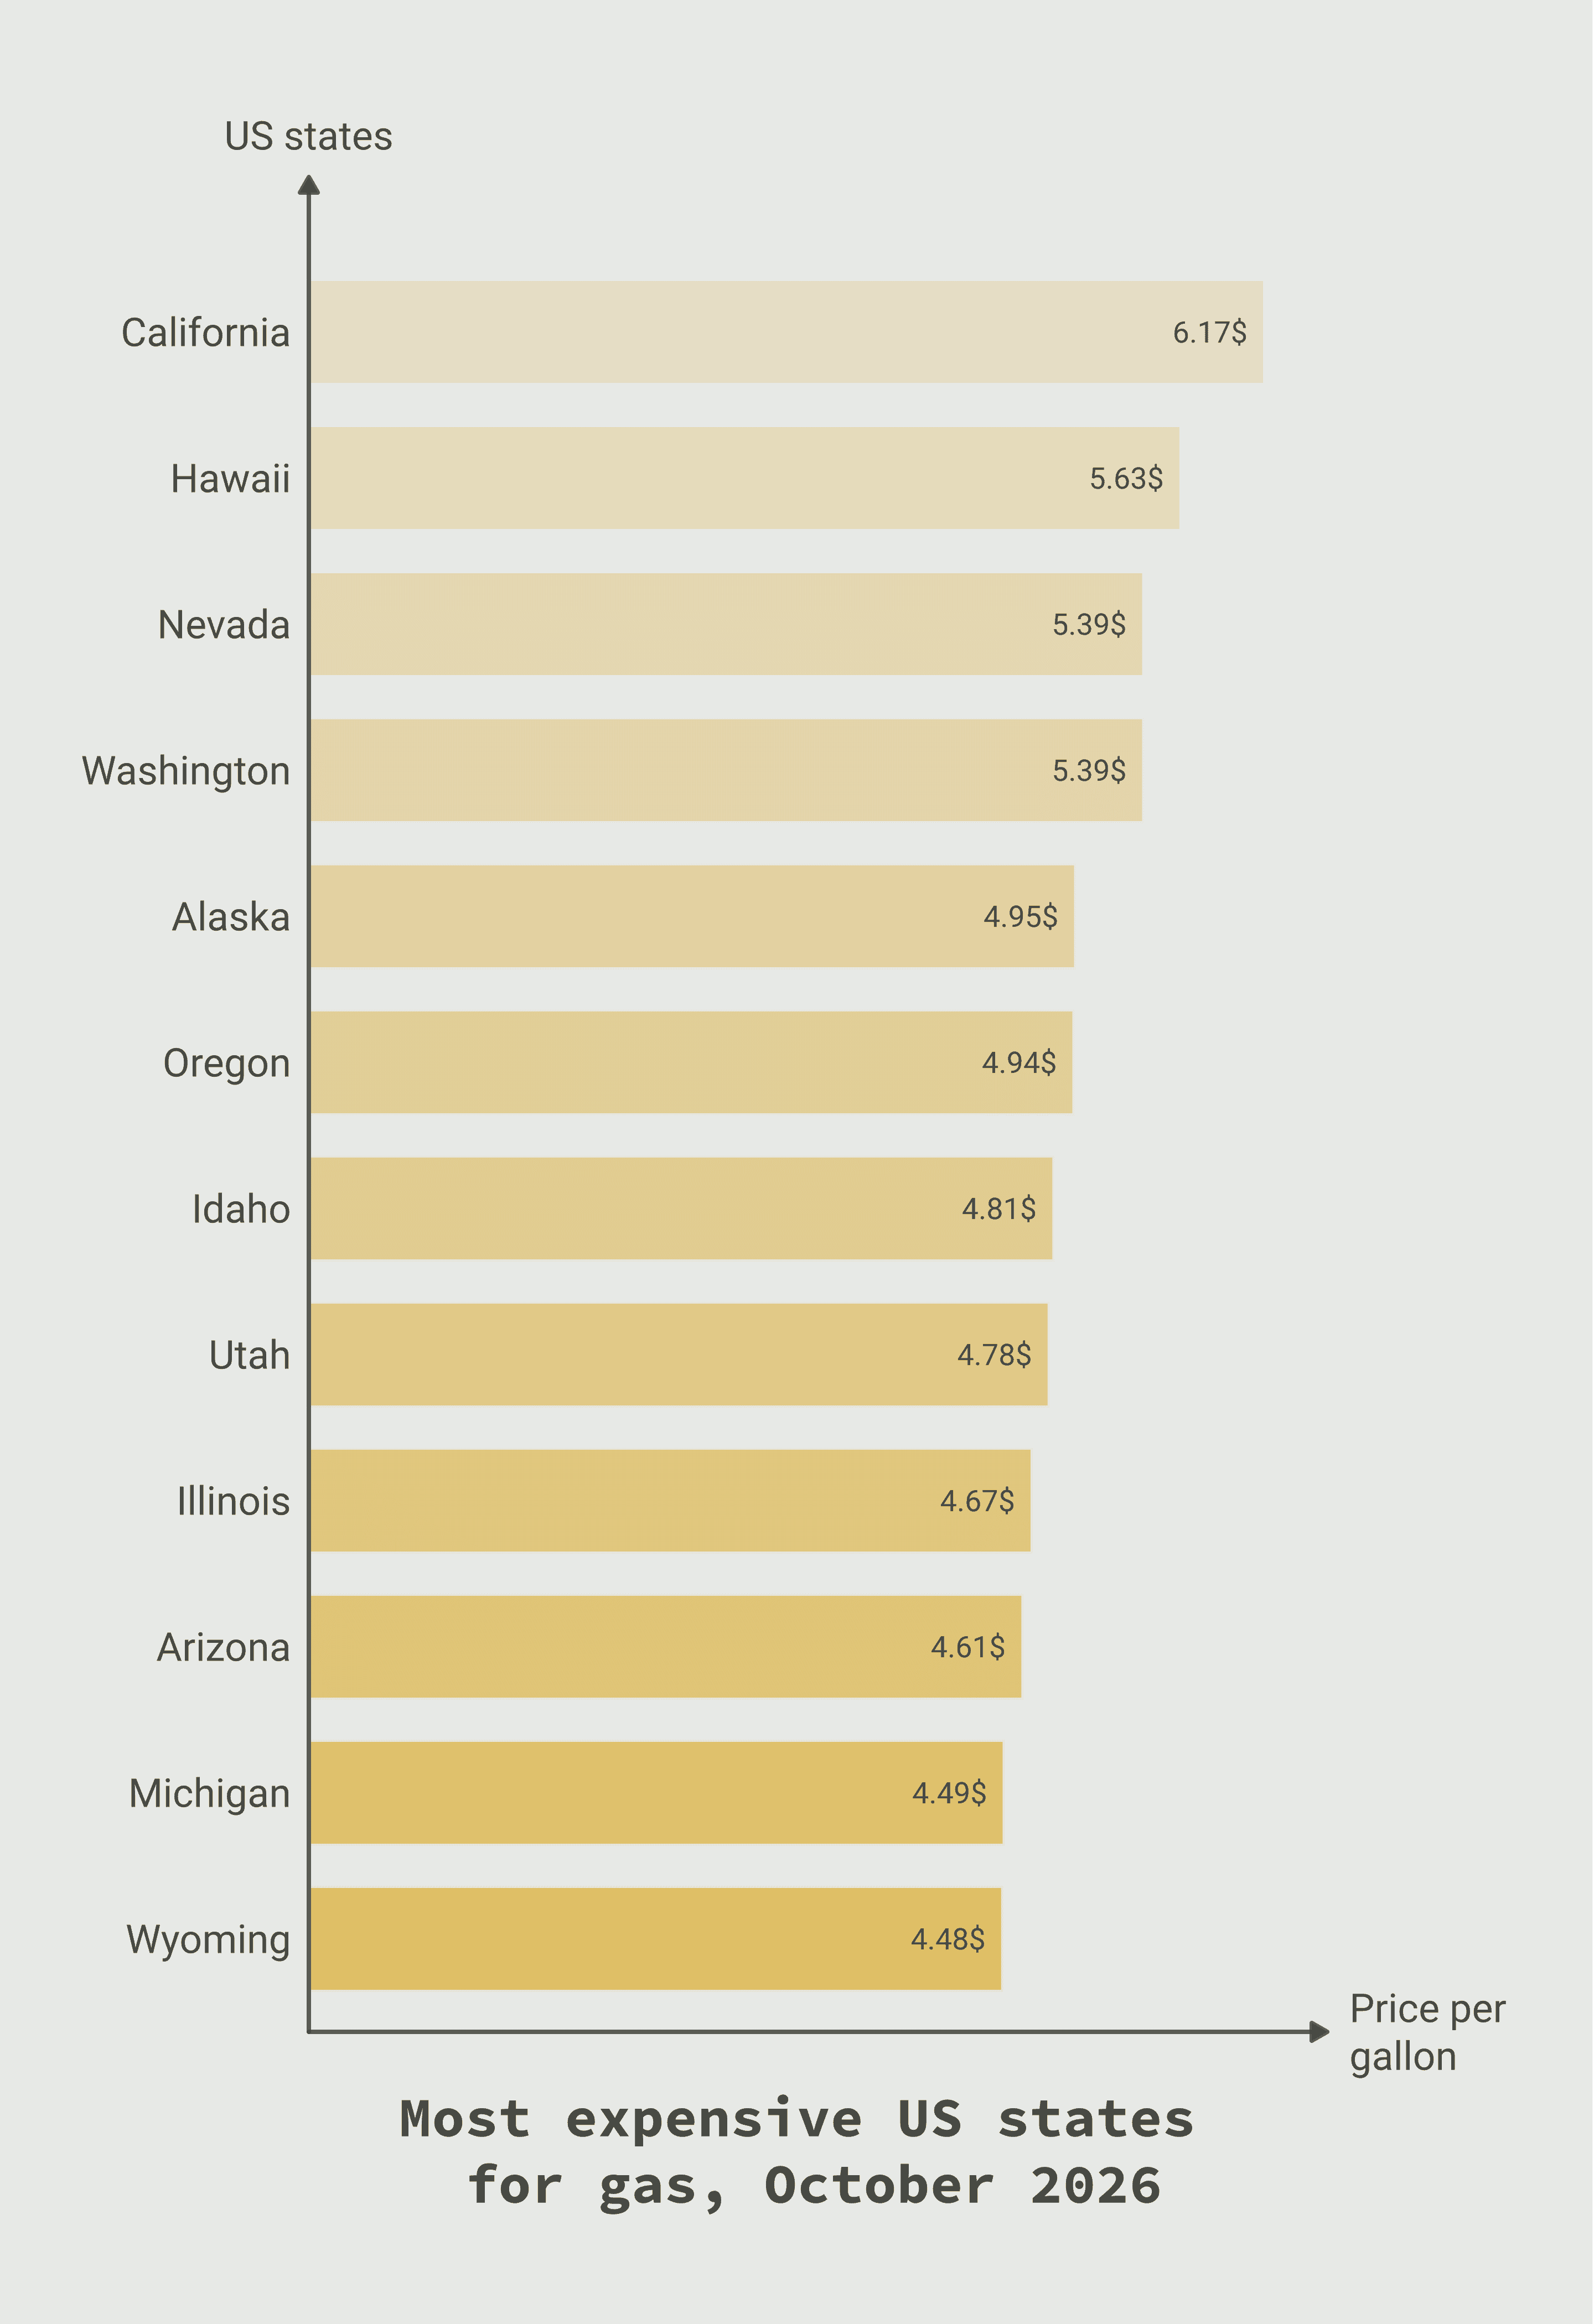
$4.20 – $4.99 — the expensive tier
- Alaska — $4.95/gal
- Oregon — $4.94/gal
- Idaho — $4.81/gal
- Utah — $4.78/gal
- Illinois — $4.67/gal
- Arizona — $4.61/gal
- Michigan — $4.49/gal
- Wyoming — $4.48/gal
- Pennsylvania — $4.47/gal
- Montana — $4.47/gal
- New York — $4.42/gal
- District of Columbia — $4.40/gal
- Vermont — $4.39/gal
- Connecticut — $4.36/gal
- New Mexico — $4.35/gal
- Maine — $4.34/gal
- Colorado — $4.33/gal
- Nebraska — $4.28/gal
- Massachusetts — $4.27/gal
- New Hampshire — $4.26/gal
- Minnesota — $4.25/gal
- New Jersey — $4.24/gal
- South Dakota — $4.23/gal
- Rhode Island — $4.23/gal
$3.80 – $4.19 — the broad middle
- Wisconsin — $4.20/gal
- West Virginia — $4.19/gal
- North Dakota — $4.14/gal
- Iowa — $4.13/gal
- Maryland — $4.12/gal
- Florida — $4.08/gal
- Virginia — $4.06/gal
- Delaware — $4.06/gal
- Ohio — $4.04/gal
- Kansas — $3.98/gal
- Oklahoma — $3.94/gal
- Kentucky — $3.93/gal
- Missouri — $3.93/gal
- Arkansas — $3.90/gal
- Alabama — $3.90/gal
- Mississippi — $3.89/gal
- Louisiana — $3.86/gal
- Indiana — $3.84/gal
- Tennessee — $3.84/gal
- South Carolina — $3.82/gal
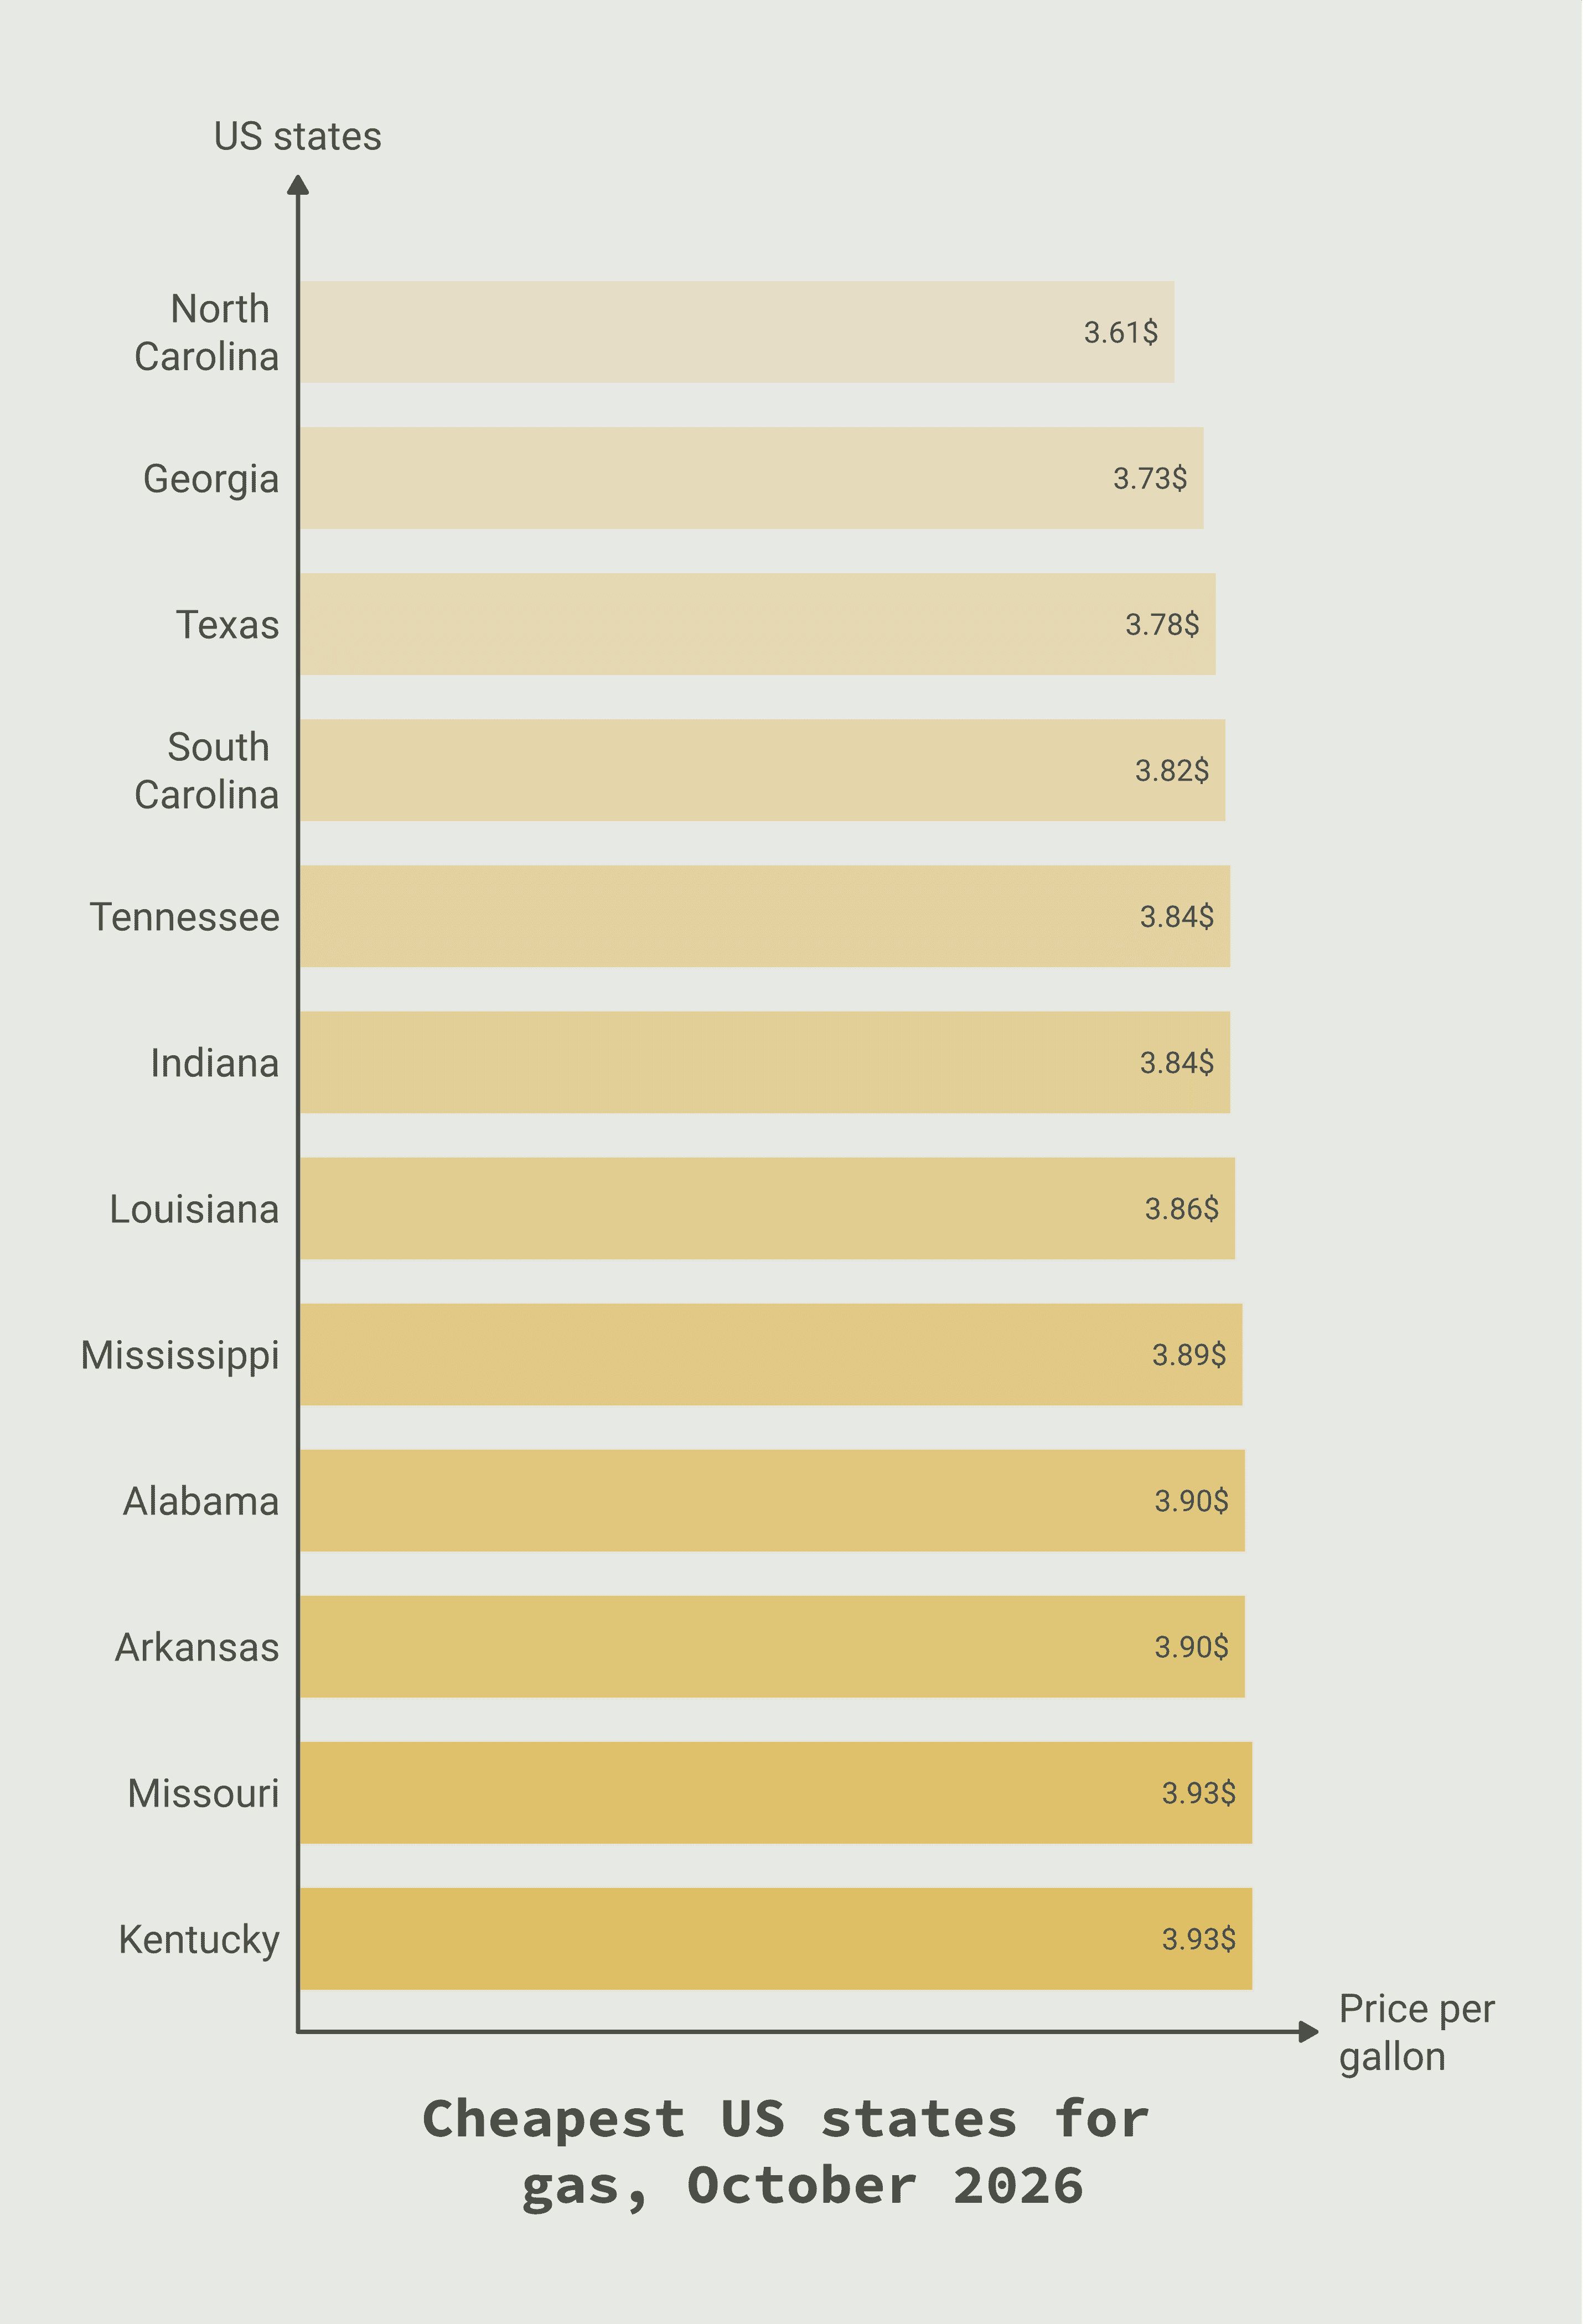
Under $3.80 — the cheapest states
- Texas — $3.78/gal
- Georgia — $3.73/gal
- North Carolina — $3.61/gal
US Gas Prices Over Time
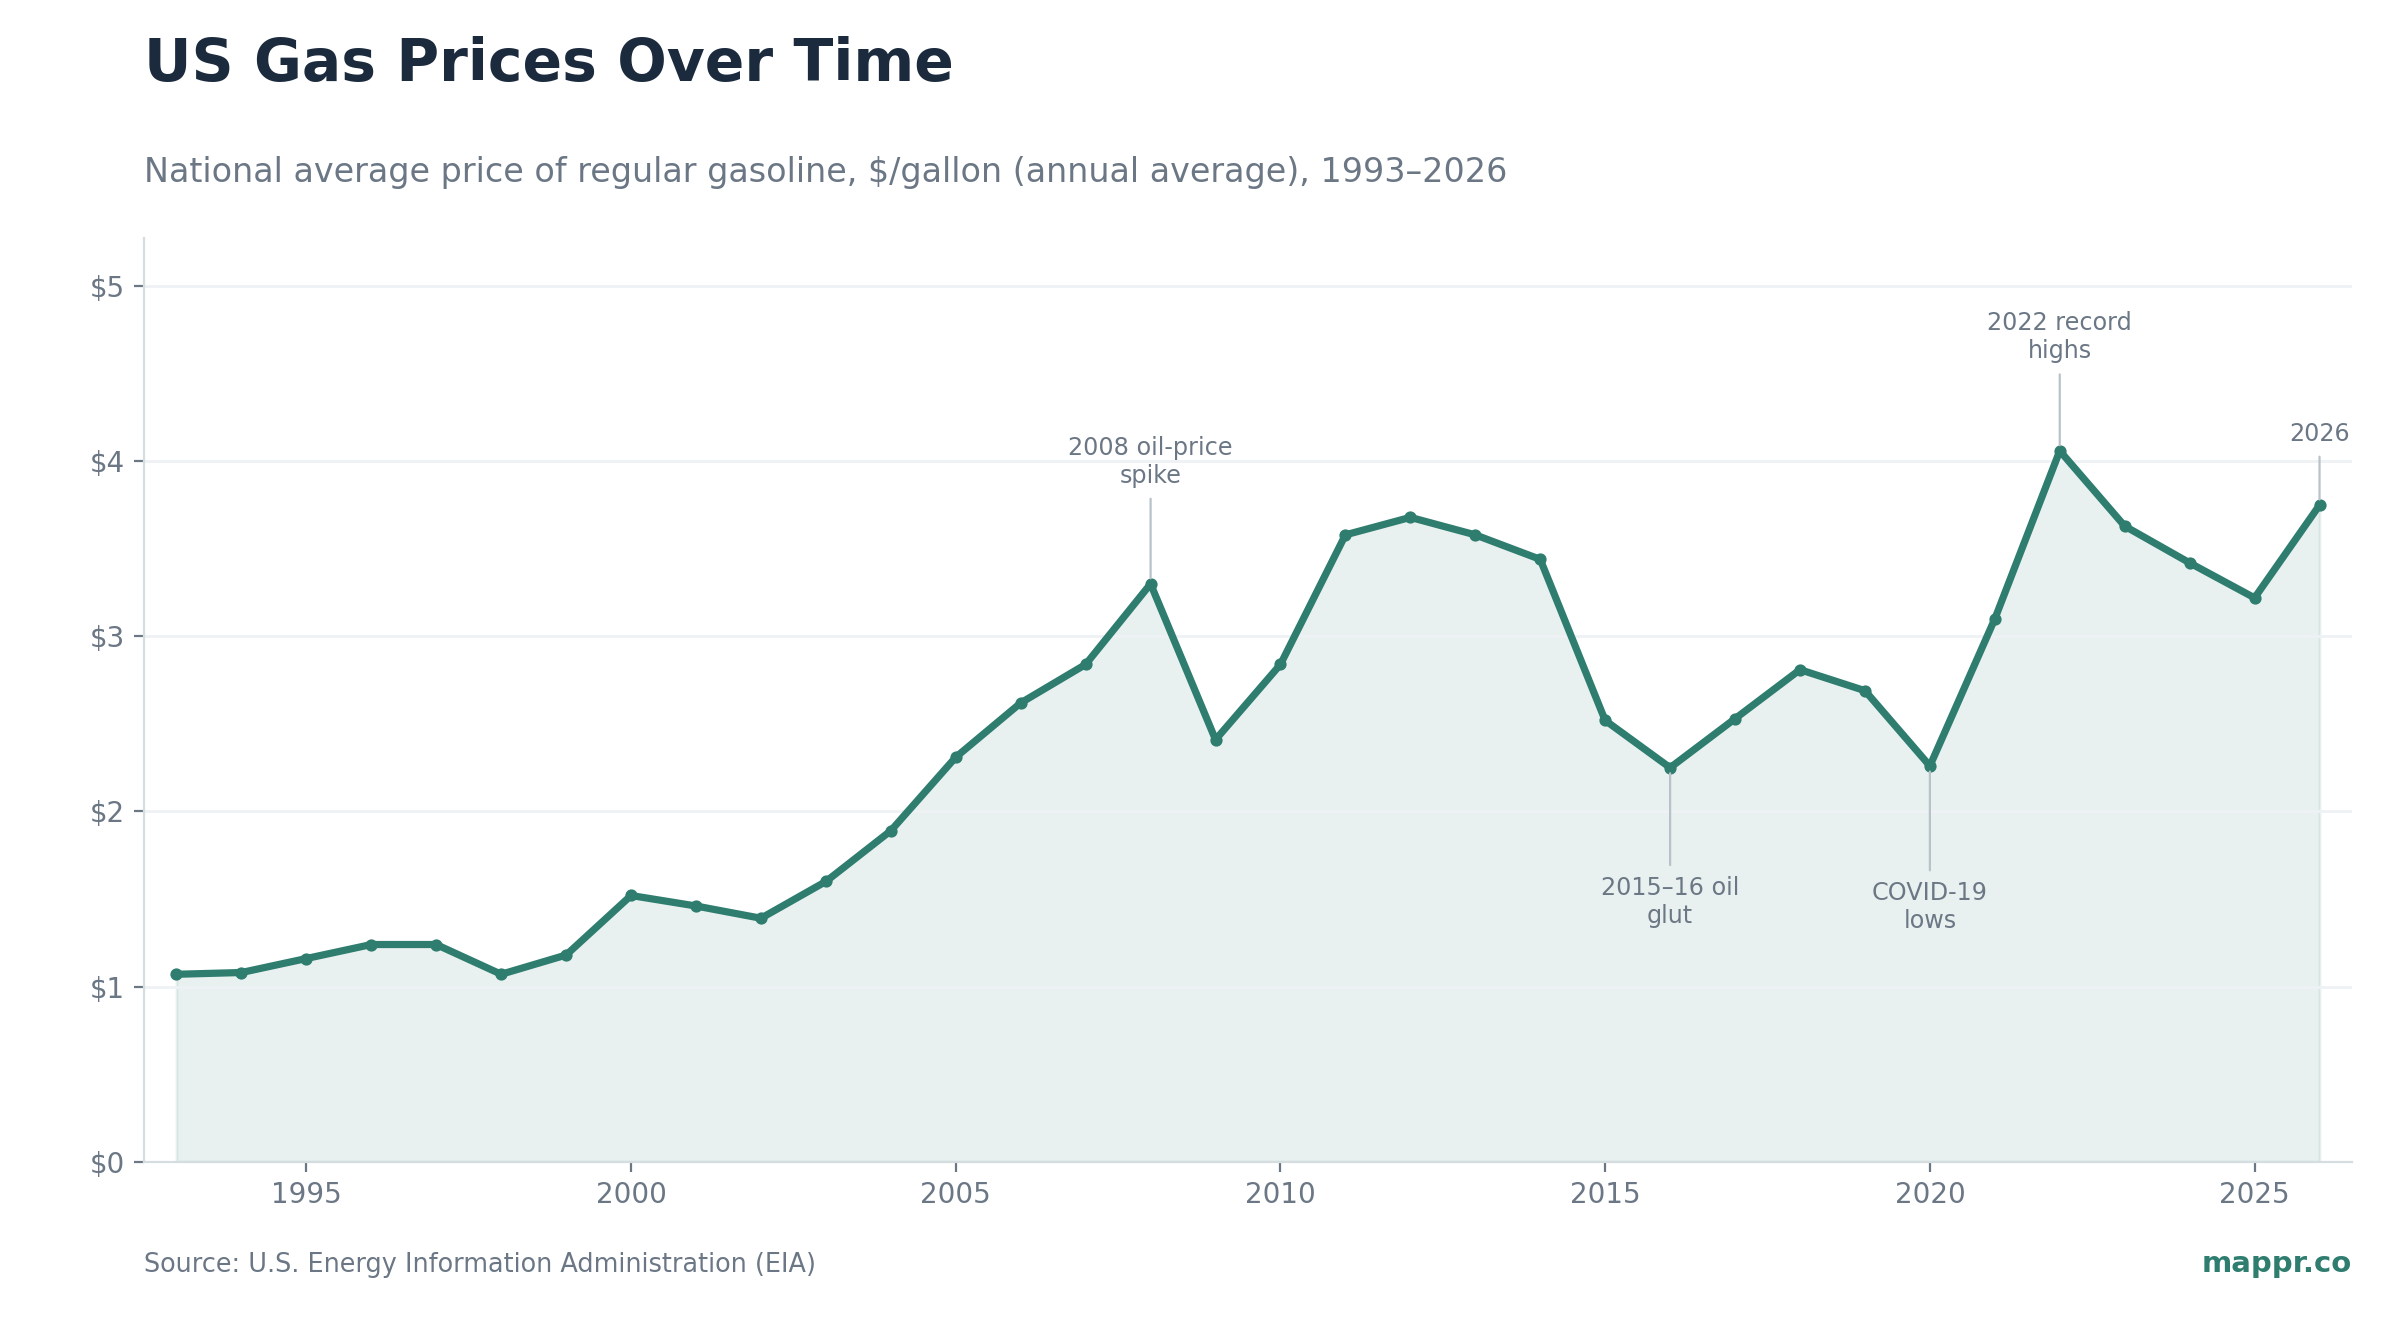
Measured at the pump and unadjusted for inflation, the US national average for a gallon of regular gasoline has roughly tripled since the early 1990s — from about $1.07/gal in 1993 to around $3.75/gal in 2026. The climb, though, has been anything but steady.
Prices first pushed past $3/gal during the 2008 oil-price spike — which briefly topped $4/gal at mid-year before the financial crisis sent them crashing — then settled into a plateau above $3.30/gal through the early 2010s. They tumbled during the 2015–16 oil glut and again during the COVID-19 demand collapse of 2020, when the annual average fell to about $2.25/gal. The rebound that followed was the steepest on record: the post-pandemic recovery and the 2022 energy shock drove the annual average to a record $4.06/gal in 2022, with the nationwide price briefly cresting $5/gal that June.
- Record annual high: 2022 ($4.06/gal; above $5/gal at the June 2022 peak).
- Modern lows: 2016 and 2020 (around $2.25/gal), during the oil glut and the pandemic demand collapse.
- The long run: roughly 3.5× higher than in 1993, before adjusting for inflation.
Source: U.S. Energy Information Administration (EIA), weekly U.S. regular all-formulations retail gasoline prices, annual averages.