Key Takeaways
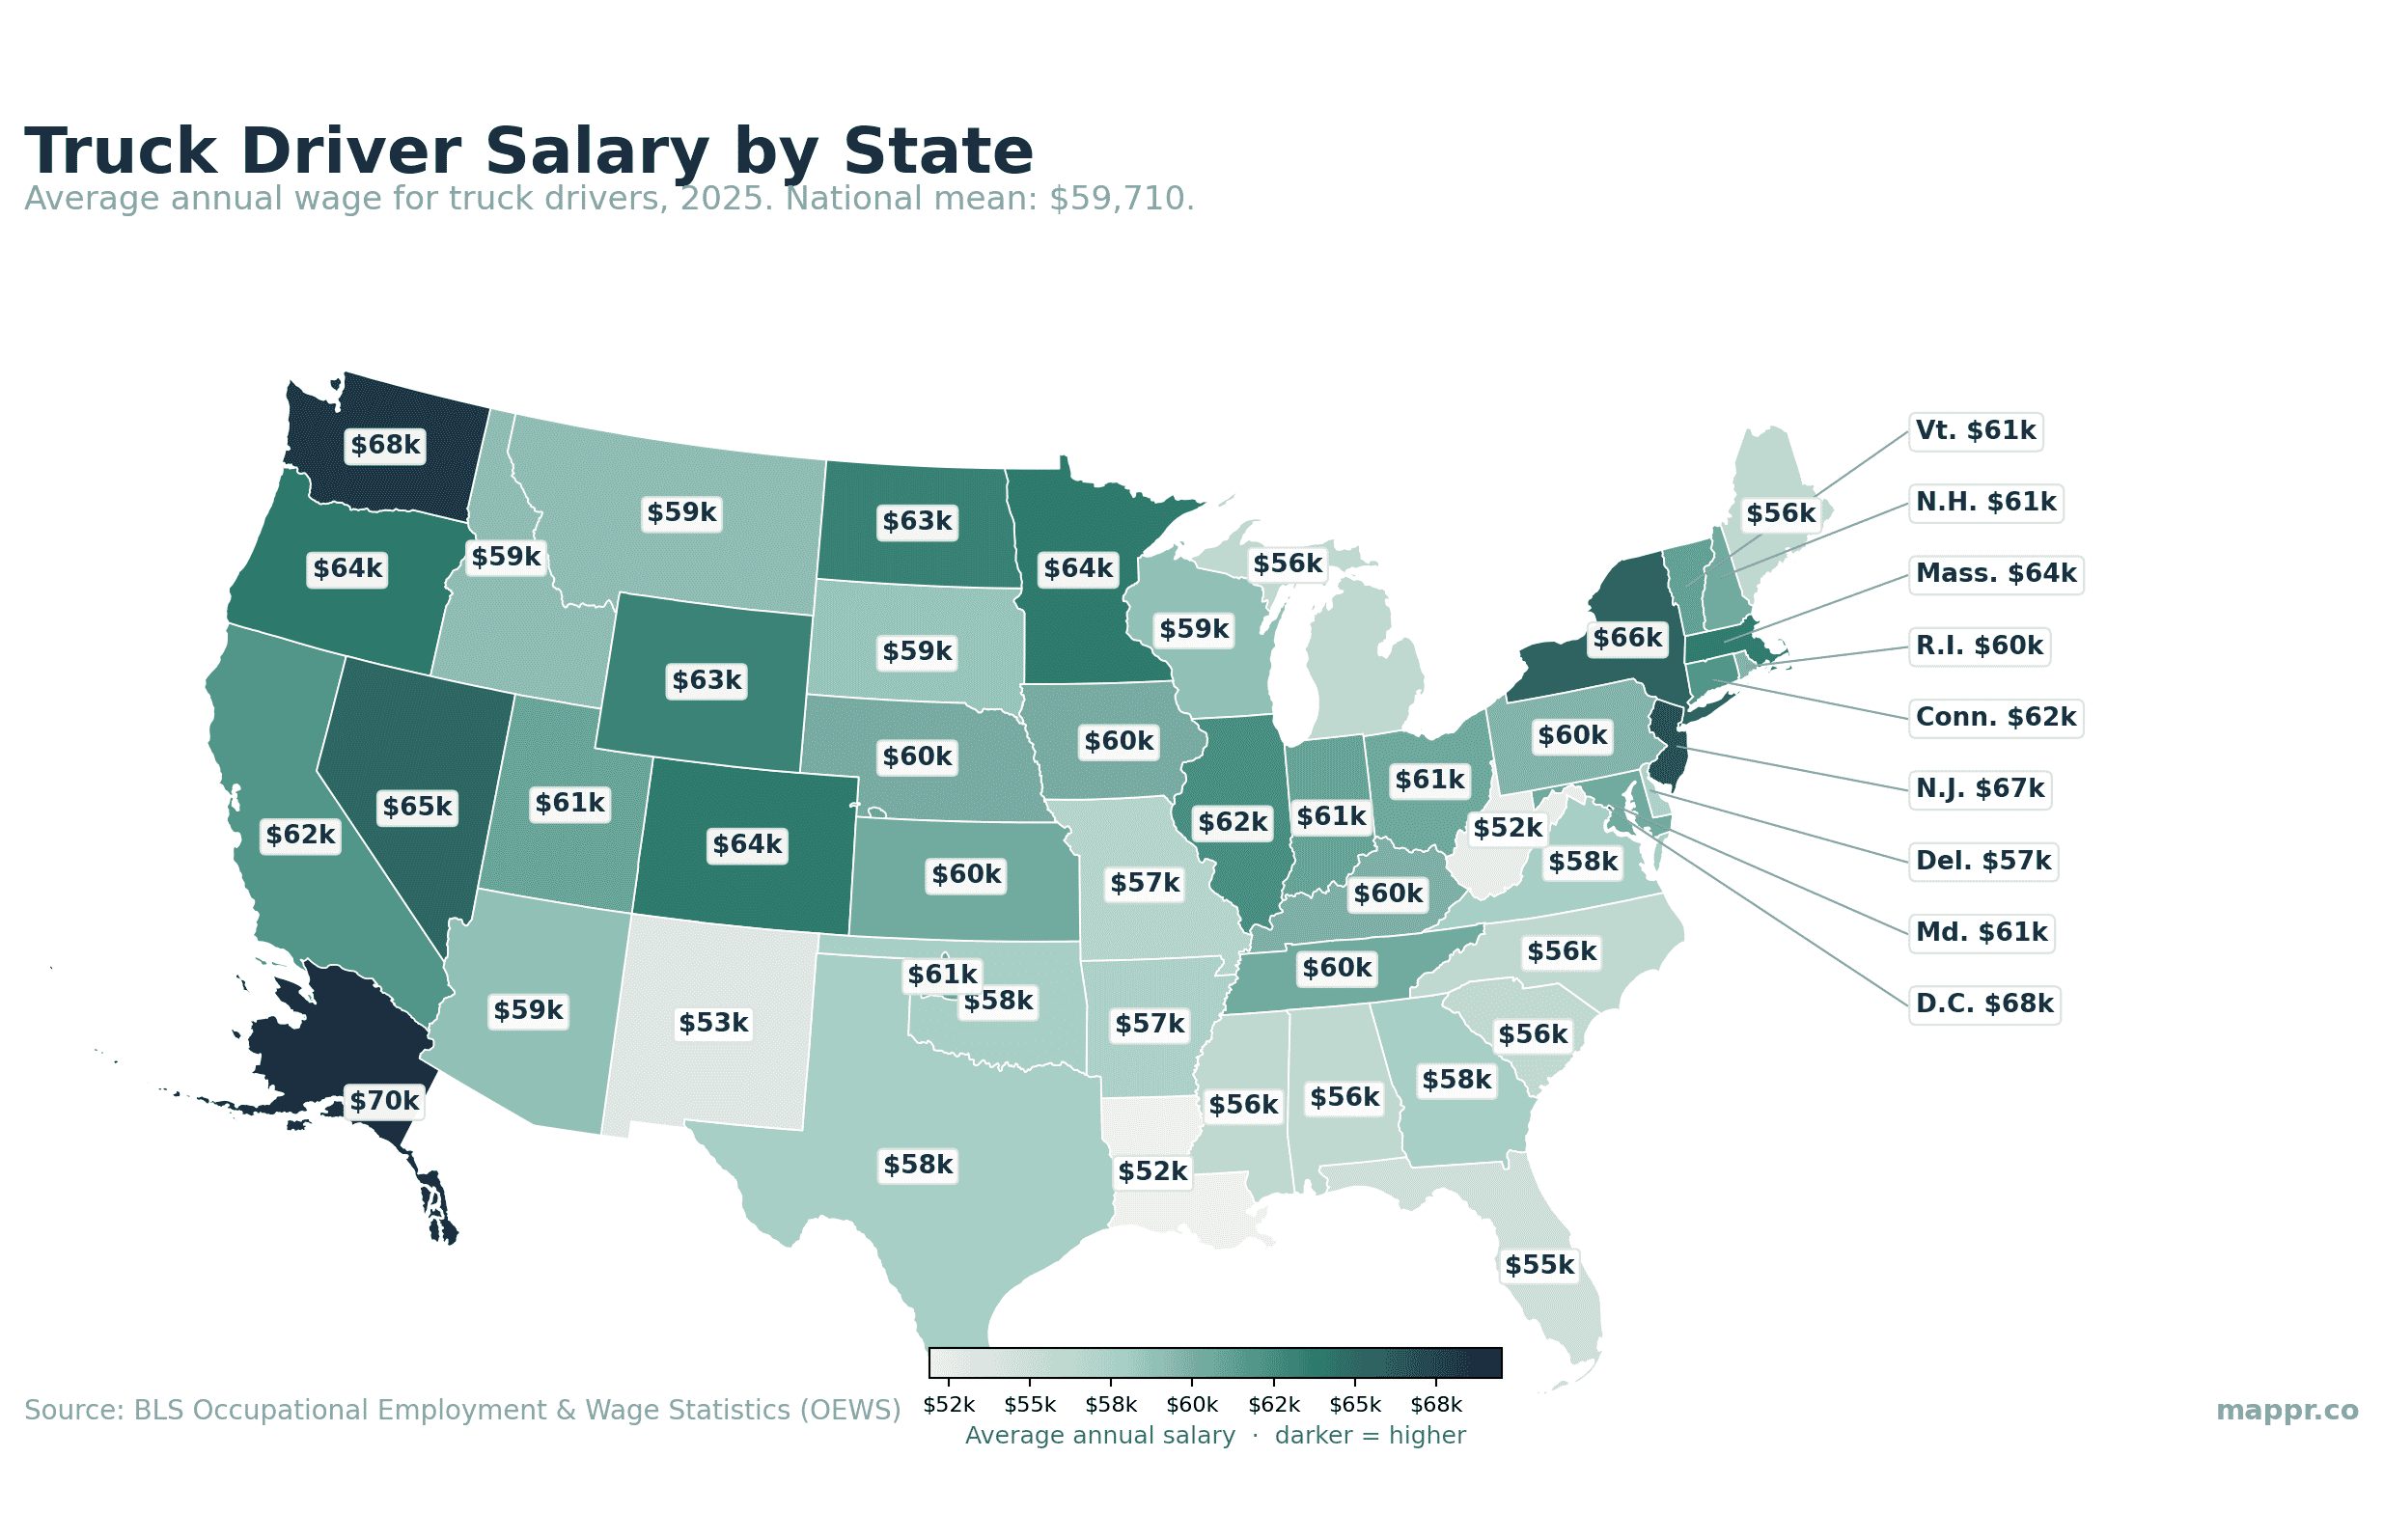
- National average is $59,710. Truck Drivers earn an average of $59,710 a year nationally (2025, BLS OEWS), with a median of $58,640.
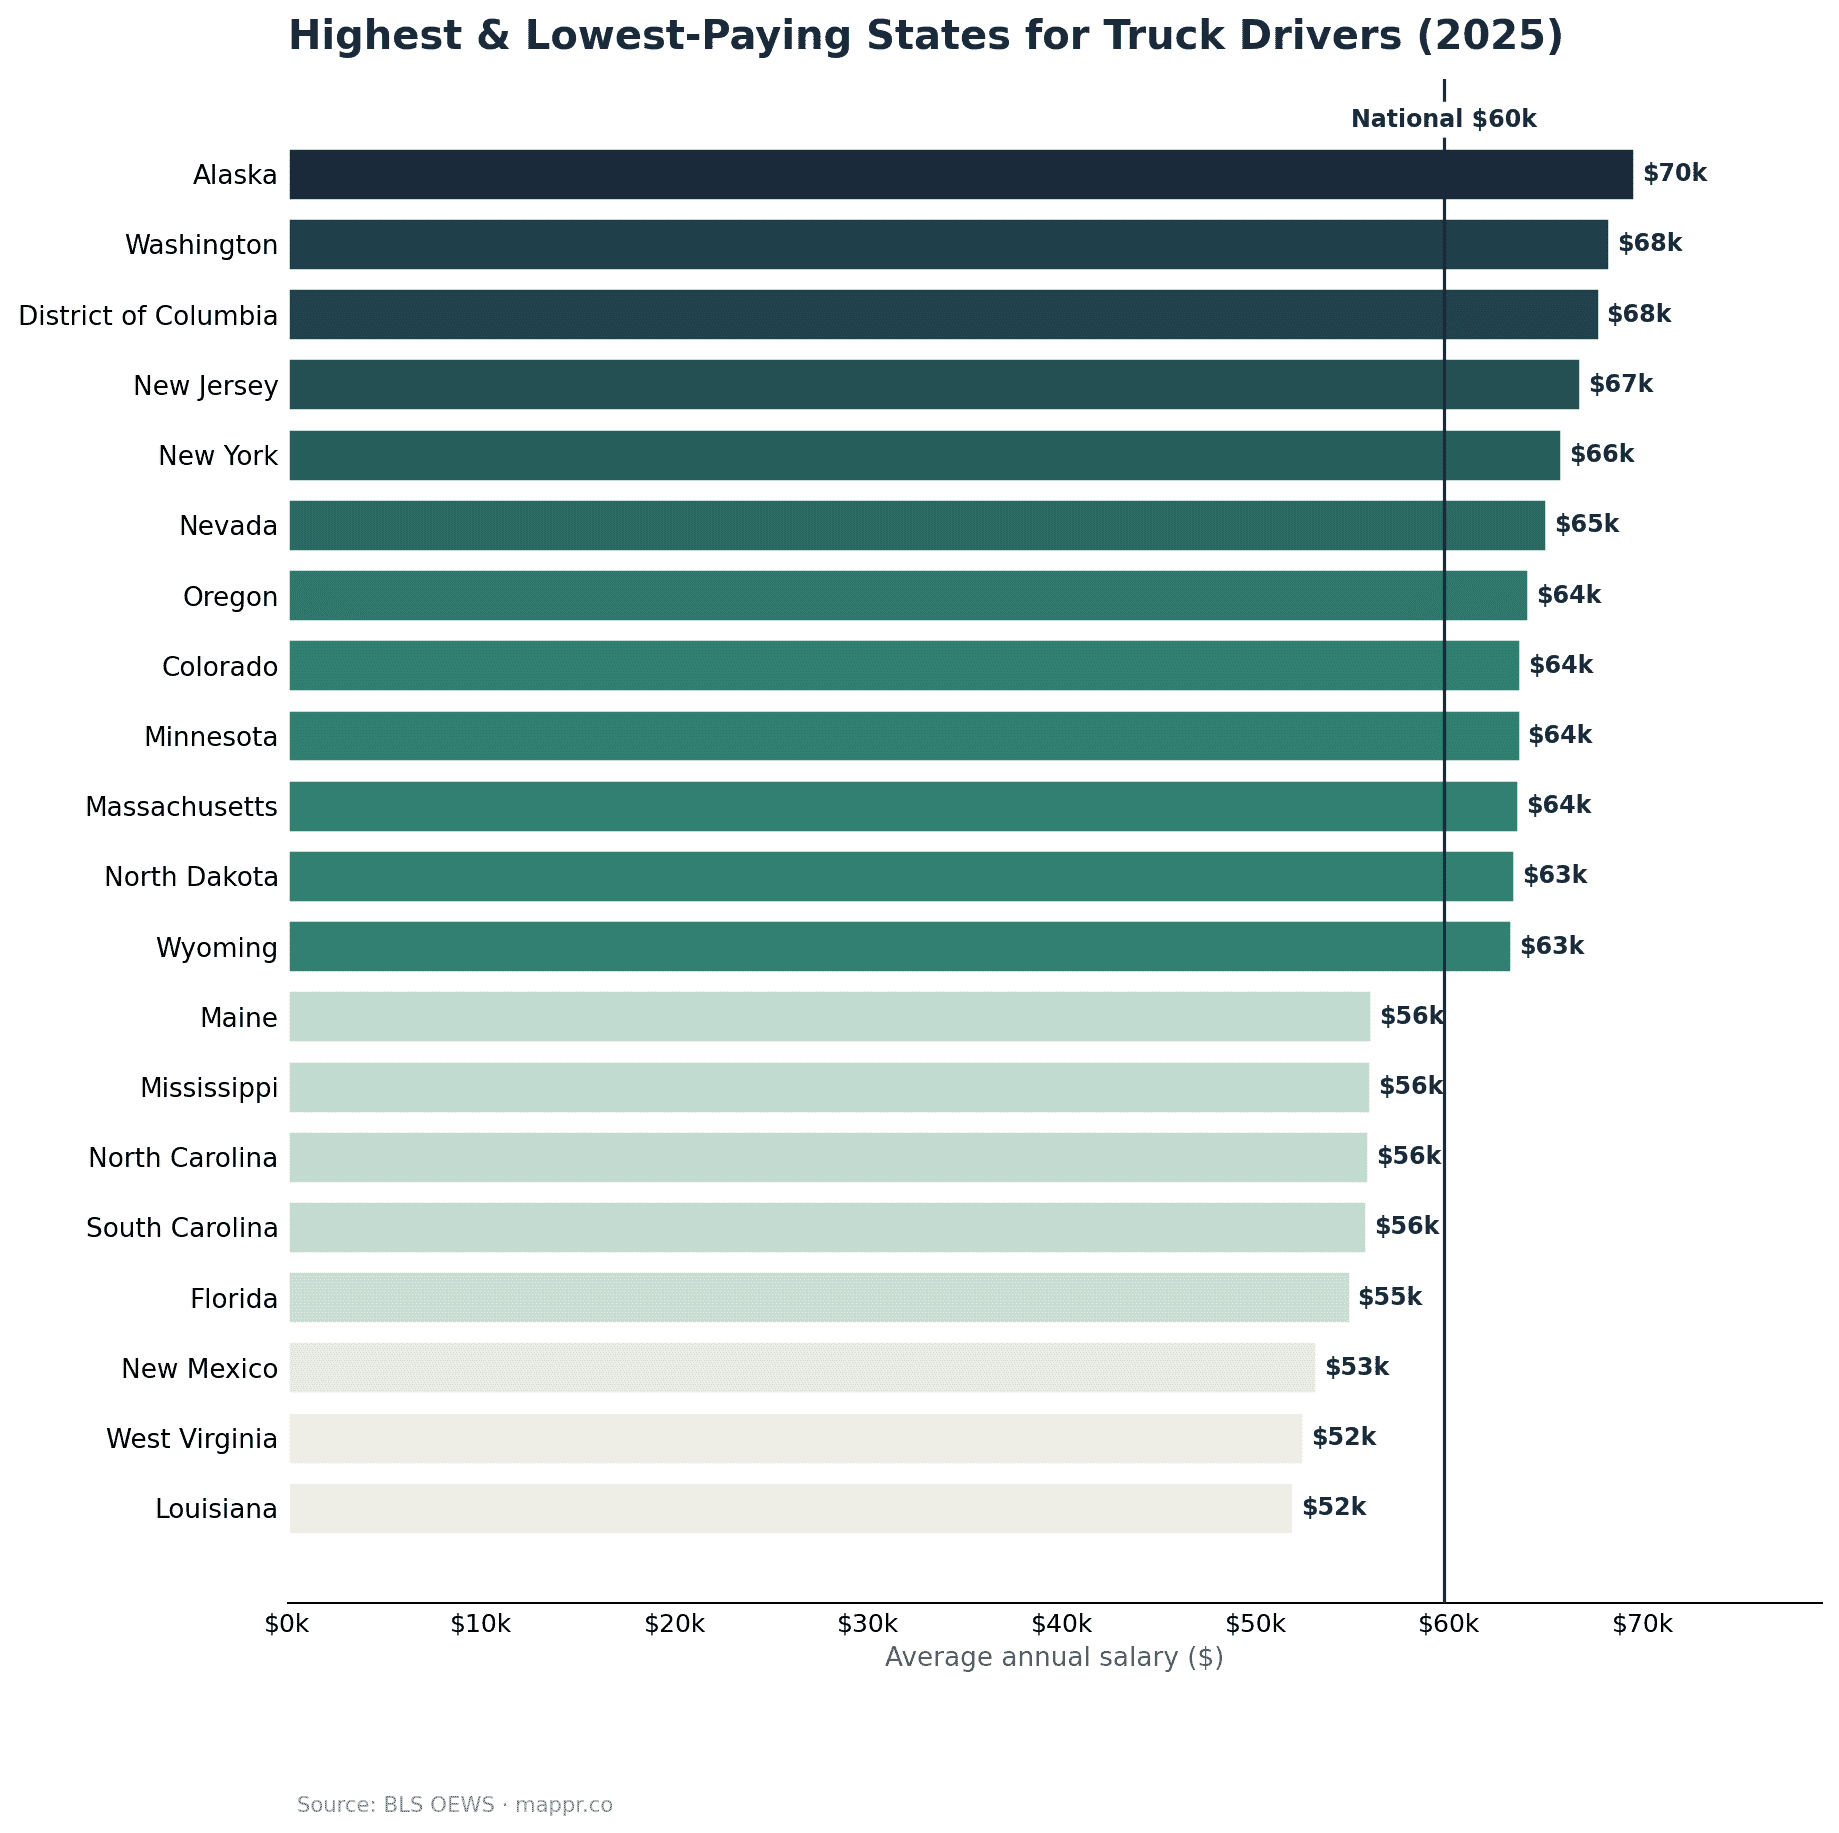
- Alaska pays the most. Alaska leads at $69,520 — about 1.3x what the lowest-paying state offers.
- Louisiana pays the least. Louisiana is lowest at $51,930. Pay broadly tracks local cost of living.
- Location matters. The same job can pay tens of thousands more depending on the state — before adjusting for how far that money goes locally.
How much do truck drivers earn — and where are they paid the most? Using the latest wage data from the U.S. Bureau of Labor Statistics, here is the average truck driver salary in every state, mapped and ranked. Nationally, truck drivers earn an average of $59,710 a year.
Truck Driver salary by state, mapped
Highest and lowest-paying states
Alaska pays truck drivers the most at an average of $69,520, while Louisiana pays the least at $51,930 — a gap of roughly 1.3x. Remember that higher-paying states also tend to have a higher cost of living.
Full table: salary by state
Average and median annual salary plus total employment for all 50 states and D.C. — sortable and searchable.
| Rank | State | Avg salary | Median salary | Employment |
|---|---|---|---|---|
| 1 | Alaska | $69,520 | $70,100 | 3,420 |
| 2 | Washington | $68,230 | $64,760 | 40,530 |
| 3 | District of Columbia | $67,710 | $64,170 | 830 |
| 4 | New Jersey | $66,770 | $63,570 | 47,980 |
| 5 | New York | $65,780 | $62,050 | 63,700 |
| 6 | Nevada | $65,010 | $62,290 | 15,010 |
| 7 | Oregon | $64,080 | $61,980 | 23,970 |
| 8 | Colorado | $63,650 | $61,500 | 25,350 |
| 9 | Minnesota | $63,630 | $61,990 | 38,770 |
| 10 | Massachusetts | $63,570 | $63,030 | 30,890 |
| 11 | North Dakota | $63,330 | $60,910 | 11,870 |
| 12 | Wyoming | $63,180 | $60,310 | 6,050 |
| 13 | Illinois | $62,430 | $60,320 | 84,200 |
| 14 | California | $62,020 | $60,230 | 205,090 |
| 15 | Connecticut | $61,980 | $60,490 | 15,740 |
| 16 | Vermont | $61,100 | $60,830 | 3,560 |
| 17 | Indiana | $60,950 | $60,290 | 59,090 |
| 18 | Utah | $60,900 | $60,620 | 25,060 |
| 19 | Hawaii | $60,850 | $59,820 | 4,070 |
| 20 | Ohio | $60,660 | $59,800 | 83,060 |
| 21 | New Hampshire | $60,600 | $60,280 | 6,960 |
| 22 | Maryland | $60,590 | $59,360 | 29,150 |
| 23 | Kansas | $60,480 | $58,920 | 24,220 |
| 24 | Tennessee | $60,440 | $58,620 | 64,890 |
| 25 | Iowa | $60,070 | $58,070 | 35,040 |
| 26 | Nebraska | $60,070 | $58,390 | 23,160 |
| 27 | Kentucky | $59,870 | $56,340 | 31,760 |
| 28 | Rhode Island | $59,660 | $60,190 | 3,620 |
| 29 | Pennsylvania | $59,640 | $58,580 | 87,550 |
| 30 | Montana | $59,180 | $58,870 | 7,830 |
| 31 | Idaho | $59,160 | $58,770 | 15,920 |
| 32 | Wisconsin | $58,890 | $58,610 | 53,330 |
| 33 | Arizona | $58,870 | $58,080 | 40,150 |
| 34 | South Dakota | $58,550 | $58,690 | 6,470 |
| 35 | Texas | $57,990 | $56,290 | 209,680 |
| 36 | Georgia | $57,780 | $57,050 | 74,840 |
| 37 | Virginia | $57,770 | $56,860 | 48,750 |
| 38 | Oklahoma | $57,670 | $54,410 | 27,840 |
| 39 | Arkansas | $57,390 | $51,550 | 32,220 |
| 40 | Delaware | $57,380 | $57,590 | 9,040 |
| 41 | Missouri | $56,830 | $54,550 | 47,760 |
| 42 | Michigan | $56,370 | $57,180 | 60,800 |
| 43 | Alabama | $56,230 | $52,120 | 36,650 |
| 44 | Maine | $55,980 | $57,050 | 9,980 |
| 45 | Mississippi | $55,910 | $51,820 | 24,160 |
| 46 | North Carolina | $55,810 | $51,530 | 62,400 |
| 47 | South Carolina | $55,680 | $51,130 | 34,170 |
| 48 | Florida | $54,850 | $50,640 | 112,920 |
| 49 | New Mexico | $53,100 | $50,500 | 11,820 |
| 50 | West Virginia | $52,440 | $49,480 | 12,190 |
| 51 | Louisiana | $51,930 | $49,320 | 28,540 |
About the data
Figures are average (mean) and median annual wages from the BLS Occupational Employment and Wage Statistics (OEWS) program, 2025 estimates, for the “Truck Drivers” occupation. OEWS is released annually. Wages are gross, before tax, and not adjusted for state cost-of-living differences.
Data and references: