Key Takeaways
- The United States dominates the all-time count with 427 laureates. That's nearly three times the United Kingdom (144), with Germany (116) and France (79) next. The US has featured in the 2026 announcements too.
- Divide by population and the map flips completely. Sweden (32.1 laureates per 10 million people), Switzerland (29.7), Austria (27.1), Norway (25.0) and Denmark (23.3) lead; the US falls to 11th at 12.5. Tiny Saint Lucia, with two laureates and 180,000 people, beats everyone.
- A third of American laureates were born somewhere else. The US is credited with 427 laureates but only 297 were born there: a net import of about 130 minds. Poland shows the reverse: 28 laureates born there, just 19 credited.
- Five of the six 2026 prizes are already out. Medicine, Physics, Chemistry, Literature and Peace landed October 5 to 9; Economic Sciences follows on Monday, October 12.
Nobel week is in full swing. Between October 5 and 9 the committees in Stockholm and Oslo named eight new laureates across five prizes, with the sixth, Economic Sciences, due on Monday. That makes this the right moment for a question the announcements never quite answer: where do Nobel laureates actually come from?
The map below counts every laureate since 1901 under the country (or countries) stated by the Nobel committee, through this week’s announcements: more than 1,000 laureates across 81 countries and territories. Because many laureates are credited to two countries, national counts sum to more than the number of people honored.
The Map: All-Time Nobel Laureates by Country
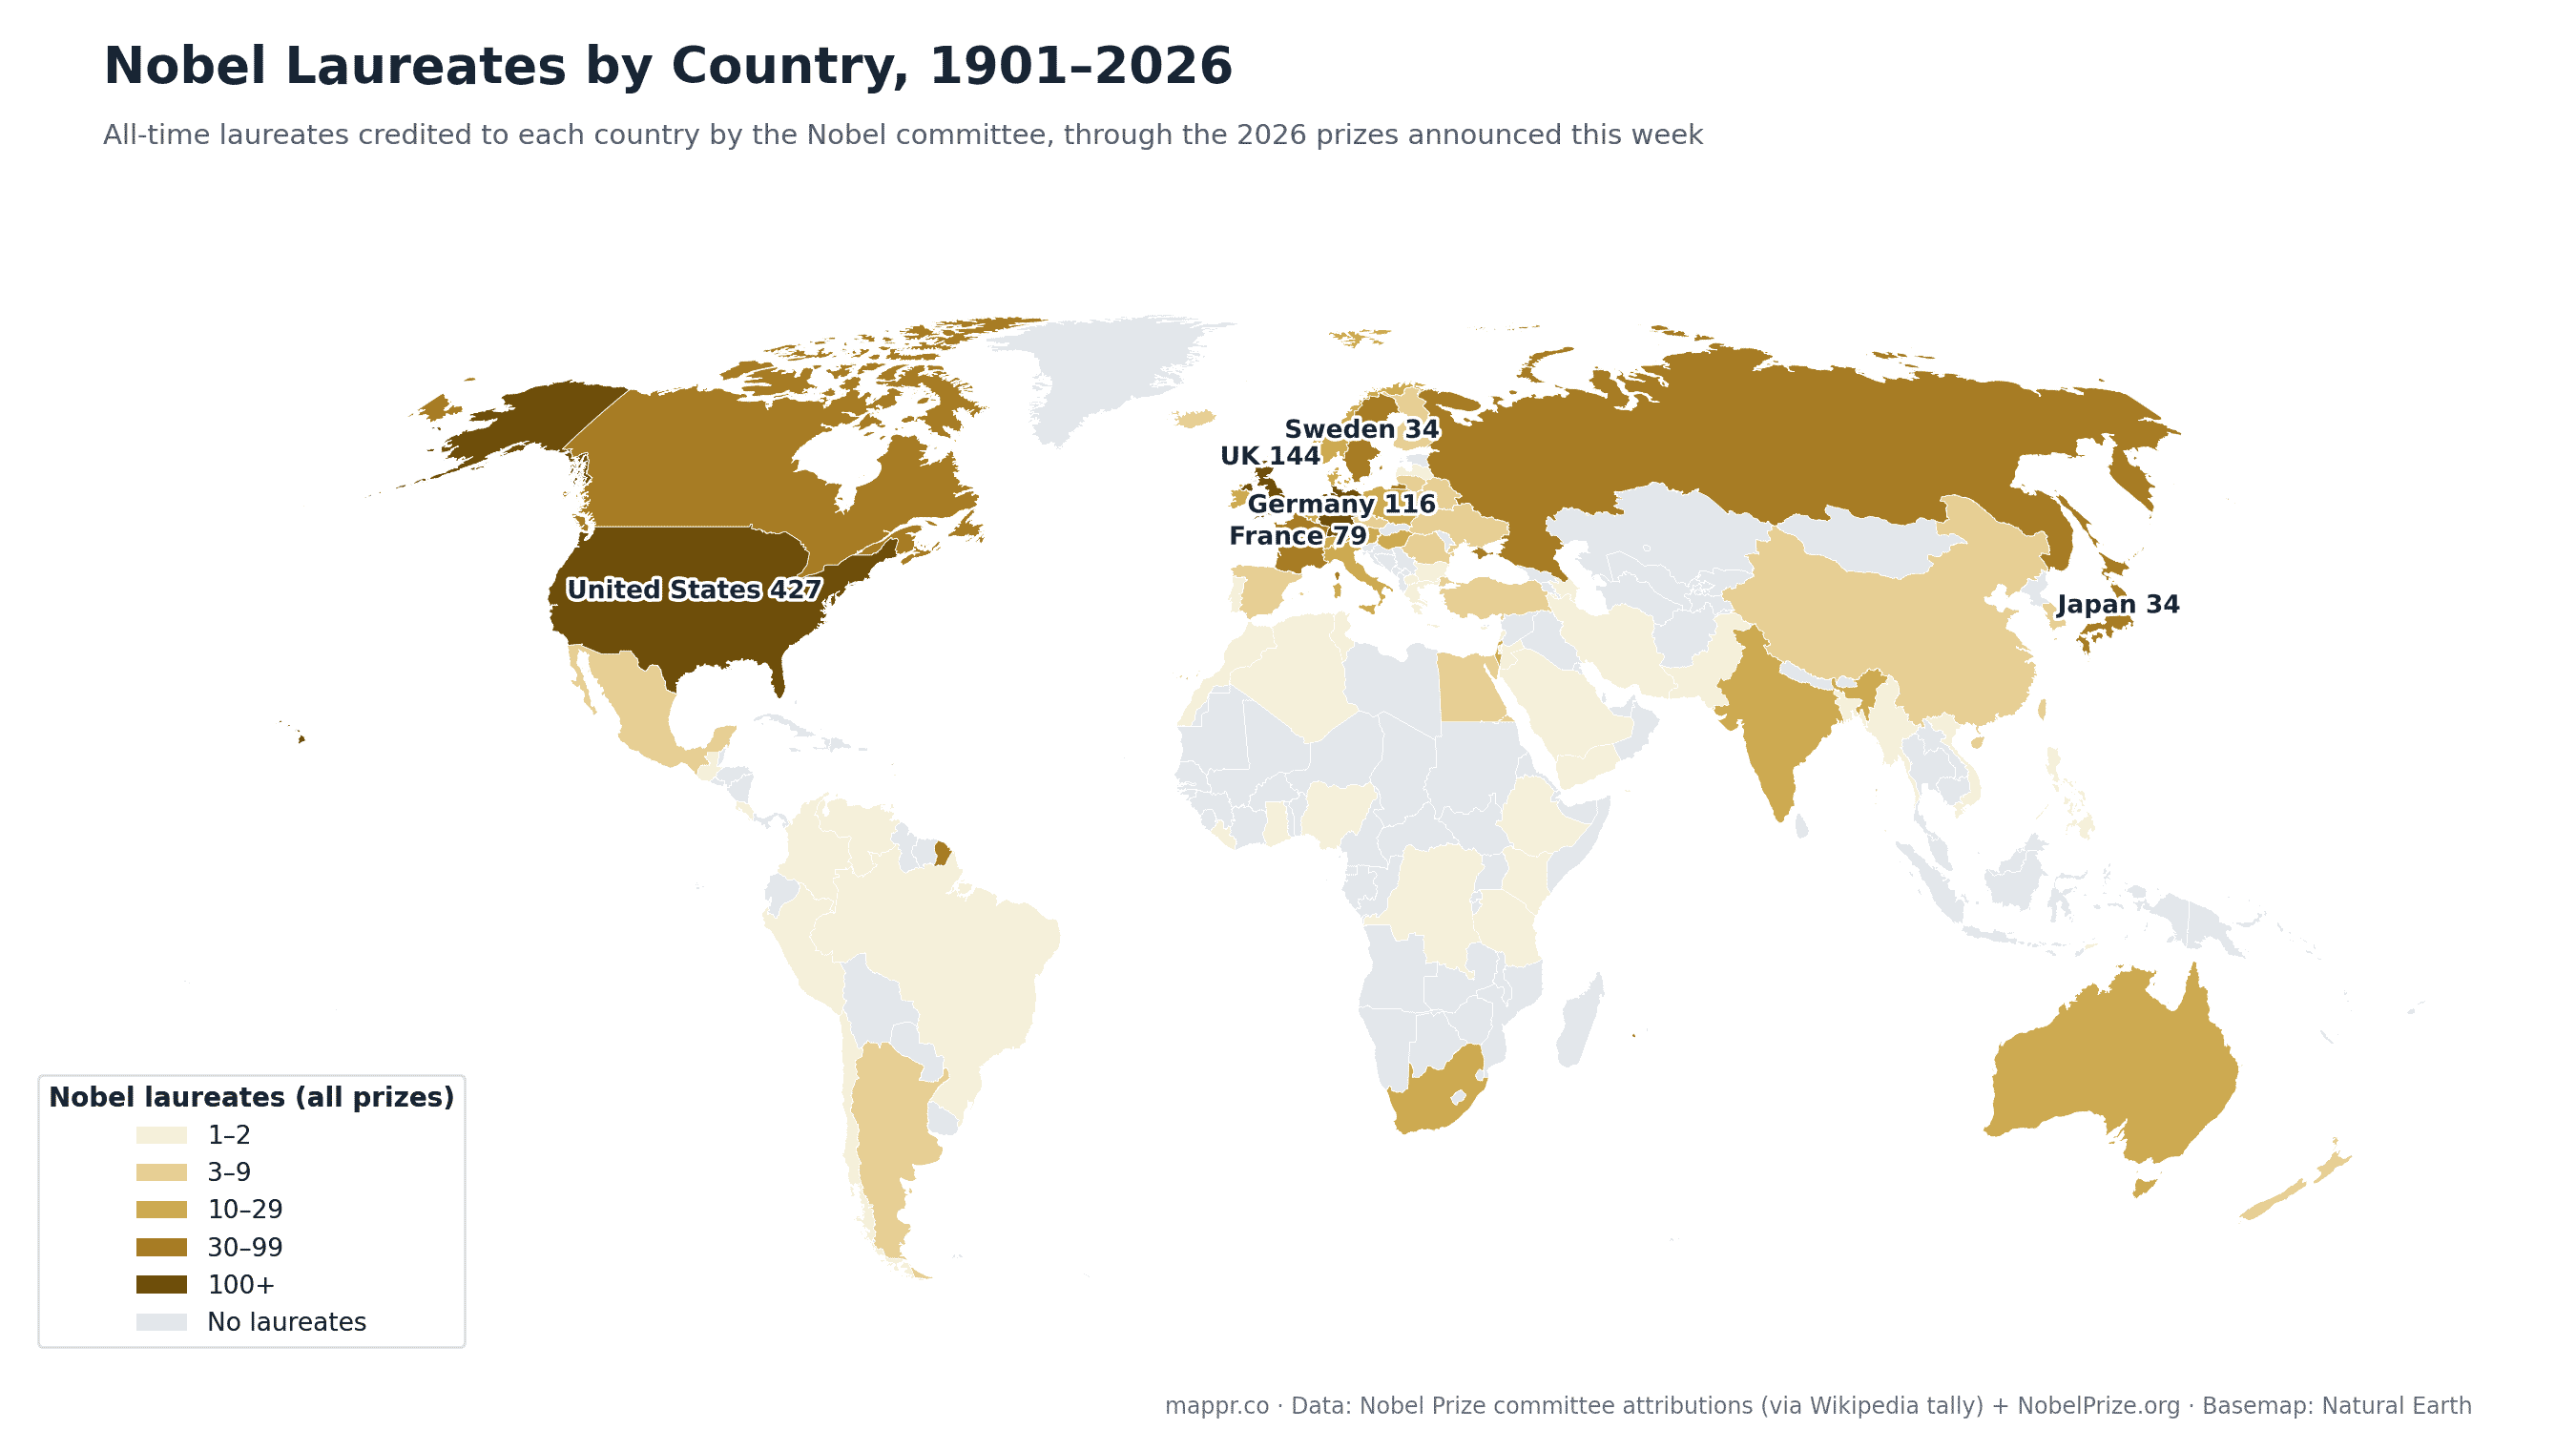
The United States towers over the absolute count: 427 laureates, more than the next three countries combined. The United Kingdom (144), Germany (116) and France (79) form the European core, with Japan (34) the strongest non-Western performer and Sweden (34) carrying the founder’s flag. The sciences drive the concentration: physics laureates come from just 30 birth countries, economics from 21.
The 2026 Prizes So Far
🧬 Medicine (Oct 5): Karl Deisseroth 🇺🇸, Peter Hegemann 🇩🇪 and Georg Nagel 🇩🇪 for optogenetics, controlling brain cells with light.
⚛️ Physics (Oct 6): Francis Halzen 🇺🇸 for the IceCube observatory’s detection of high-energy cosmic neutrinos.
⚗️ Chemistry (Oct 7): Henri B. Kagan 🇫🇷 and Kenso Soai 🇯🇵 for asymmetric catalysis and non-linear effects.
📖 Literature (Oct 8): Anne Carson 🇨🇦, the poet and classicist.
🕊️ Peace (Oct 9): Navi Pillay 🇿🇦 for a lifetime of human-rights and international-law work.
💹 Economic Sciences: announced Monday, October 12. We will fold the winner into this page when it lands.
Per Capita, the Map Flips
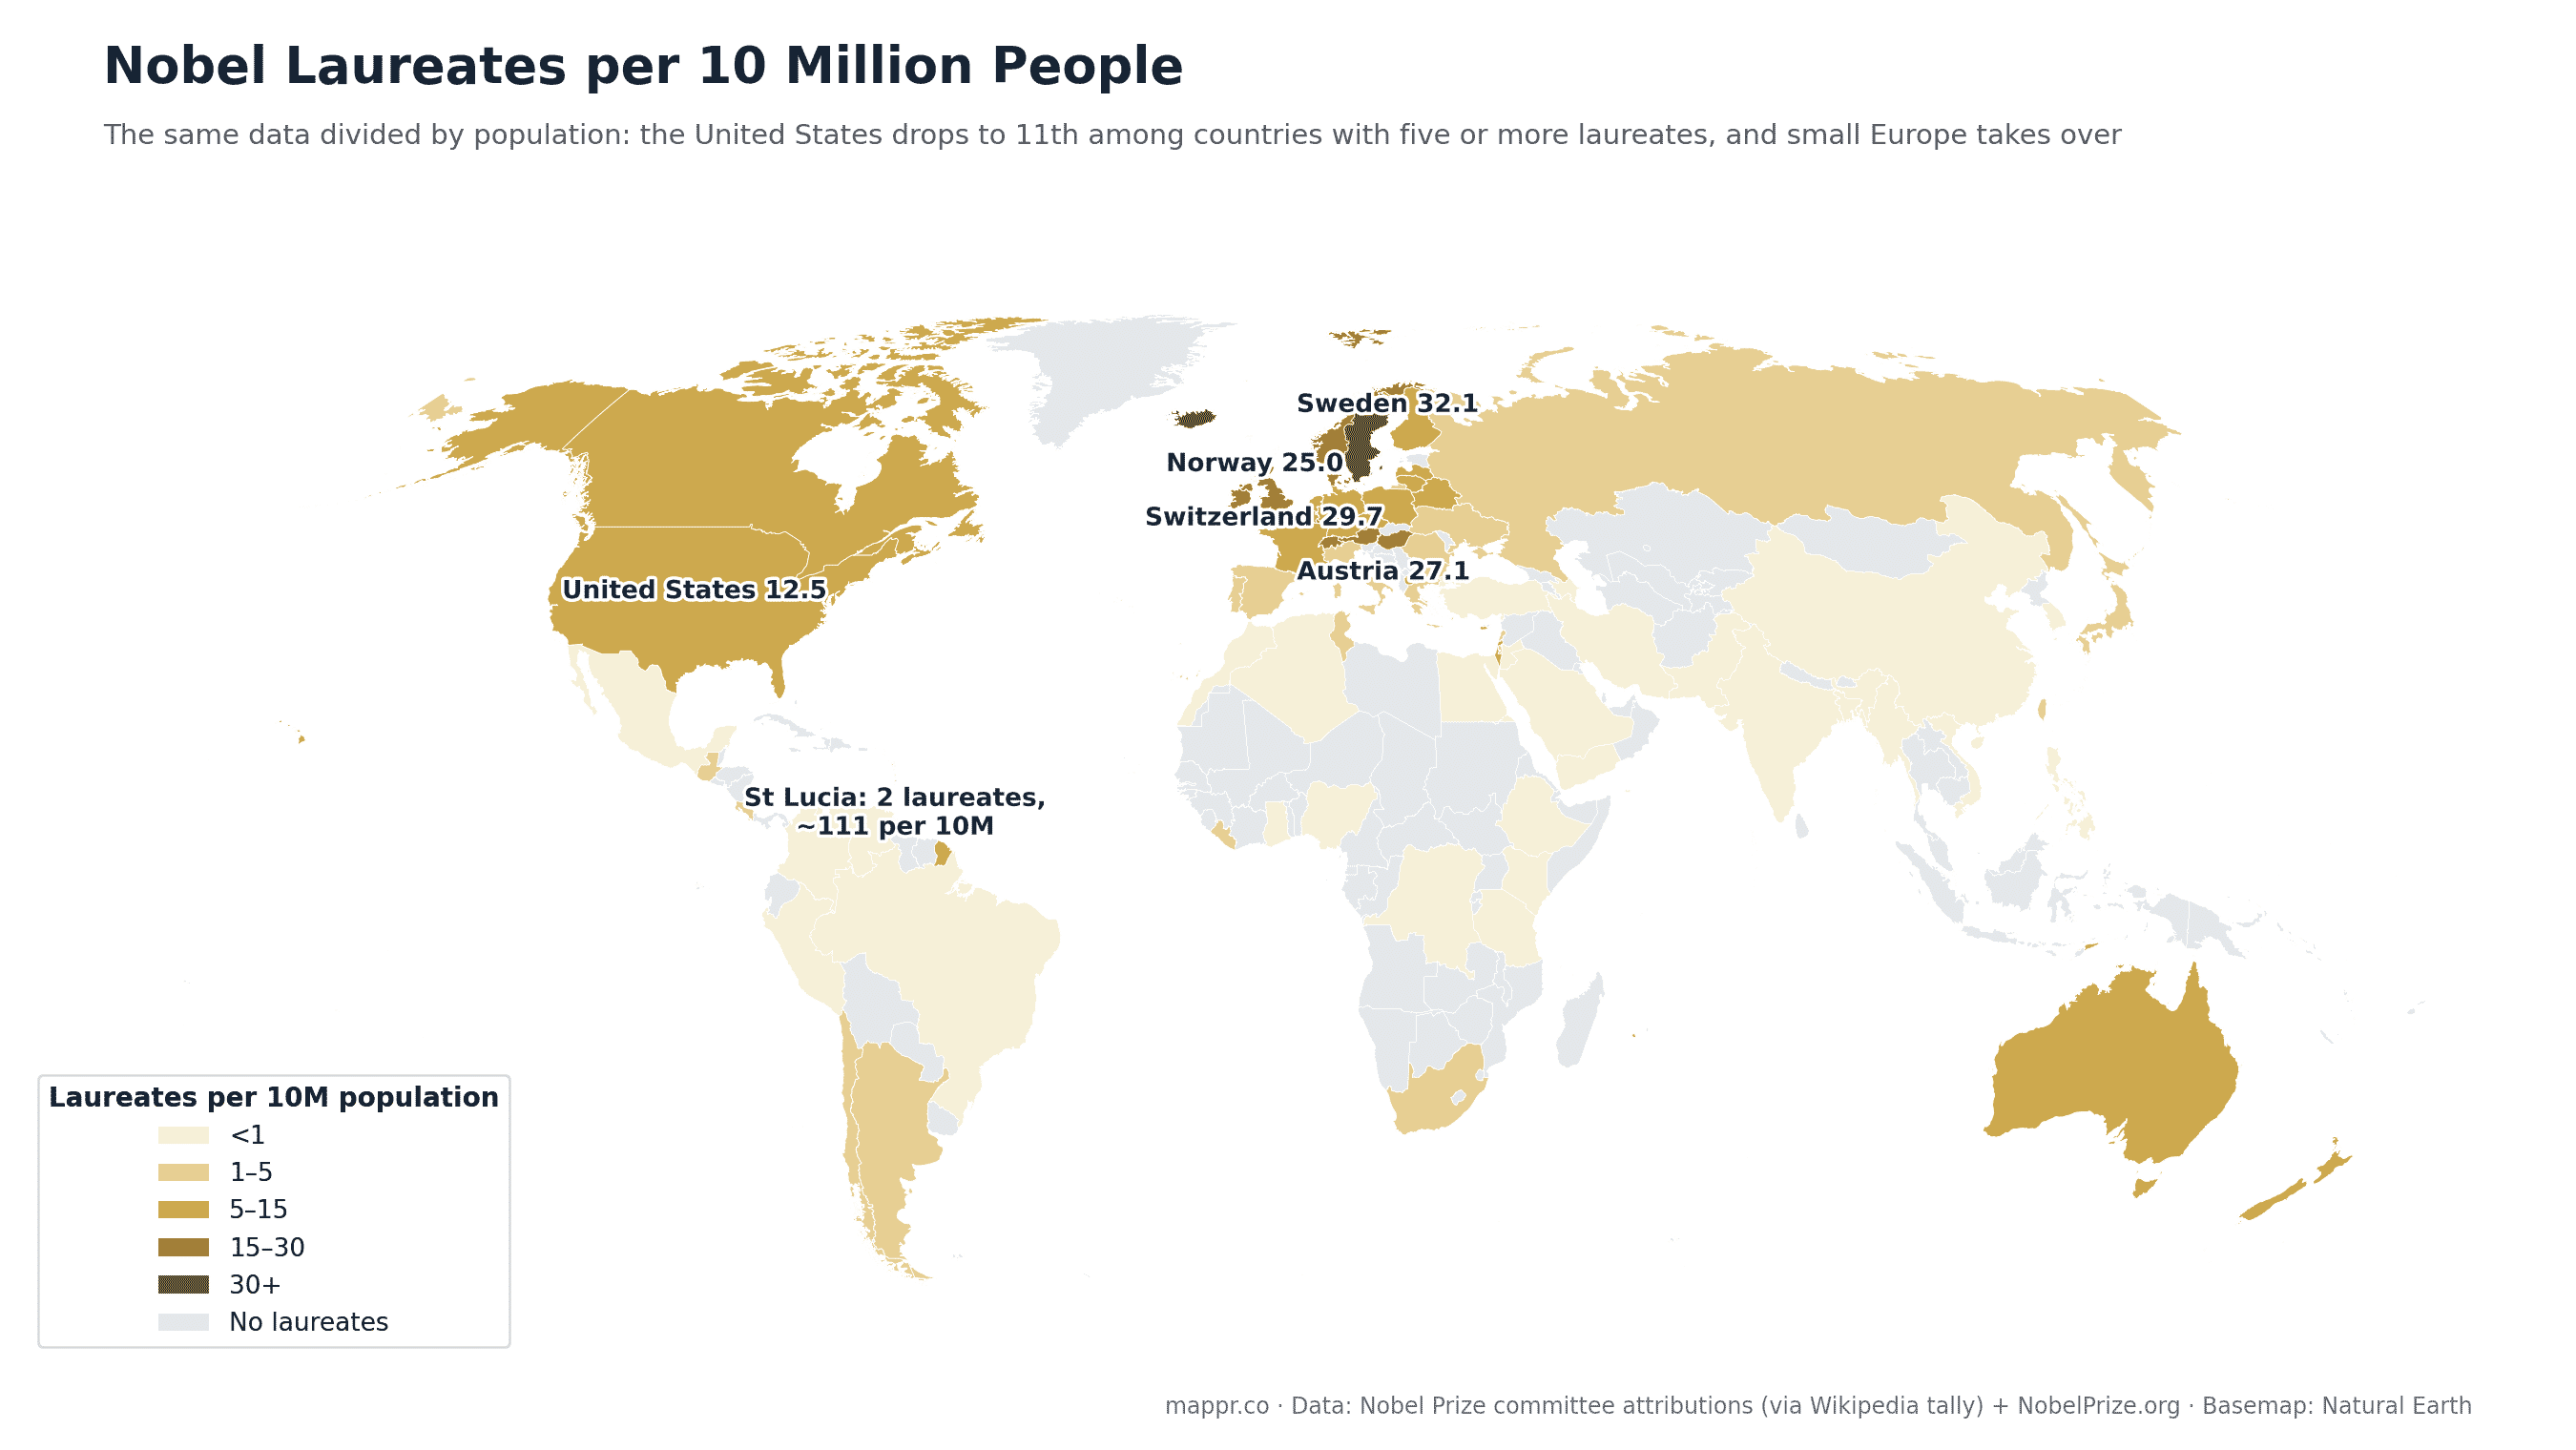
Divide the same counts by population and American dominance evaporates. Among countries with at least five laureates, Sweden leads at 32.1 per 10 million people, then Switzerland (29.7), Austria (27.1), Norway (25.0) and Denmark (23.3). The United States ranks 11th at 12.5.
Drop the threshold and the microstates run away with it: Saint Lucia, population about 180,000, has two laureates (economist Arthur Lewis and poet Derek Walcott), roughly 111 per 10 million, and the Faroe Islands and Iceland post similarly outsized rates on one to three laureates each.
Born There vs. Honored There
The committee’s country attributions hide the migration underneath. Matching each laureate’s birthplace against the country credited shows the United States as the great importer: 427 laureates credited, 297 born there, a net gain of roughly 130. The UK (+34), Germany (+30) and France (+15) also gain, mostly through refugee scientists of the 1930s and the postwar research magnet of Anglo-American universities.
Poland is the mirror image: 28 Nobel laureates were born on Polish soil, but only 19 are credited to Poland. Marie Curie counts for France, and a generation of scientists born in partitioned or interwar Poland won their prizes elsewhere. Russia, Italy and the Netherlands roughly break even.
The Ranking
Ranked
Nobel laureates by country: the top 15
Committee-stated country attributions, 1901-2026, including this week’s prizes. Per-capita column uses current population.
| Country | Laureates | Per 10M | Note |
|---|---|---|---|
| 🇺🇸 United States | 427 | 12.5 | 430 prizes; Bardeen, Pauling and Sharpless won twice |
| 🇬🇧 United Kingdom | 144 | 20.7 | Frederick Sanger won chemistry twice |
| 🇩🇪 Germany | 116 | 13.9 | 2026 medicine laureates Hegemann and Nagel |
| 🇫🇷 France | 79 | 11.5 | 2026 chemistry laureate Henri B. Kagan |
| 🇯🇵 Japan | 34 | 2.8 | 2026 chemistry laureate Kenso Soai |
| 🇸🇪 Sweden | 34 | 32.1 | Per-capita leader among big winners |
| 🇷🇺 Russia / USSR | 30 | 2.1 | |
| 🇨🇦 Canada | 30 | 7.5 | 2026 literature laureate Anne Carson |
| 🇨🇭 Switzerland | 27 | 29.7 | |
| 🇦🇹 Austria | 25 | 27.1 | |
| 🇳🇱 Netherlands | 22 | 12.2 | |
| 🇮🇹 Italy | 21 | 3.6 | |
| 🇵🇱 Poland | 19 | 5.2 | 28 laureates born there: the great exporter |
| 🇭🇺 Hungary | 16 | 16.8 | |
| 🇦🇺 Australia | 15 | 5.6 |
Where the Prizes Travel Widest
The six categories spread very differently. Peace laureates have been born in 50 countries and literature laureates in 47, reaching Latin America, Africa and Asia for over a century. The sciences stay concentrated: chemistry spans 39 birth countries, medicine 38, physics just 30 and economics only 21, with the overwhelming majority of science prizes going to researchers working at American, British, German or Japanese institutions, wherever they were born.
The Full List: Every Country With a Nobel Laureate
All 81 countries and territories the Nobel committee has credited since 1901, searchable and sortable, with per-capita rates where populations allow.
| Country | Laureates | Per 10M people |
|---|---|---|
| United States | 427 | 12.5 |
| United Kingdom | 144 | 20.7 |
| Germany | 116 | 13.9 |
| France | 79 | 11.5 |
| Japan | 34 | 2.8 |
| Sweden | 34 | 32.1 |
| Canada | 30 | 7.2 |
| Russia / USSR | 30 | 2.1 |
| Switzerland | 27 | 29.7 |
| Austria | 25 | 27.1 |
| Netherlands | 22 | 12.2 |
| Italy | 21 | 3.6 |
| Poland | 19 | 5.2 |
| Hungary | 16 | 16.8 |
| Australia | 15 | 5.4 |
| Denmark | 14 | 23.3 |
| Israel | 14 | 13.8 |
| Norway | 14 | 24.9 |
| Belgium | 12 | 10.1 |
| India | 12 | 0.1 |
| Ireland | 11 | 20.1 |
| South Africa | 11 | 1.7 |
| Spain | 8 | 1.6 |
| Ukraine | 7 | 1.8 |
| Belarus | 6 | 6.6 |
| Czechia | 6 | 5.5 |
| Egypt | 6 | 0.5 |
| Taiwan | 6 | 2.6 |
| Argentina | 5 | 1.1 |
| Finland | 5 | 8.9 |
| Romania | 4 | 2.1 |
| China | 3 | 0.0 |
| Iceland | 3 | 76.5 |
| Lithuania | 3 | 10.4 |
| Mexico | 3 | 0.2 |
| New Zealand | 3 | 5.6 |
| South Korea | 3 | 0.6 |
| Turkey | 3 | 0.3 |
| Algeria | 2 | 0.4 |
| Chile | 2 | 1.0 |
| Colombia | 2 | 0.4 |
| Timor-Leste | 2 | 14.1 |
| Greece | 2 | 1.9 |
| Guatemala | 2 | 1.1 |
| Iran | 2 | 0.2 |
| Liberia | 2 | 3.5 |
| Luxembourg | 2 | 29.1 |
| Pakistan | 2 | 0.1 |
| Portugal | 2 | 1.9 |
| Saint Lucia | 2 | 111.0 |
| Tunisia | 2 | 1.6 |
| Venezuela | 2 | 0.7 |
| Azerbaijan | 1 | 1.0 |
| Bangladesh | 1 | 0.1 |
| Brazil | 1 | 0.1 |
| Bulgaria | 1 | 1.6 |
| Costa Rica | 1 | 1.9 |
| Cyprus | 1 | 7.3 |
| DR Congo | 1 | 0.1 |
| Ethiopia | 1 | 0.1 |
| Faroe Islands | 1 | 182.2 |
| Ghana | 1 | 0.3 |
| Hong Kong | 1 | 1.3 |
| Jordan | 1 | 0.9 |
| Kenya | 1 | 0.2 |
| Latvia | 1 | 5.4 |
| Lebanon | 1 | 1.7 |
| Morocco | 1 | 0.3 |
| Myanmar | 1 | 0.2 |
| Nigeria | 1 | 0.0 |
| North Macedonia | 1 | 5.5 |
| Palestine | 1 | 1.9 |
| Peru | 1 | 0.3 |
| Philippines | 1 | 0.1 |
| Saudi Arabia | 1 | 0.3 |
| Tanzania | 1 | 0.1 |
| Tibet | 1 | |
| Trinidad and Tobago | 1 | 7.3 |
| Vietnam | 1 | 0.1 |
| Yemen | 1 | 0.2 |
| Yugoslavia | 1 |
Data and reporting for this article come from the following sources: