The world is getting slightly less hungry, but not everywhere, and not fast enough. The UN’s flagship State of Food Security and Nutrition in the World (SOFI) 2026, published on 21 July, is the freshest hard data on global hunger, and it tells two stories at once.
Hunger fell for a third straight year. Yet the cost of eating well kept rising, and Africa kept getting hungrier. We mapped both sides of the picture: how many people go undernourished, and how many simply cannot afford a healthy diet.
Key Takeaways
- 645 million people were hungry in 2025. That is about 7.8% of humanity, down roughly 14 million from 2024 and 43 million from the 2022 peak, a third consecutive annual decline.
- Africa is the exception, and it is rising. Around 309 million Africans are undernourished, one in five people. Africa's hunger rate climbed to about 20% even as Asia and Latin America fell.
- A healthy diet now costs .28 a day. The average cost of a healthy diet rose to .28 (PPP) per person per day, up from .44 in 2021 and .94 in 2017.
- 2.7 billion cannot afford to eat well. One in three people worldwide cannot afford a healthy diet, including 66.6% of everyone living in Africa.
- 150 million children are stunted. A parallel UN estimate the same week put the number of under-fives too short for their age, a marker of chronic undernutrition, at around 150 million.
645 million hungry, and the number is finally falling
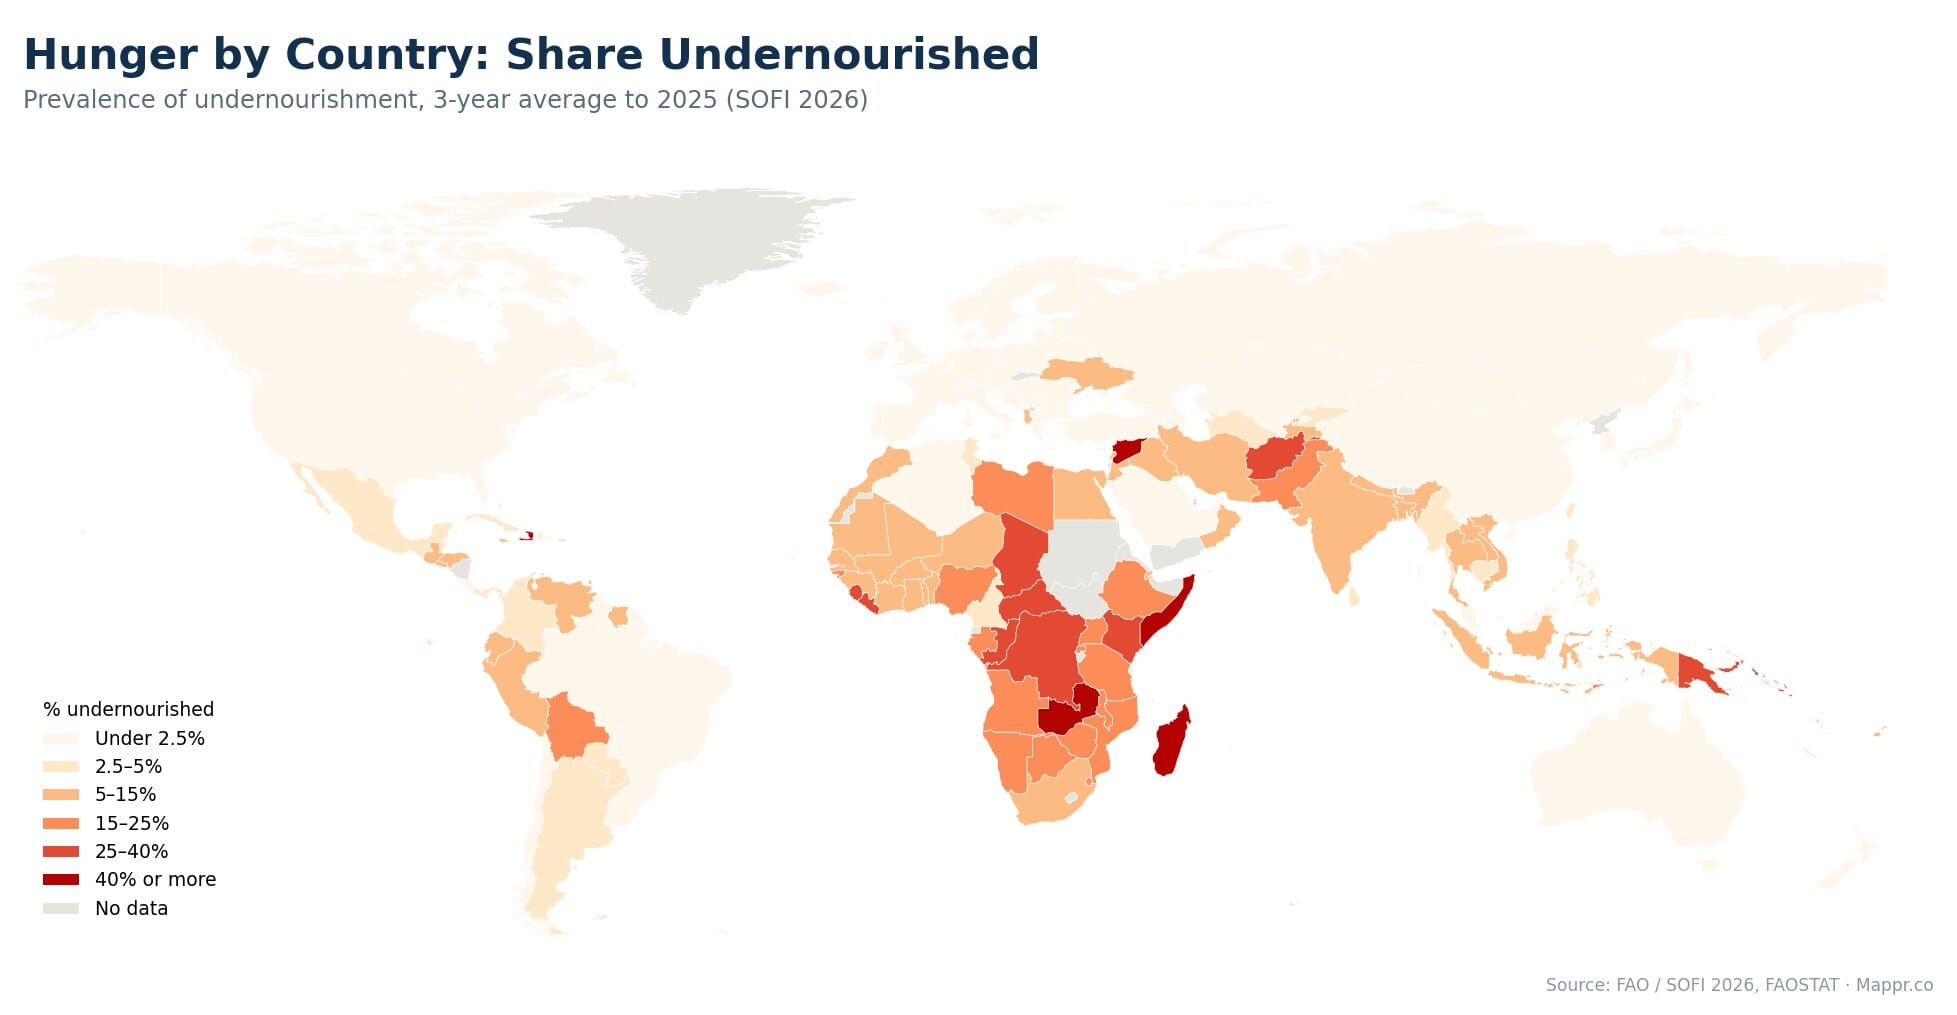
After the pandemic and the food-price shock of 2022 pushed hunger sharply higher, the trend has finally reversed. In 2025, about 645 million people were undernourished, roughly 7.8% of the world. That is around 14 million fewer than in 2024 and 43 million below the 2022 peak.
It is the third year of decline in a row. The gains are real, but they are unevenly shared, and at this pace the world is still far off the target of ending hunger by 2030.
The divergence: Africa rises while the world falls
Almost all of the improvement came from Asia and Latin America. Africa moved the other way. Its undernourishment rate rose from about 18.7% to 20.1%, which means one in five Africans, roughly 309 million people, now go hungry.
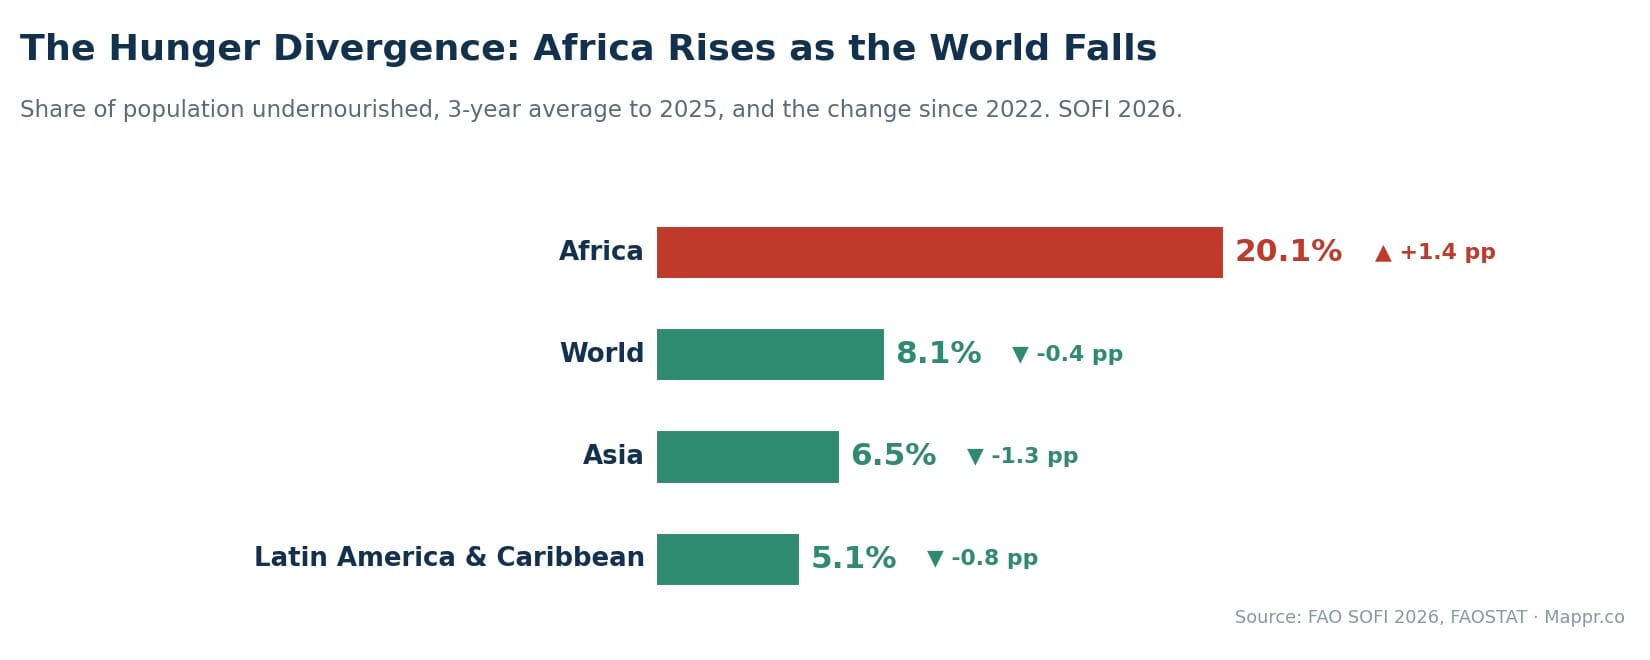
This is the single most important pattern in the report. The global headline is improving, but it is masking a continent moving in the wrong direction, driven by conflict, climate shocks and economic strain.
Hunger is only half the story: who cannot afford to eat well
Undernourishment counts calories. It misses a bigger, quieter problem: people who eat enough to survive but cannot afford the fruit, vegetables, protein and variety that make up a genuinely healthy diet. SOFI measures that too.
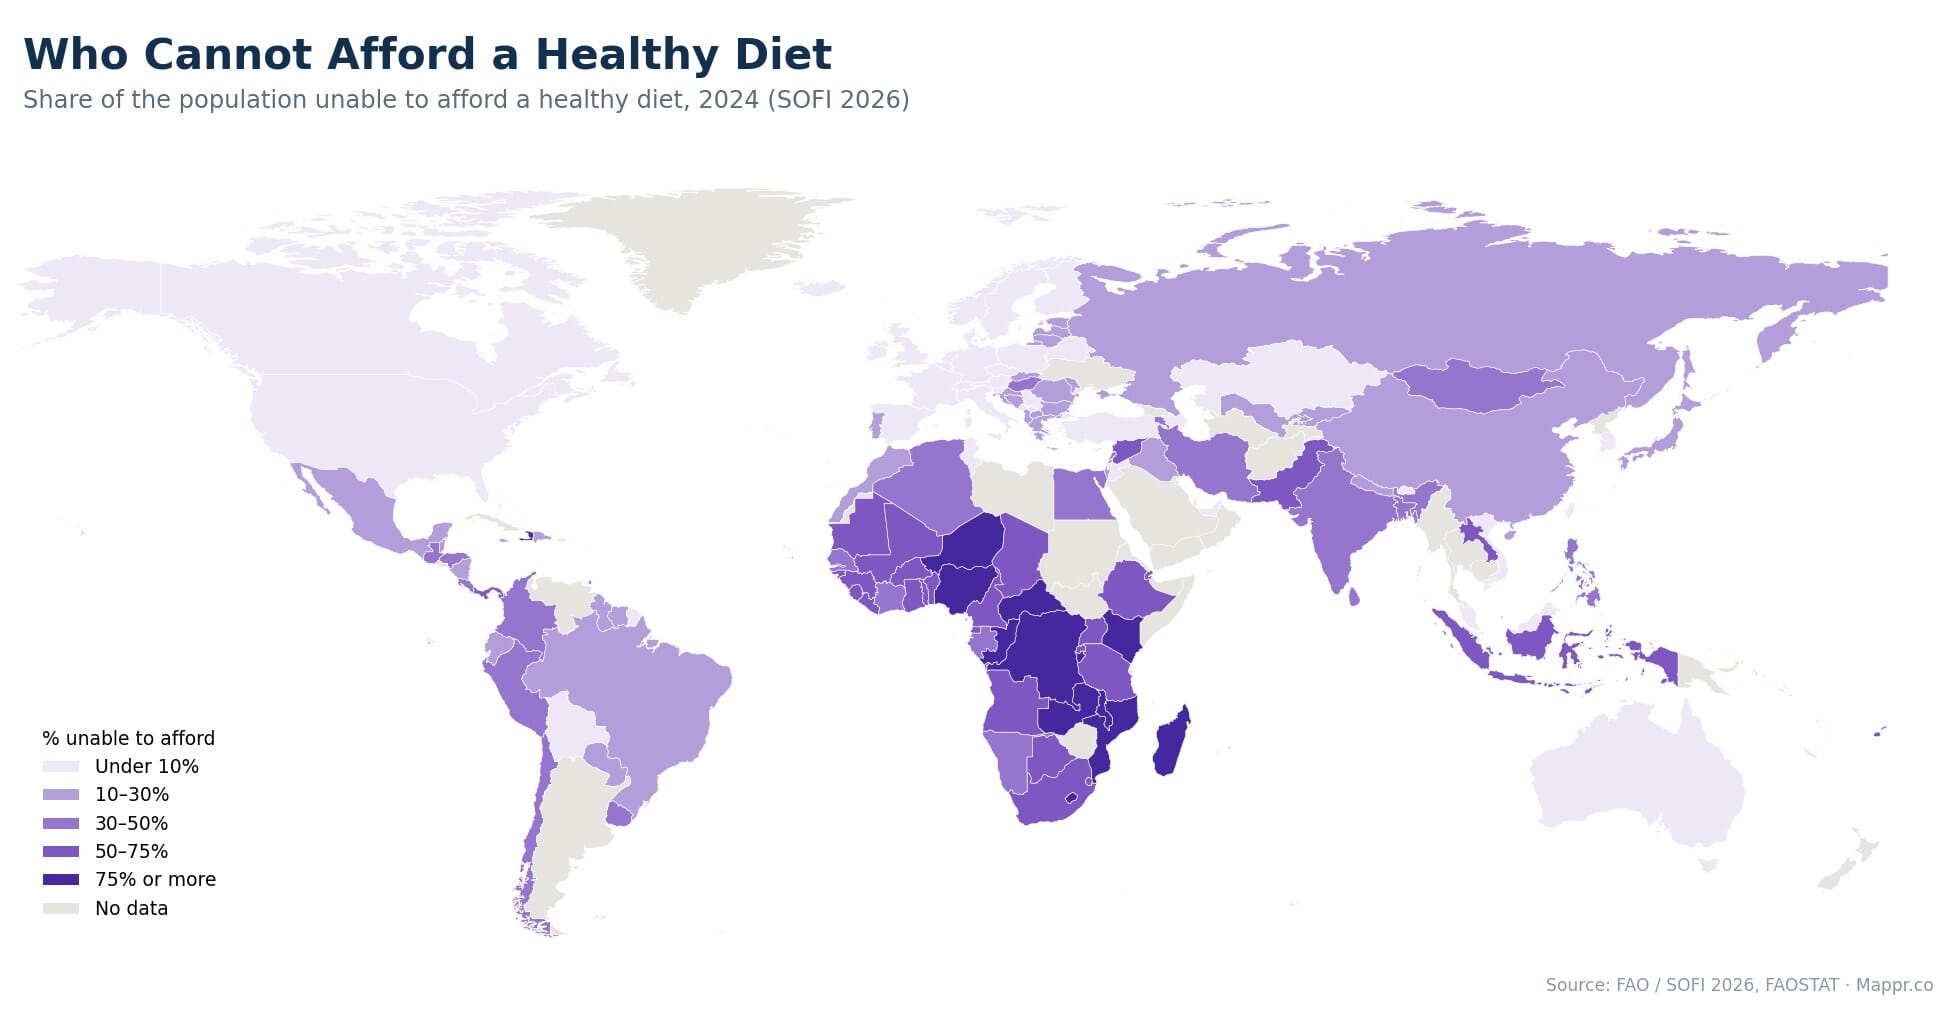
The map is even starker than the hunger map. Across much of sub-Saharan Africa, more than three quarters of people cannot afford a healthy diet. In several countries the figure is above 90%.
The cost of a healthy diet keeps climbing
The reason is affordability, and it is deteriorating even where hunger is easing. The average cost of a healthy diet rose to .28 (in PPP dollars) per person per day in 2024, up from .44 in 2021 and .94 in 2017.
At that price, 2.7 billion people, one in three worldwide, cannot afford to eat healthily. In Africa the share is 66.6%. Rising food prices mean a family can be spending more and still eating worse.
Children pay the highest price
The long-term damage shows up in the young. A parallel UN estimate released the same week put the number of stunted under-fives, children too short for their age because of chronic undernutrition, at around 150 million. Stunting is largely irreversible after the first years of life, and it shapes health, learning and earnings for decades.
Hunger and diet affordability by country
Every country in the SOFI 2026 dataset, ranked by undernourishment, with the share unable to afford a healthy diet, the cost of that diet, and the change in hunger since 2022. Search for a country or sort any column.
| Country | Under- nourished % | Cannot afford % | Diet cost ($/day) | Since 2022 (pp) |
|---|---|---|---|---|
| Somalia | 56.5 | – | – | +4.5 |
| Haiti | 51.4 | 87.9 | 6.19 | +3.9 |
| Madagascar | 41.8 | 85.3 | 3.96 | +1.9 |
| Zambia | 41.0 | 86.3 | 3.98 | +5.3 |
| Syria | 40.8 | 73.5 | 7.62 | +7.1 |
| Congo, The Democratic Republic of the | 39.5 | 90.8 | 2.77 | +4.0 |
| Liberia | 37.3 | 62.1 | 3.56 | -0.9 |
| Kenya | 34.9 | 76.4 | 4.26 | +1.5 |
| Chad | 33.6 | 66.7 | 3.94 | +3.6 |
| Papua New Guinea | 30.5 | – | – | +2.6 |
| Central African Republic | 29.8 | 87.5 | 4.25 | +0.6 |
| Afghanistan | 27.8 | – | – | -3.2 |
| Solomon Islands | 27.0 | – | – | +1.7 |
| Sierra Leone | 25.3 | 63.6 | 3.84 | -1.2 |
| Congo | 25.0 | 78.1 | 4.43 | -0.8 |
| Malawi | 24.5 | 92.1 | 4.69 | +4.1 |
| Gabon | 23.3 | 39.2 | 4.64 | +3.9 |
| Sao Tome and Principe | 23.0 | 49.1 | 4.64 | +7.1 |
| Rwanda | 22.6 | 72.2 | 4.52 | -7.7 |
| Mozambique | 22.3 | 90.7 | 4.14 | -0.4 |
| Nigeria | 22.2 | 81.6 | 4.72 | +4.5 |
| Uganda | 20.9 | 74.4 | 3.65 | -5.6 |
| Namibia | 20.1 | 47.8 | 4.67 | -1.2 |
| Guinea-Bissau | 20.0 | 65.5 | 4.09 | +0.6 |
| Ethiopia | 19.9 | 70.9 | 4.67 | -0.9 |
| Bolivia | 19.5 | 9.5 | 4.82 | +3.0 |
| Tanzania | 19.1 | 73.0 | 3.39 | -3.9 |
| South Sudan | 19.1 | 95.0 | 3.79 | -2.3 |
| Libya | 18.7 | – | – | +3.1 |
| Zimbabwe | 18.4 | – | – | -7.2 |
| Botswana | 18.2 | 59.0 | 4.21 | -1.4 |
| Gambia | 17.5 | 45.0 | 4.38 | -2.8 |
| Angola | 17.4 | 72.2 | 5.0 | -2.3 |
| Timor-Leste | 16.9 | – | – | +1.0 |
| Comoros | 16.5 | 48.5 | 5.24 | +1.1 |
| Pakistan | 16.1 | 64.4 | 3.95 | -0.3 |
| Eswatini | 15.1 | 69.1 | 4.69 | +1.6 |
| Djibouti | 14.7 | 52.2 | 4.75 | +1.0 |
| Honduras | 14.3 | 35.2 | 4.75 | +0.1 |
| Iraq | 13.4 | 27.1 | 4.78 | -0.5 |
| Niger | 12.9 | 86.7 | 4.98 | +1.2 |
| Suriname | 12.7 | 25.6 | 6.16 | +2.3 |
| Guatemala | 12.7 | 48.6 | 5.03 | -1.3 |
| Jordan | 12.2 | 2.3 | 3.37 | -6.5 |
| Mali | 12.1 | 61.4 | 3.86 | +4.8 |
| Burkina Faso | 11.7 | 65.1 | 3.73 | -1.5 |
| Côte d’Ivoire | 11.4 | 48.7 | 3.59 | +1.5 |
| South Africa | 11.2 | 57.6 | 3.89 | +1.6 |
| Benin | 11.1 | 54.1 | 3.39 | -0.8 |
| Lebanon | 11.1 | 45.6 | 6.45 | -0.5 |
| Mauritania | 11.0 | 51.7 | 5.4 | +2.0 |
| Ecuador | 10.8 | 28.7 | 3.56 | -2.8 |
| Ukraine | 10.8 | – | – | +4.4 |
| Trinidad and Tobago | 10.4 | 32.0 | 5.56 | 0.0 |
| Togo | 10.2 | 54.1 | 3.77 | -5.6 |
| Laos | 10.0 | 51.9 | 5.19 | +1.3 |
| India | 9.8 | 40.6 | 4.07 | -4.1 |
| Guinea | 8.7 | 50.4 | 5.1 | +0.5 |
| Egypt | 8.4 | 45.4 | 6.39 | +0.4 |
| Bangladesh | 8.2 | 40.4 | 4.49 | -1.0 |
| Cabo Verde | 8.1 | 51.0 | 3.8 | +0.3 |
| Jamaica | 8.0 | 27.1 | 6.02 | +0.2 |
| Tajikistan | 8.0 | – | – | -2.4 |
| Fiji | 7.2 | 60.5 | 4.75 | +0.7 |
| Oman | 7.1 | – | 3.02 | +1.3 |
| Iran | 6.7 | 35.7 | 4.45 | -0.1 |
| Morocco | 6.5 | 13.1 | 3.54 | 0.0 |
| Ghana | 6.4 | 65.8 | 4.49 | +0.8 |
| Indonesia | 6.3 | 70.6 | 4.84 | -0.4 |
| Vietnam | 6.1 | 7.9 | 4.49 | +0.5 |
| Vanuatu | 5.8 | – | – | -0.6 |
| Peru | 5.7 | 35.8 | 4.34 | -0.8 |
| Albania | 5.6 | 12.6 | 4.99 | -0.2 |
| Thailand | 5.4 | – | – | +0.1 |
| Venezuela | 5.3 | – | – | -7.5 |
| El Salvador | 5.3 | – | – | -1.1 |
| Senegal | 5.3 | 47.4 | 3.73 | -0.2 |
| Nepal | 5.2 | 20.0 | 4.18 | -0.1 |
| Barbados | 5.0 | – | – | +0.6 |
| Cameroon | 4.9 | 55.0 | 4.36 | -1.0 |
| Mauritius | 4.9 | 19.1 | 4.75 | -1.9 |
| Sri Lanka | 4.9 | 36.3 | 5.03 | +0.3 |
| Kyrgyzstan | 4.8 | 24.4 | 3.76 | -2.0 |
| Cambodia | 4.7 | – | 4.62 | -1.4 |
| Panama | 4.7 | 52.3 | 4.32 | -0.4 |
| Myanmar | 4.6 | – | – | +0.4 |
| Belize | 4.4 | 17.7 | 4.54 | -0.2 |
| Colombia | 4.1 | 36.6 | 4.9 | 0.0 |
| Turkmenistan | 4.1 | – | – | +0.4 |
| New Caledonia | 4.1 | – | – | -0.9 |
| Paraguay | 4.1 | 23.2 | 5.04 | +0.3 |
| Saint Vincent and the Grenadines | 4.0 | – | 6.43 | -1.2 |
| Kiribati | 3.8 | – | – | -0.9 |
| Taiwan | 3.6 | 4.3 | 5.35 | -0.1 |
| Cuba | 3.5 | – | – | +1.1 |
| Samoa | 3.4 | – | – | -0.3 |
| Philippines | 3.4 | 47.4 | 4.39 | -1.4 |
| Mexico | 3.1 | 20.1 | 4.42 | -0.1 |
| Dominica | 3.0 | – | 6.45 | -1.1 |
| Tunisia | 2.8 | 8.7 | 5.02 | -0.3 |
| Argentina | 2.8 | – | – | -0.5 |
| French Polynesia | 2.6 | – | – | +0.2 |