Key Takeaways
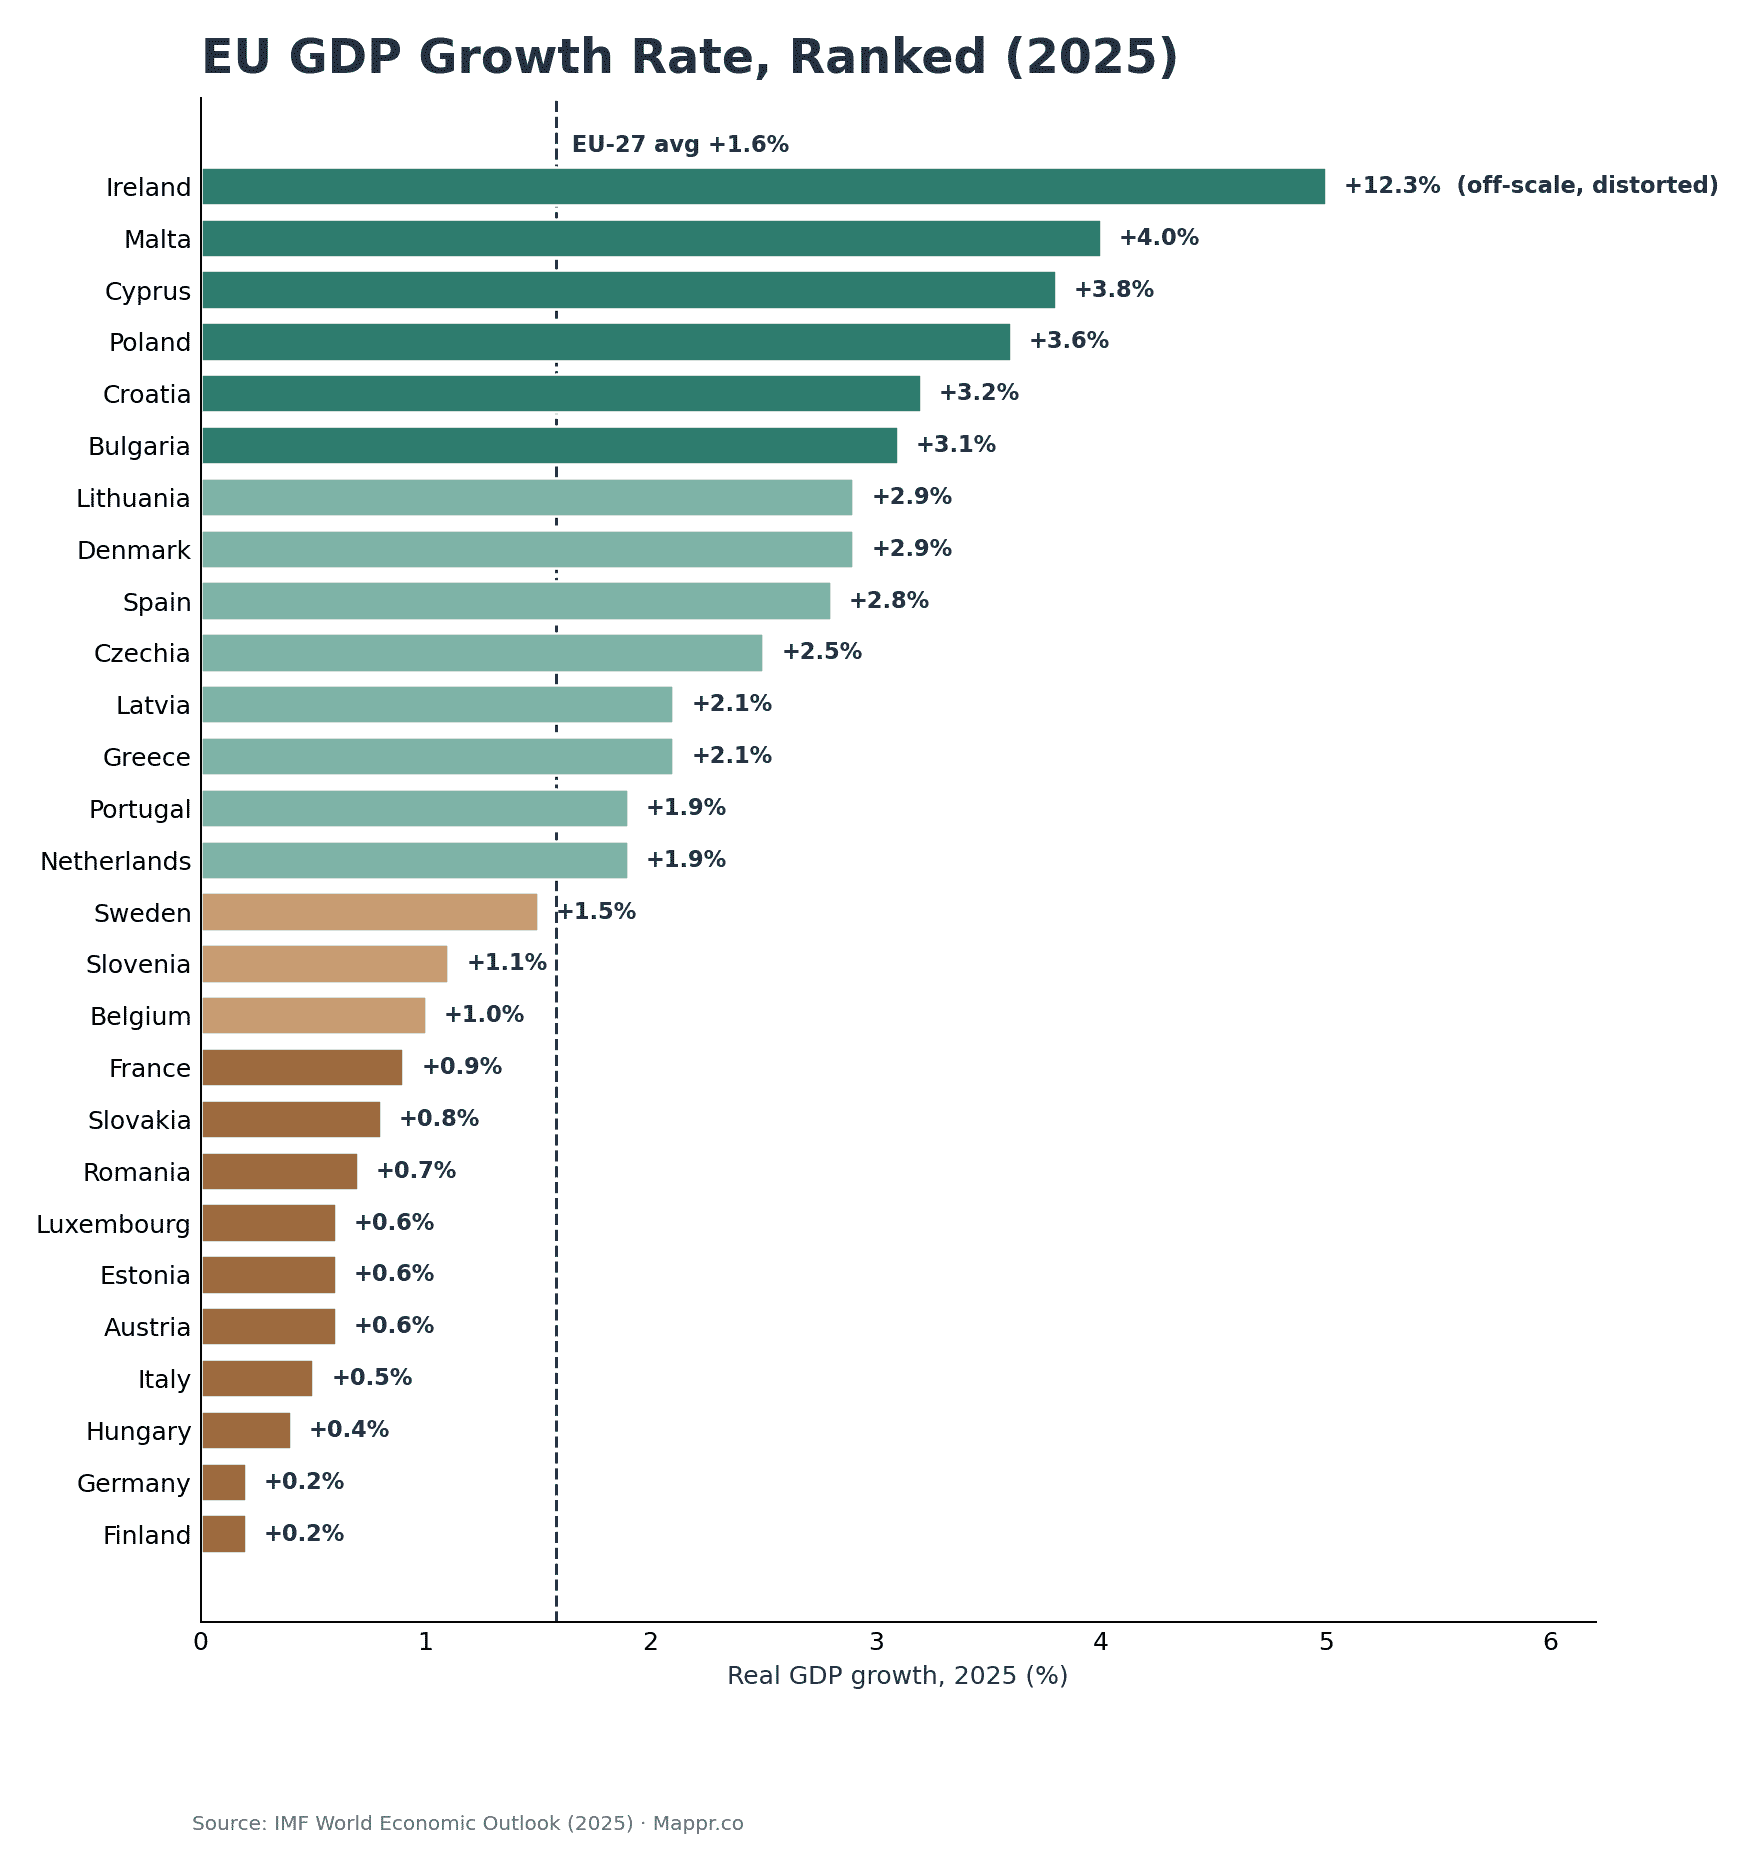
- Periphery outpaces the core. Eastern and Southern members lead 2025 growth — Malta +4.0%, Cyprus +3.8%, Poland +3.6%, Croatia +3.2% — while Germany (+0.2%) and Finland (+0.2%) barely move.
- EU-27 averages just +1.6%. Weighted real GDP growth is a modest +1.6% (about +1.2% excluding Ireland), on a $21.2 trillion combined economy.
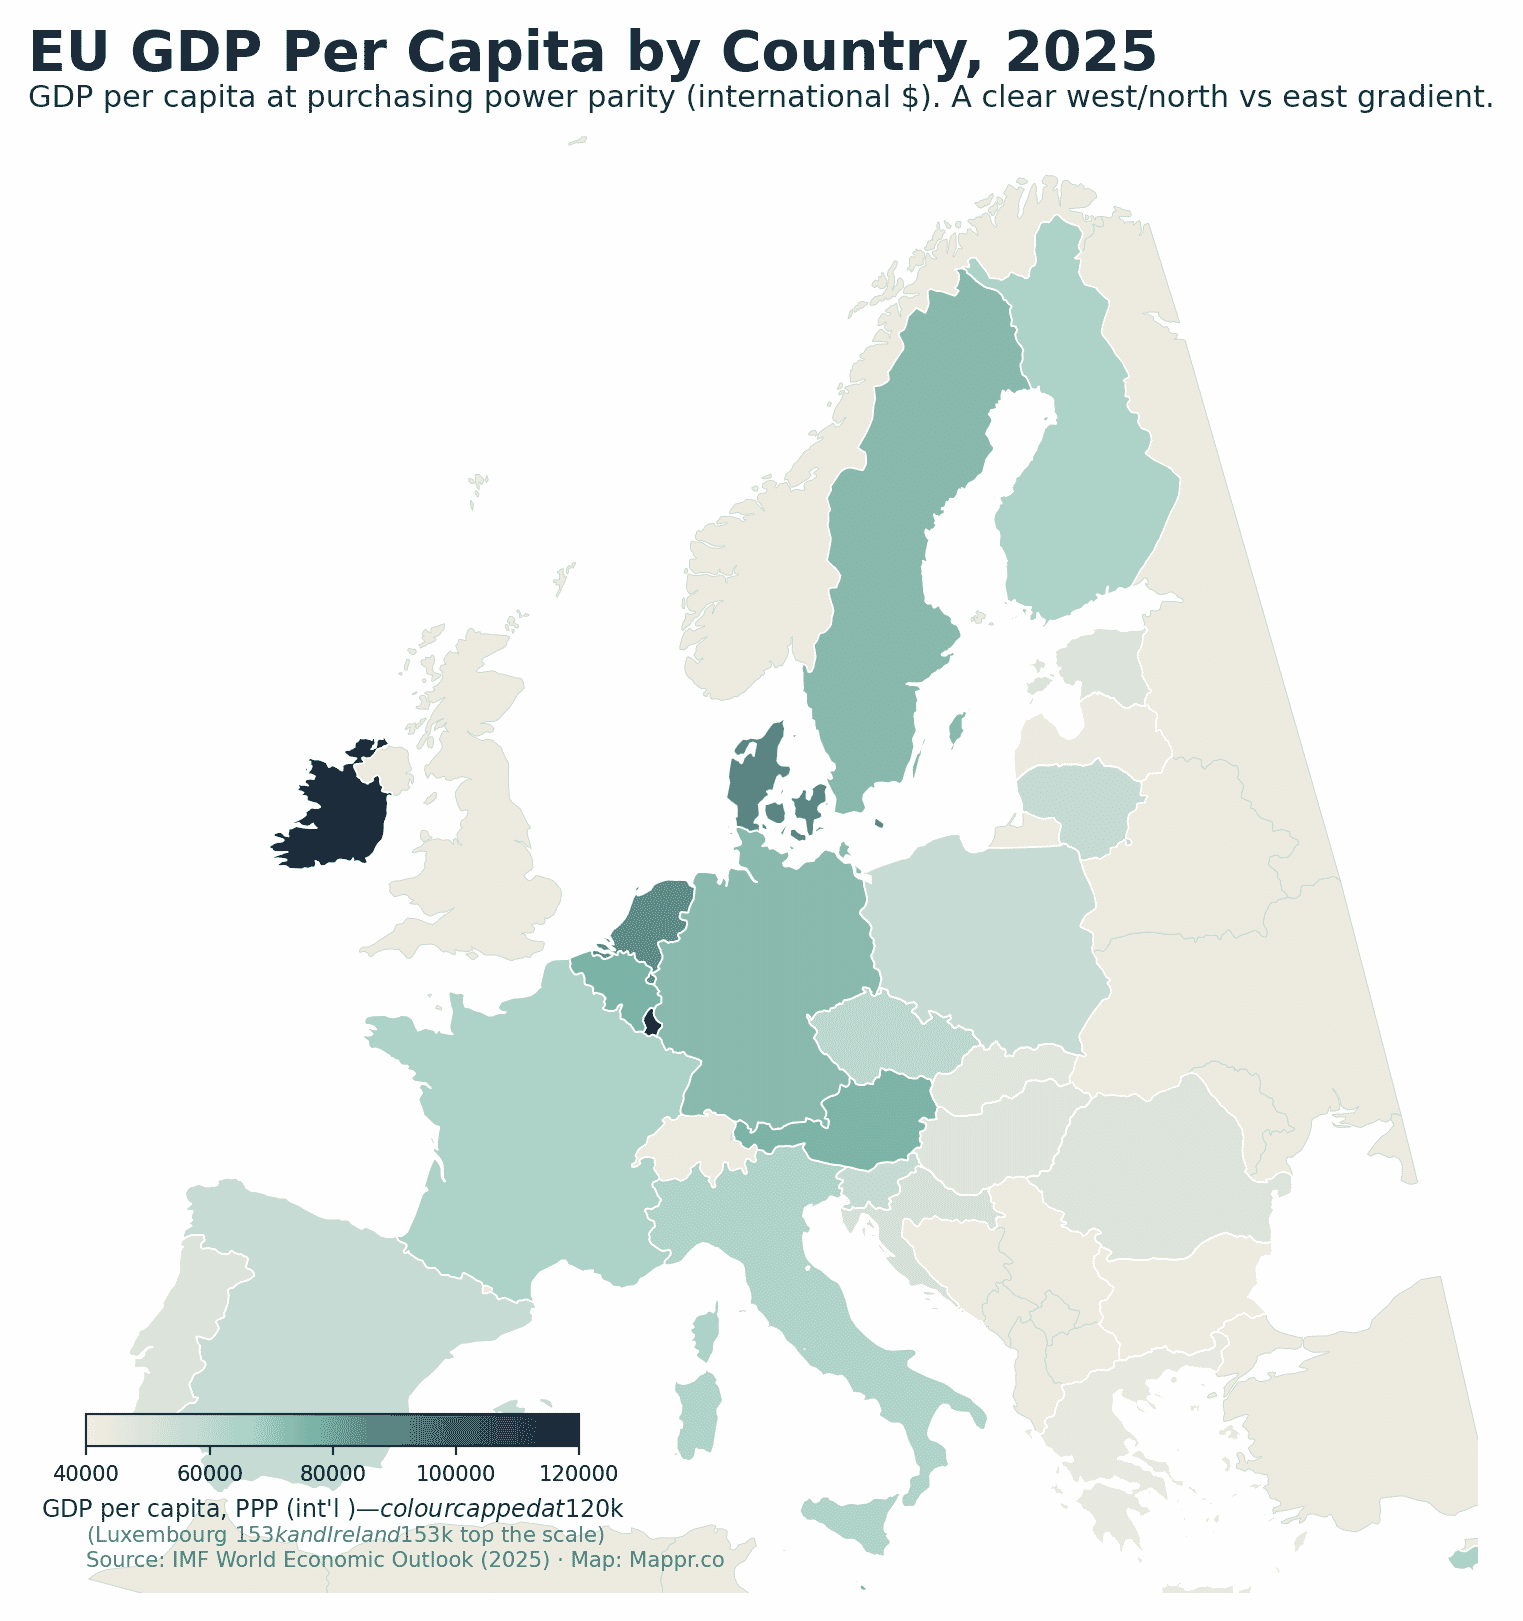
- Income gap is wide. GDP per capita (PPP) ranges from Bulgaria ≈$43k to Luxembourg ≈$153k — a 3.5x spread inside one single market.
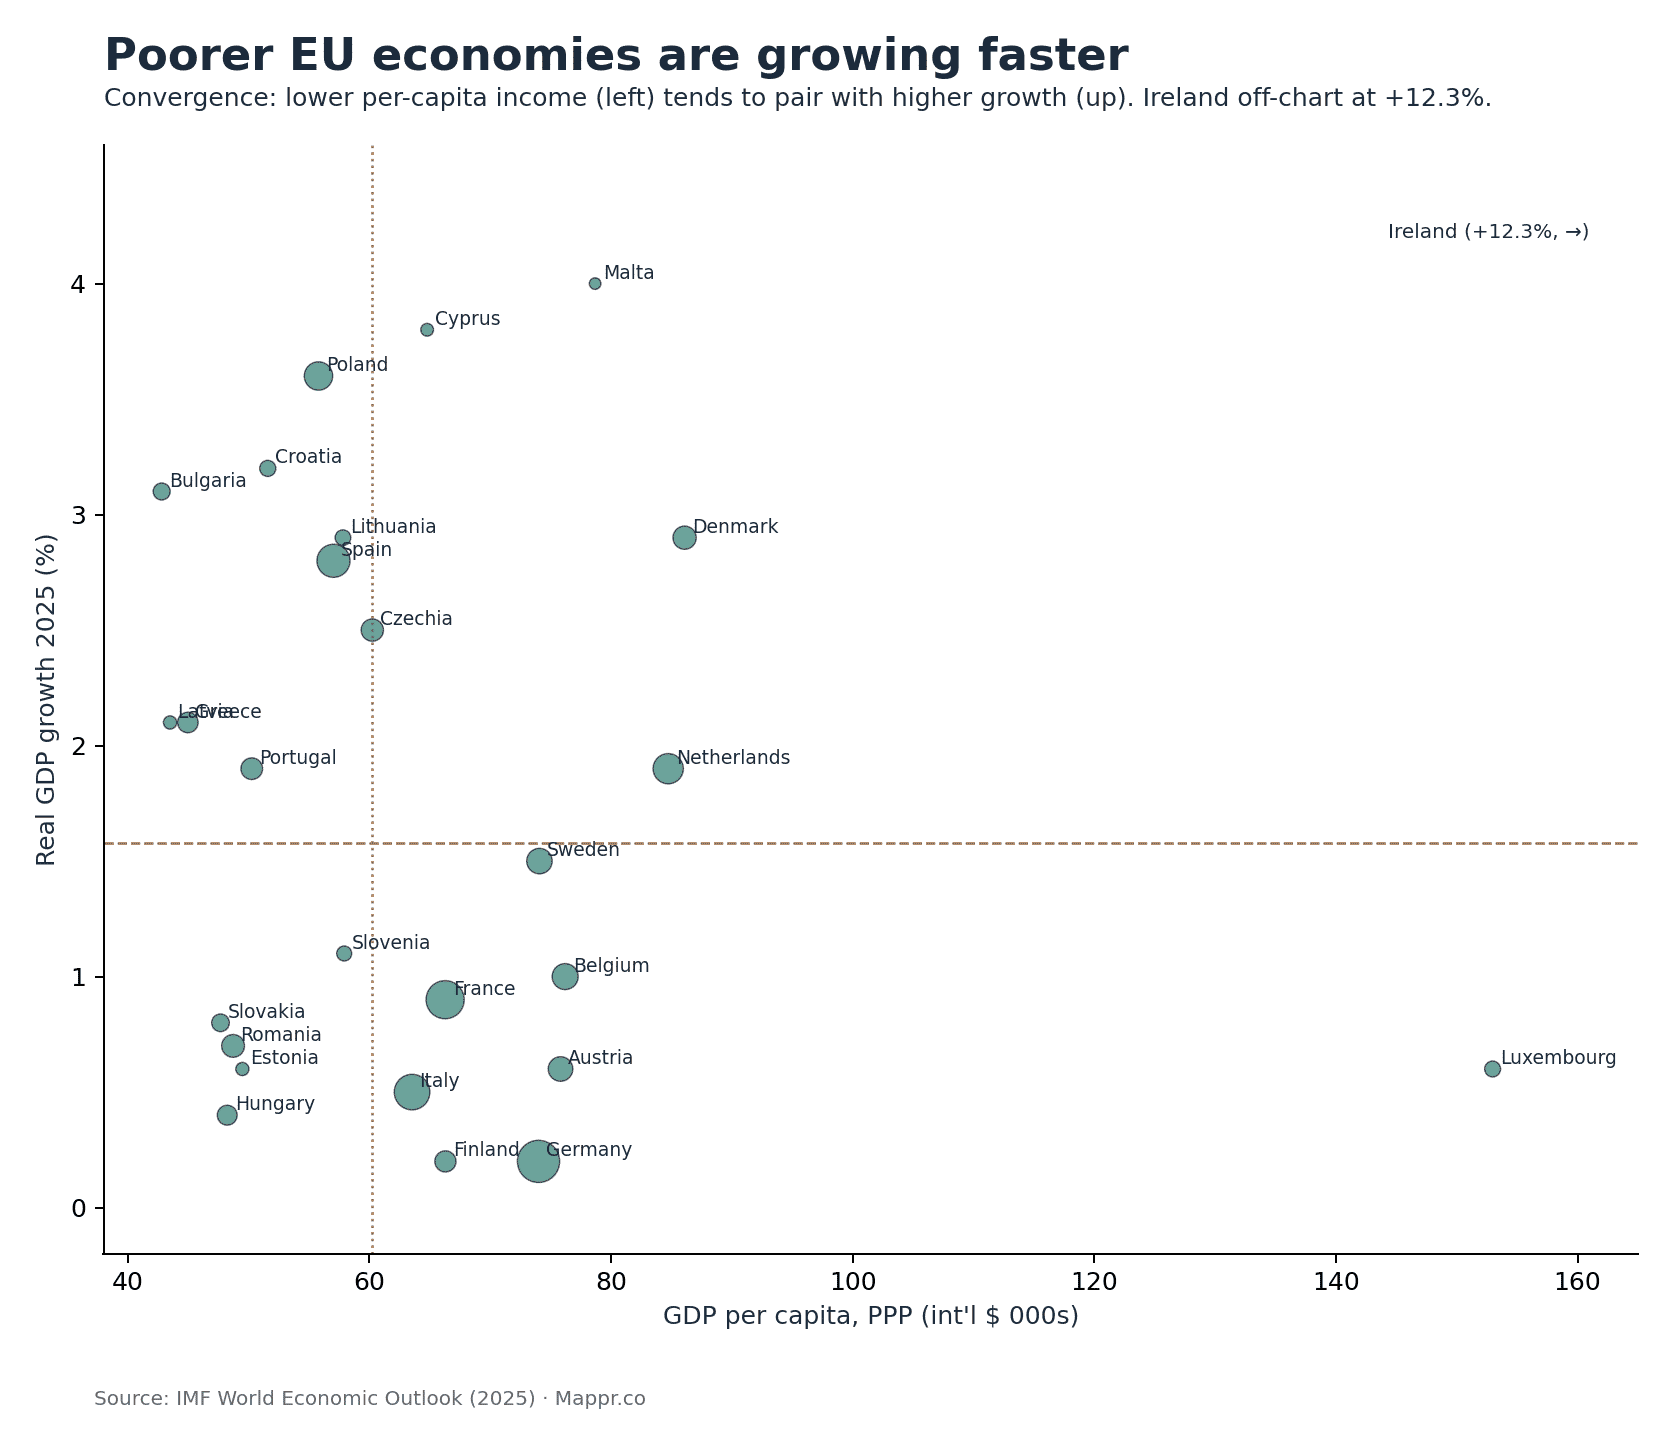
- Convergence is real. Lower-income members tend to grow faster, slowly narrowing the gap with the wealthy north and west.
- Ireland is an outlier. Ireland’s +12.3% growth and ~$153k per capita are distorted by multinational tax accounting, not everyday living standards.
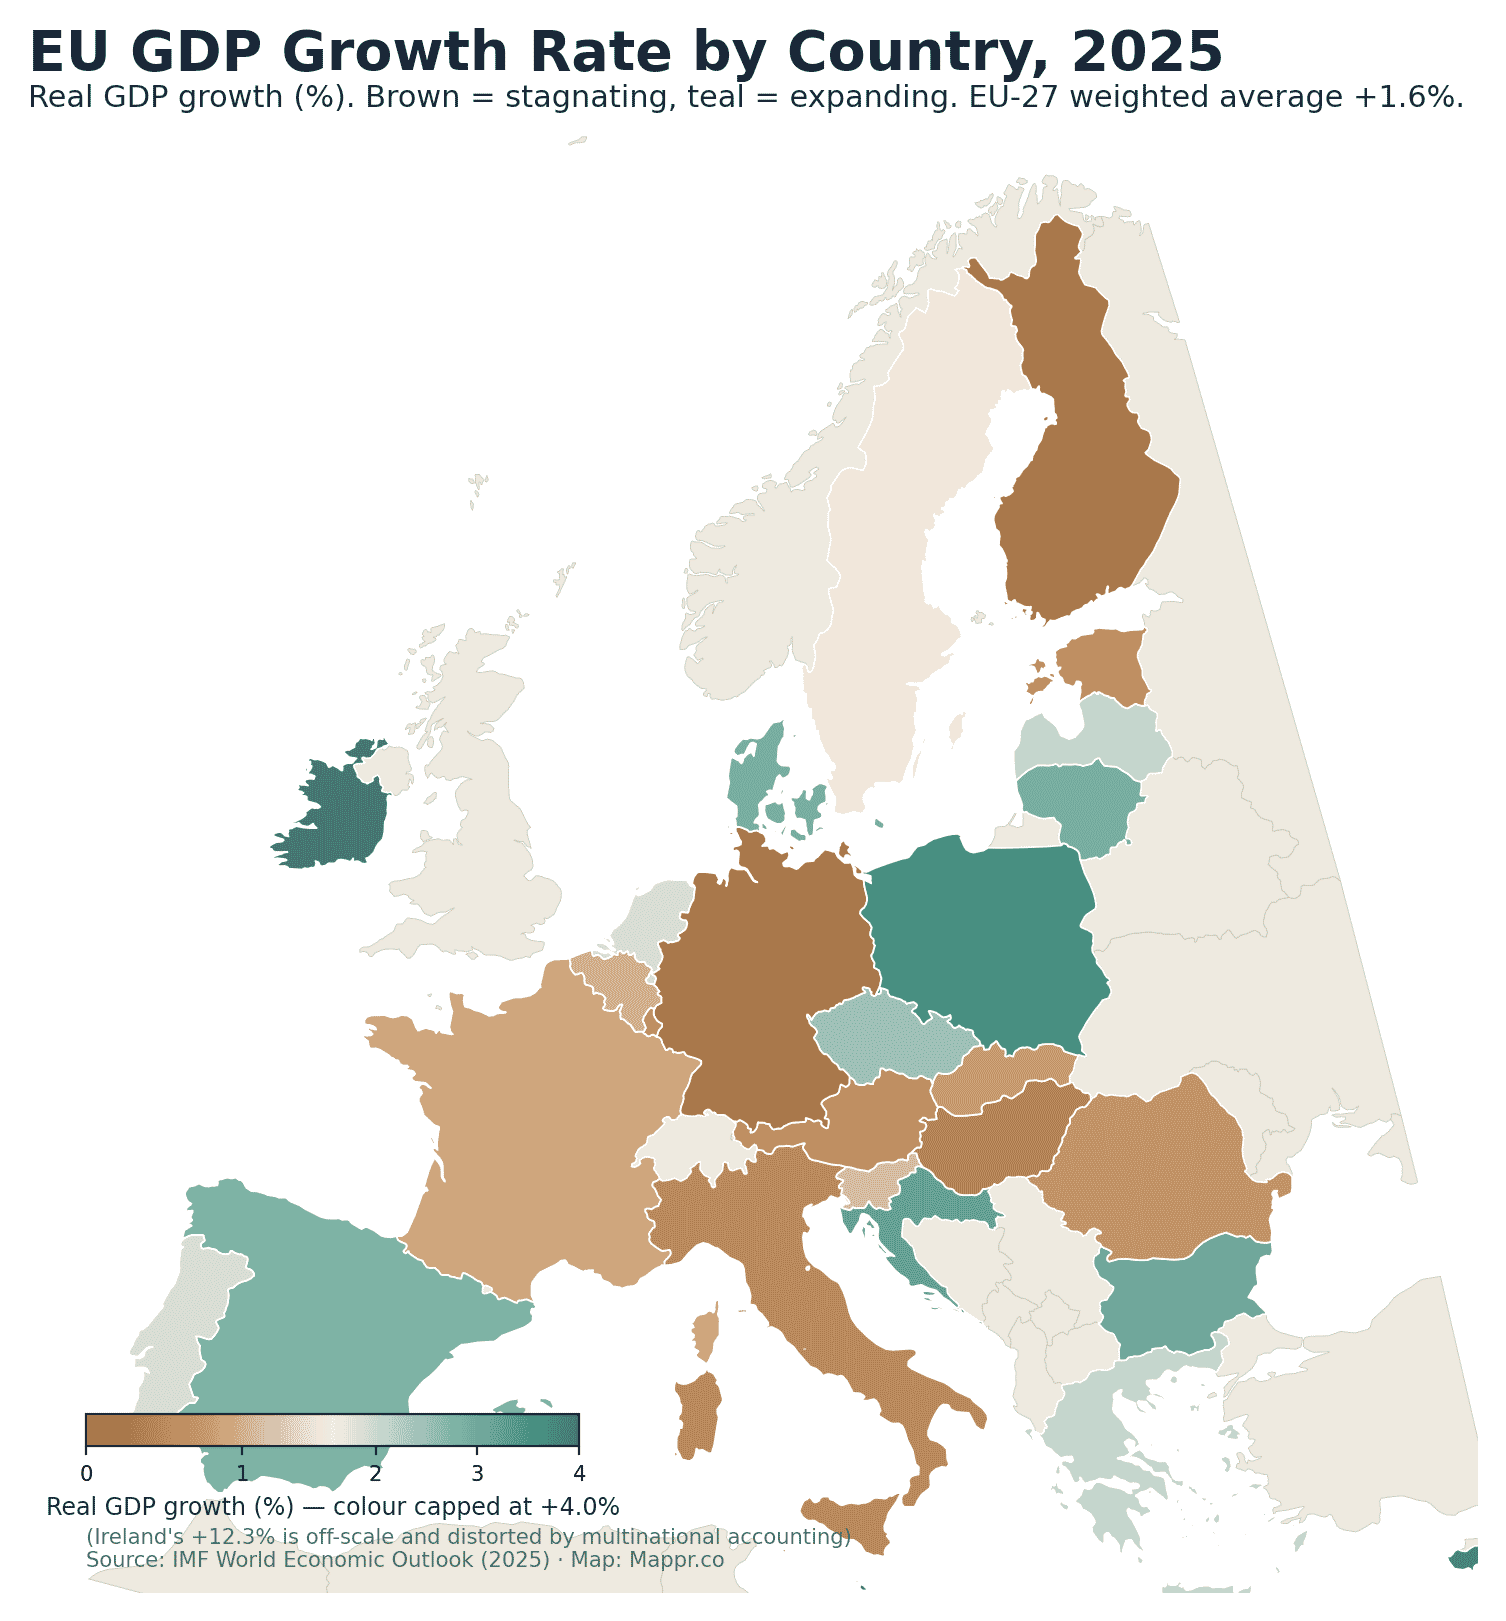
The European Union is a single market of 27 countries and roughly $21.2 trillion in combined output — but the pace of growth and the level of income inside it vary enormously. In 2025 the EU economy is set to expand by about +1.6%, yet that average hides a sharp split: fast-catching-up economies in the east and south against a near-stagnant industrial core. The two maps below show where the EU is growing and how rich each member actually is.
EU GDP growth rate by country (2025)
The growth map splits Europe in two. The periphery is booming: Malta (+4.0%), Cyprus (+3.8%), Poland (+3.6%), Croatia (+3.2%) and Bulgaria (+3.1%) lead the bloc, powered by EU cohesion funds, catch-up investment and resilient domestic demand. The industrial core has stalled — Germany and Finland are flat at +0.2%, with Hungary (+0.4%), Italy (+0.5%) and Austria (+0.6%) close behind. France manages just +0.9%. Ireland’s headline +12.3% is real on paper but driven by the accounts of multinationals based there, so it sits off the colour scale.
Ranked side by side, the spread is stark — from Germany’s +0.2% to Malta’s +4.0% among the larger economies, a twentyfold difference in pace.
EU GDP per capita: how rich is each member?
Income tells the opposite story. The wealthiest members cluster in the north and west — Luxembourg (≈$153k PPP), Denmark, the Netherlands, Austria, Germany, Belgium and Sweden all sit above $74,000 per person. The east and southeast remains poorer: Bulgaria (≈$43k), Greece, Latvia and Hungary anchor the bottom. Even at purchasing-power parity, which adjusts for local prices, the richest member is roughly 3.5 times wealthier per head than the poorest.
Are the poorer EU economies catching up?
Plotting income against growth shows the convergence the EU is designed to produce: lower-income members on the left tend to grow faster (higher up), while the wealthy, mature economies on the right — Germany, France, Italy — grow slowly. It is uneven and slow, but the gap between Europe’s rich and poor regions is gradually narrowing.
What these numbers mean
The table uses four standard economic measures. Here is what each one actually tells you — and one thing to keep in mind: every “per capita” figure here is gross output per person, not take-home pay. GDP counts everything an economy produces (including company profits, taxes and investment), so it runs well above what the average person earns or keeps after tax.
The four measures, explained
- Real GDP growth. How much more (or less) an economy produced this year versus last, after stripping out inflation. "Real" means price rises are removed, so +2% reflects genuinely higher output of goods and services — not just higher prices.
- GDP per capita (PPP). Total economic output divided by population, then adjusted for local prices via purchasing power parity. PPP answers "what can the average person actually buy at home?" and makes living standards comparable between cheap and expensive countries. It is gross output per head, not net income.
- GDP per capita (nominal). The same output-per-person figure, but converted at market exchange rates with no price adjustment. It reflects buying power on world markets (for imports, travel, etc.), and tends to make high-cost countries look richer and low-cost ones poorer than the PPP measure does.
- Nominal GDP. The total size of the whole economy in current US dollars at market exchange rates — the headline "how big is this economy" number. This one is the country total, not per person.
- PPP vs nominal, in one line. Nominal compares economies at today’s exchange rates; PPP compares what money actually buys locally. PPP is the better gauge of living standards; nominal is the better gauge of weight in the global economy.
EU GDP growth and income: full country table
All 27 member states, ranked by 2025 real GDP growth, with GDP per capita at both purchasing-power parity and nominal exchange rates, plus total nominal GDP.
| # | Country | Real GDP growth (2025) | GDP per capita (PPP) | GDP per capita (nominal) | Nominal GDP |
|---|---|---|---|---|---|
| 1 | 🇮🇪 Ireland * | +12.3% | $152,632 | $130,652 | $718B |
| 2 | 🇲🇹 Malta | +4.0% | $78,689 | $49,297 | $28B |
| 3 | 🇨🇾 Cyprus | +3.8% | $64,785 | $41,730 | $41B |
| 4 | 🇵🇱 Poland | +3.6% | $55,793 | $28,374 | $1,036B |
| 5 | 🇭🇷 Croatia | +3.2% | $51,593 | $27,376 | $106B |
| 6 | 🇧🇬 Bulgaria | +3.1% | $42,816 | $20,921 | $131B |
| 7 | 🇩🇰 Denmark | +2.9% | $86,094 | $77,046 | $462B |
| 8 | 🇱🇹 Lithuania | +2.9% | $57,818 | $32,839 | $95B |
| 9 | 🇪🇸 Spain | +2.8% | $57,034 | $38,290 | $1,904B |
| 10 | 🇨🇿 Czechia | +2.5% | $60,247 | $35,678 | $389B |
| 11 | 🇬🇷 Greece | +2.1% | $44,981 | $27,041 | $280B |
| 12 | 🇱🇻 Latvia | +2.1% | $43,509 | $26,116 | $49B |
| 13 | 🇳🇱 Netherlands | +1.9% | $84,738 | $73,833 | $1,332B |
| 14 | 🇵🇹 Portugal | +1.9% | $50,269 | $32,166 | $346B |
| 15 | 🇸🇪 Sweden | +1.5% | $74,081 | $62,662 | $669B |
| 16 | 🇸🇮 Slovenia | +1.1% | $57,922 | $37,357 | $80B |
| 17 | 🇧🇪 Belgium | +1.0% | $76,208 | $61,002 | $725B |
| 18 | 🇫🇷 France | +0.9% | $66,276 | $48,930 | $3,369B |
| 19 | 🇸🇰 Slovakia | +0.8% | $47,684 | $28,498 | $154B |
| 20 | 🇷🇴 Romania | +0.7% | $48,724 | $22,725 | $428B |
| 21 | 🇦🇹 Austria | +0.6% | $75,825 | $63,161 | $580B |
| 22 | 🇪🇪 Estonia | +0.6% | $49,492 | $34,325 | $47B |
| 23 | 🇱🇺 Luxembourg | +0.6% | $152,966 | $148,247 | $101B |
| 24 | 🇮🇹 Italy | +0.5% | $63,538 | $43,270 | $2,550B |
| 25 | 🇭🇺 Hungary | +0.4% | $48,239 | $25,826 | $247B |
| 26 | 🇫🇮 Finland | +0.2% | $66,297 | $56,464 | $317B |
| 27 | 🇩🇪 Germany | +0.2% | $74,004 | $60,439 | $5,048B |
The bottom line
The EU’s economic map in 2025 is one of two speeds: a dynamic, catching-up periphery and a wealthy but sluggish core. Growth is strongest where incomes are lowest, which is gradually pulling the bloc together — but with Germany and the eurozone’s largest economies barely growing, the EU’s overall pace remains modest. Income convergence, not headline growth, is the story to watch.