Click on a state below or select from dropdown to read the election prediction.
U.S. Presidential Election Prediction: A State-by-State Breakdown
With the 2024 U.S. Presidential Election approaching, attention turns to the Electoral College map, which will ultimately decide the next President. The Electoral College consists of 538 total votes, and a candidate needs at least 270 votes to secure a win. Based on current data, let’s take a closer look at the electoral landscape, analyzing both solid and swing states.
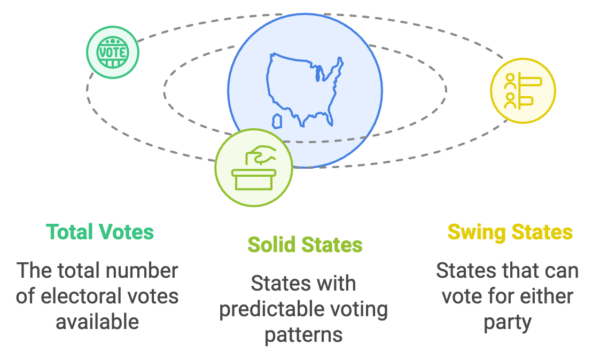
Understanding the U.S. Electoral Voting System: Total Votes represent the 538 available electoral votes, Solid States have predictable voting patterns, and Swing States can vote for either party, often deciding the outcome of the election.
Democratic States (252 Votes)
Democratic-leaning states form a solid foundation for the party’s electoral strategy. These states, where the Democratic candidate is expected to win comfortably, include large vote-rich states like California and New York, contributing significantly to the Democratic total.
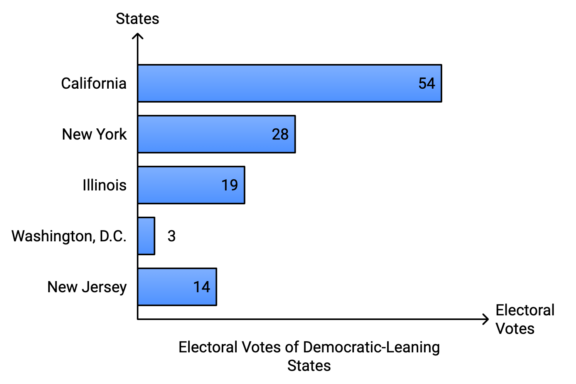
- California (54 votes)
- New York (28 votes)
- Illinois (19 votes)
- Washington, D.C. (3 votes)
- New Jersey (14 votes)
These strongholds give Democrats a robust 118 votes.
Swing States (Close Calls)
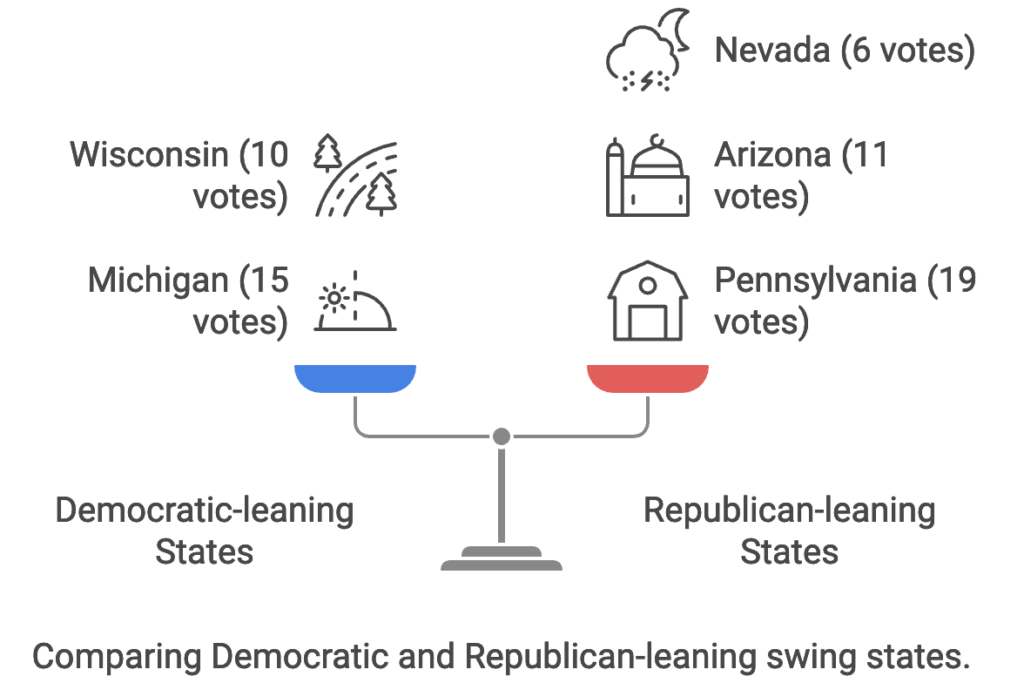
A visual comparison of Democratic-leaning and Republican-leaning swing states with their respective electoral votes in the U.S.
Swing states, or battleground states, are crucial in every election, as their outcomes are harder to predict. These states often decide the election and are typically the focus of intense campaigning by both parties.
Key Democratic-leaning swing states:
- Michigan (15 votes)
- Wisconsin (10 votes)
Key Republican-leaning swing states:
- Pennsylvania (19 votes) [Was Democratic, but as of 28 October 2024 a toss-up, with Trump holding a slight lead]
- Arizona (11 votes) [Was Democratic, but as of 2nd November 2024 leaning Republican by about 1%]
- Nevada (6 votes) [Was Democratic, but as of 28 October 2024 a toss-up, with Trump holding a slight lead]
- Georgia (16 votes)
- North Carolina (16 votes)
Republican States (286 Votes)
On the Republican side, states traditionally leaning conservative provide a strong base of 110 votes. As of 28 October 2024, Republicans are expected to secure the required 270 electoral votes.
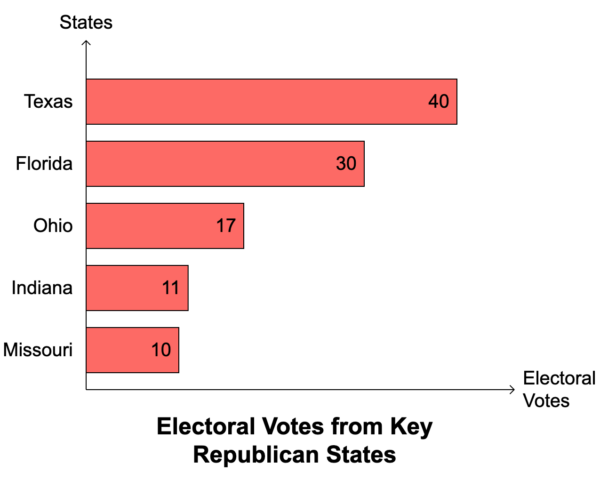
Key Republican states:
- Texas (40 votes)
- Florida (30 votes)
- Ohio (17 votes)
- Indiana (11 votes)
- Missouri (10 votes)
Split Vote States
In most states, the “winner-takes-all” rule applies, meaning the candidate with the majority of votes gets all the electoral votes. However, a few states—namely Maine and Nebraska—use a split-vote system, where electoral votes can be divided between candidates.
- Maine (4 votes): Expected to lean Democratic, though votes are allocated based on congressional districts.
- Nebraska (5 votes): Nebraska splits its votes, with 4 likely going to Republicans and 1 to Democrats.
Current Prediction
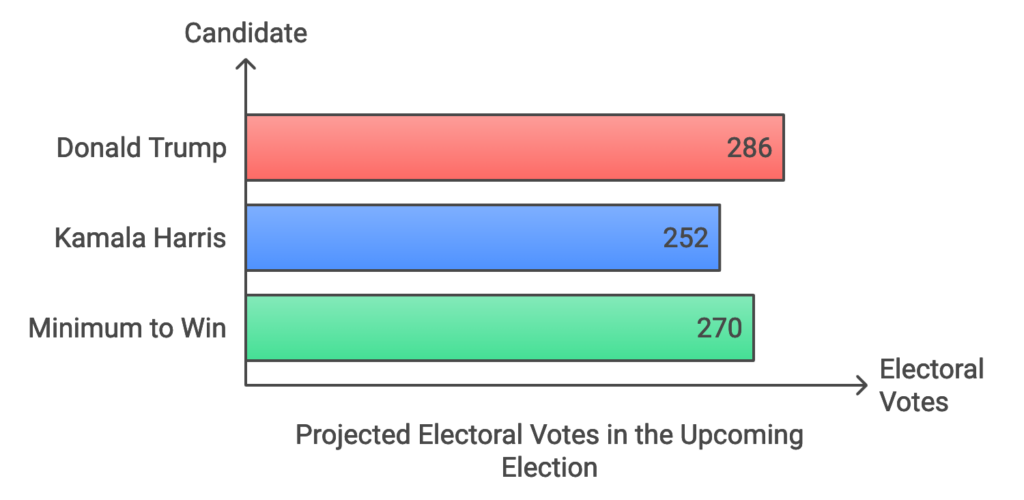
Based on current polling and historical trends, Trump appears to be in a strong position to win with 286 electoral votes, while Kamala Harris is projected to fall short at 252 votes.
However, with several swing states still up for grabs, the race is far from over. Both parties will need to keep focusing on swing states like Arizona, Pennsylvania, Nevada, and Georgia to solidify their path to victory.
- Total Electoral votes: 538
- Minimum electoral votes to win: 270
- 252 Democrats
- 286 Republicans (enough to win)
| State | Rep./Dem. | Electoral Votes |
|---|---|---|
| Alabama | Republican | 9 |
| Alaska | Republican | 3 |
| Arizona | Republican* | 11 |
| Arkansas | Republican | 6 |
| California | Democratic | 54 |
| Colorado | Democratic | 10 |
| Connecticut | Democratic | 7 |
| Delaware | Democratic | 3 |
| Washington D.C.** | Democratic | 3 |
| Florida | Republican | 30 |
| Georgia | Republican* | 16 |
| Hawaii | Democratic | 4 |
| Idaho | Republican | 4 |
| Illinois | Democratic | 19 |
| Indiana | Republican | 11 |
| Iowa | Republican | 6 |
| Kansas | Republican | 6 |
| Kentucky | Republican | 8 |
| Louisiana | Republican | 8 |
| Maine** | Democratic | 4 |
| Maryland | Democratic | 10 |
| Massachusetts | Democratic | 11 |
| Michigan | Democratic* | 15 |
| Minnesota | Democratic | 10 |
| Mississippi | Republican | 6 |
| Missouri | Republican | 10 |
| Montana | Republican | 4 |
| Nebraska** | Rep 4 / Dem 1 | 5 |
| Nevada | Republican* | 6 |
| New Hampshire | Democratic | 4 |
| New Jersey | Democratic | 14 |
| New Mexico | Democratic | 5 |
| New York | Democratic | 28 |
| North Carolina | Republican* | 16 |
| North Dakota | Republican | 3 |
| Ohio | Republican | 17 |
| Oklahoma | Republican | 7 |
| Oregon | Democratic | 8 |
| Pennsylvania | Republican* | 19 |
| Rhode Island | Democratic | 4 |
| South Carolina | Republican | 9 |
| South Dakota | Republican | 3 |
| Tennessee | Republican | 11 |
| Texas | Republican | 40 |
| Utah | Republican | 6 |
| Vermont | Democratic | 3 |
| Virginia | Democratic | 13 |
| Washington | Democratic | 12 |
| West Virginia | Republican | 4 |
| Wisconsin | Democratic* | 10 |
| Wyoming | Republican | 3 |
*Swing States (Close Call)
**Split Vote States (Most states follow a “winner-takes-all” system, except for 3 split vote states)
This table shows the current political alignment of each U.S. state (Republican or Democratic) based on electoral votes, including Washington, D.C. Each state is color-coded—red for Republican and blue for Democratic. The total number of electoral votes per state is displayed, indicating its significance in the U.S. Presidential Election.
Past Prediction (8th October 2024)
Click on a state below or select from dropdown to read the election prediction.
U.S. 2024 Presidential Election Prediction by Mappr Team
The Mappr team’s analysis of the 2024 U.S. presidential election projects a significant lead for the Democratic candidate in terms of electoral votes. According to the updated prediction, the Democratic candidate is expected to win 30 states and Washington, D.C., securing a total of 357 electoral votes, while the Republican candidate is projected to win 21 states, amounting to 181 electoral votes. This projection exceeds the 270 electoral votes needed to win the presidency, indicating a decisive victory for the Democratic candidate if current trends continue.
Likelihood of the Predicted Outcome
This projection suggests a commanding position for the Democratic candidate, particularly with several key swing states expected to lean blue. For instance:
- Arizona, Georgia, and Wisconsin, all crucial battleground states, are projected to remain in the Democratic column, echoing the results of the 2020 election.
- Traditionally Democratic states like California, New York, and Illinois continue to contribute large numbers of electoral votes.
On the Republican side, the candidate is expected to retain most of the traditionally red states, including major strongholds like Texas and Florida.
Factors That Could Shift the Outcome in Favor of Republicans
For Republicans to overcome this projected deficit, several factors could play a pivotal role:
- Regaining Swing States: Republicans would need to flip key swing states like Arizona, Georgia, and Pennsylvania, which narrowly went blue in 2020. This would require strong campaigns focused on attracting suburban and rural voters.
- Economic and Social Issues: Focusing on rising inflation, economic recovery, and addressing cultural issues may resonate with undecided or independent voters, potentially changing the political landscape in battleground states.
- Voter Turnout: High Republican turnout, especially in rural areas and among their core base, could make the race more competitive in both swing and traditionally blue states like Nevada and Michigan.
Conclusion
While the Mappr team’s current prediction suggests a solid advantage for the Democratic candidate, the outcome is not set in stone. Swing states will remain the key battlegrounds, and voter turnout, campaign strategies, and significant political developments in the coming months could all influence the final result.