Live Earthquake Map — Real-Time Global Seismic Activity
Our Live Earthquake Map tracks seismic events across the globe in real time, pulling data directly from the United States Geological Survey (USGS). Whether you’re monitoring tectonic activity for research, checking conditions before traveling to a seismically active region, or simply curious about where the Earth is shaking right now, this interactive tool gives you an immediate, visual overview of current earthquake activity worldwide.
The map below displays earthquakes recorded over the past 7 days, color-coded by magnitude and clustered for clarity. Zoom into any region, click individual markers for details including magnitude, depth, and precise coordinates, and filter by minimum magnitude to focus on the events that matter most. Data refreshes automatically every 5 minutes, so you’re always looking at the latest seismic picture. For context on how current activity compares to historical extremes, see our list of the 20 most powerful earthquakes in recorded history.
Earthquakes happen far more often than most people realize. The USGS detects about 55 earthquakes per day worldwide — more than 20,000 per year. While the vast majority are too small to feel, several dozen each week are strong enough to be noticed, and a handful can cause serious damage. In 2025 alone, there were over 14,000 earthquakes of magnitude 4.0 or greater globally. Staying informed about real-time seismic activity is valuable whether you live in an earthquake-prone area, are planning travel, or study earth sciences.
Live Earthquake Map
🌍
7-Day Earthquake Summary
Updated March 21, 2026 · Source: USGS
269
Earthquakes (M3.0+)
M6.7
Strongest
Top Regions
Alaska (67), Russia (15), Chile (14)
264
Earthquakes (M3.0+)
M6.6
Strongest
Top Regions
Alaska (74), Russia (17), Japan (12)
245
Earthquakes (M3.0+)
M6.3
Strongest
Top Regions
Alaska (71), Russia (12), Japan (12)
244
Earthquakes (M3.0+)
M6.3
Strongest
Top Regions
Alaska (73), Indonesia (11), Japan (11)
233
Earthquakes (M3.0+)
M6.3
Strongest
Top Regions
Alaska (67), Japan (12), Chile (11)
220
Earthquakes (M3.0+)
M6.3
Strongest
Top Regions
Alaska (59), Japan (16), Chile (11)
Real-Time Earthquakes (24 Hours)
Real-time Earthquake Monitor
Data provided by USGS Earthquake API
Global Earthquake Map (7 Days)
Last 7 Days Earthquakes — Updated 2026-03-21 14:00 UTC
Earthquake Magnitude Legend
Magnitude 0 – 2.0
Magnitude 2.0 – 4.0
Magnitude 4.0 – 6.0
Magnitude 6.0+
How to Use the Live Earthquake Map
The interactive earthquake map is designed to be intuitive and easy to navigate. Here’s how to get the most out of it:
Zoom and Pan: Use your mouse wheel or pinch gestures on mobile to zoom in on any region. Click and drag to pan across the globe. Zooming into a specific area reveals individual earthquake markers that may be clustered at wider zoom levels.
Click for Details: Click on any earthquake marker or cluster to see detailed information including the exact magnitude, depth below the surface, precise location, and the time the earthquake occurred.
Filter by Magnitude: Use the magnitude legend on the map to filter which earthquakes are displayed. This is useful when you want to focus only on significant events (magnitude 4.0+) and filter out smaller tremors.
Switch Time Ranges: Toggle between a 24-hour view and a 7-day view depending on whether you want to see very recent activity or a broader picture of the past week’s seismic events.
Color Coding: Earthquake markers are color-coded by magnitude — green for minor earthquakes, yellow and orange for moderate ones, and red for strong to major events. This lets you instantly identify the most significant earthquakes on the map.
Shaking Up the Globe: A Week of Seismic Surprises
This week, the Earth experienced a total of 269 earthquakes with magnitudes above 3.0, marking a slightly above-average week in seismic activity. Of these, 171 were above magnitude 4.0, surpassing the typical weekly count of around 150. Alaska led the activity with 67 quakes, followed by Russia, Chile, and Japan. Notably, the strongest earthquake was a magnitude 6.7 event on the northern Mid-Atlantic Ridge. While no earthquakes reached magnitude 7.0 or higher, several significant events above magnitude 5.5 were recorded, highlighting the dynamic nature of our planet’s tectonic movements.
Regional Hotspots
🌍
Most Active Regions
Alaska 67
Russia 15
Chile 14
Japan 13
Greece 13
Indonesia 10
CA 8
U.S. Virgin Islands 8
Significant Earthquakes
M6.7 northern Mid-Atlantic Ridge 2026-03-21 12:16 UTC
M6.6 South Shetland Islands 2026-03-20 00:22 UTC
M6.1 105 km WNW of Isangel, Vanuatu 2026-03-20 02:30 UTC
M5.8 49 km SSW of Maisí, Cuba 2026-03-17 04:28 UTC
M5.7 51 km W of Norsup, Vanuatu 2026-03-21 03:21 UTC
M5.6 68 km WNW of San Antonio de los Cobres, Argentina 2026-03-21 10:00 UTC
M5.6 167 km S of Severo-Kuril’sk, Russia 2026-03-19 07:43 UTC
Magnitude Breakdown
M4.0-4.9 143
M5.0-5.9 25
M6.0-6.9 3
M7.0+ 0
Where Do Most Earthquakes Happen?
The vast majority of earthquakes occur along tectonic plate boundaries, where massive slabs of the Earth’s crust meet, collide, or slide past one another. The most seismically active zone on Earth is the “Ring of Fire,” a horseshoe-shaped belt stretching around the Pacific Ocean from New Zealand, along the eastern edge of Asia, north across the Aleutian Islands of Alaska, and south along the western coast of North and South America. Roughly 81% of the world’s largest earthquakes occur in this zone.
Other highly active seismic regions include the Alpide Belt, which extends from the Mediterranean through Turkey, Iran, and into the Himalayas, and the Mid-Atlantic Ridge, an underwater mountain range where tectonic plates are spreading apart. Countries like Japan, Indonesia, Chile, Mexico, and the Philippines experience frequent earthquakes due to their position on active plate boundaries.
In the United States, California and Alaska are the most earthquake-prone states, though significant seismic hazards also exist in the Pacific Northwest (where the Cascadia Subduction Zone threatens a major event), the New Madrid Seismic Zone in the central U.S., and parts of Utah and Nevada. In recent years, induced seismicity from oil and gas operations has also made Oklahoma and parts of Texas increasingly active — a trend that continues to be monitored by the USGS.
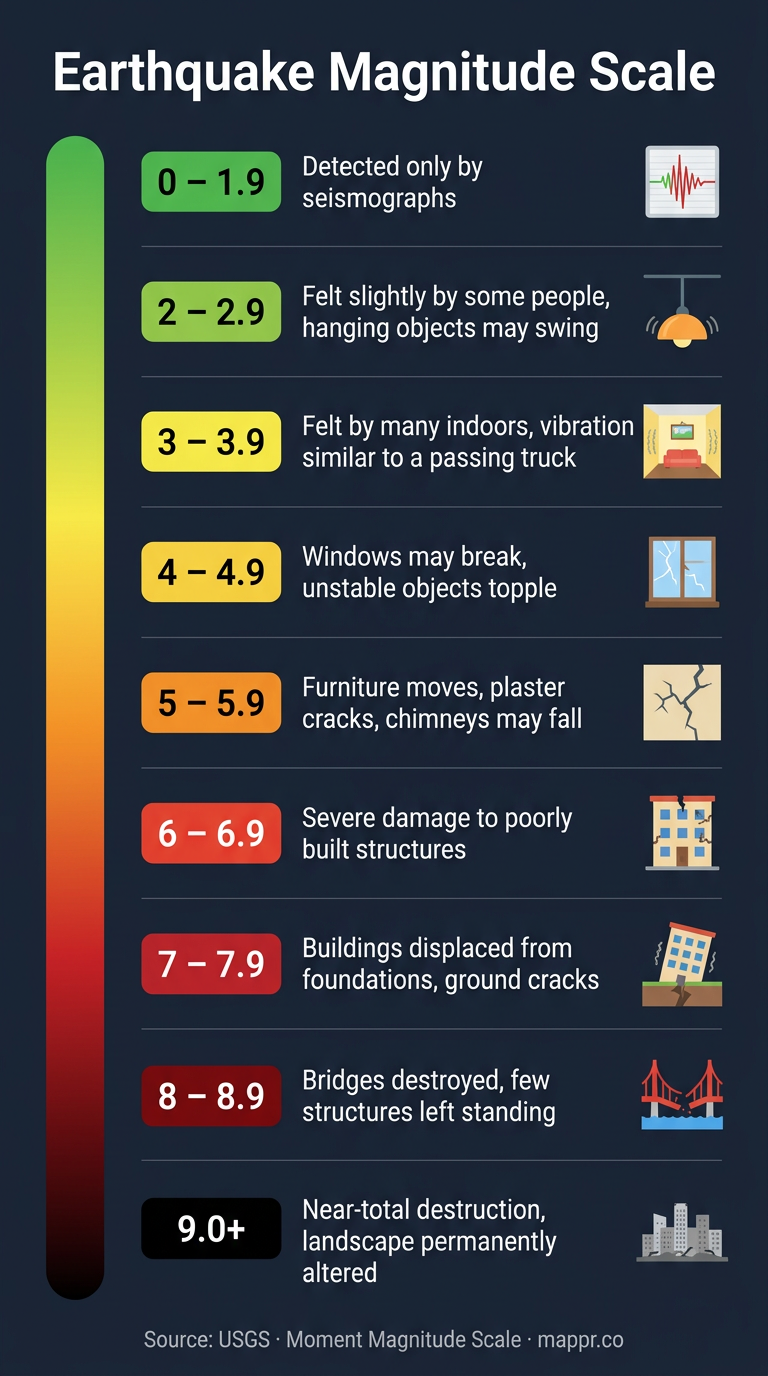
Understanding Earthquake Magnitudes
Earthquake magnitude is measured on the Moment Magnitude Scale (Mw), which replaced the older Richter Scale for most scientific purposes. The scale is logarithmic, meaning each whole number increase represents roughly 31.6 times more energy released.
A magnitude 5.0 earthquake releases about 31.6 times more energy than a magnitude 4.0, and a magnitude 6.0 releases about 1,000 times more energy than a magnitude 4.0. This is why the difference between a moderate and a major earthquake is so dramatic in terms of destructive potential.
Earthquake Magnitude Scale — effects at each level from micro-tremors to catastrophic events. Source: USGS
Minor (3.0 – 3.9)
Often felt by people, but very rarely causes damage.
Similar to the vibration of a passing truck.
Light (4.0 – 4.9)
Noticeable shaking of indoor items and rattling noises.
Significant damage unlikely unless structures are already weakened.
Moderate (5.0 – 5.9)
Can cause major damage to poorly constructed buildings in small regions.
Well-designed buildings may experience slight damage.
Strong (6.0 – 6.9)
Potentially destructive within 160 kilometers (100 miles) in populated areas.
Major (7.0 – 7.9)
Capable of causing serious damage over larger areas.
Major earthquakes that can destroy populated regions.
Great (8.0 or Higher)
Causes tremendous damage, impacting areas several hundred kilometers across.
Can trigger tsunamis and permanently alter landscape features.
Note: Negative magnitudes represent extremely small earthquakes, detectable only by sensitive instruments.
What Causes Earthquakes?
Earthquakes are caused by the sudden release of energy stored in the Earth’s crust, most commonly due to the movement of tectonic plates. The Earth’s outer shell is divided into several large and small plates that float on the semi-fluid mantle beneath. These plates are constantly moving, though usually at a pace of only a few centimeters per year. When plates push against, pull apart from, or slide past each other, stress builds up along fault lines. When that stress exceeds the strength of the rock, it fractures and shifts, sending seismic waves outward from the point of rupture (the focus or hypocenter) to the surface (the epicenter).
Not all earthquakes are tectonic in origin. Volcanic earthquakes occur when magma movement underground creates pressure changes and fractures rock. Induced or human-caused earthquakes can result from activities such as mining, reservoir-induced seismicity from large dams, hydraulic fracturing (fracking), and underground nuclear tests. Collapse earthquakes, triggered by the collapse of underground caverns or mines, are generally small but can be felt locally. Regardless of the cause, the result is the same: seismic waves propagate through and along the surface of the Earth, producing the shaking we feel.
How Are Earthquakes Measured?
Earthquakes are measured using seismometers (also called seismographs), instruments that detect and record the ground motion caused by seismic waves. Modern seismometer networks are extremely sensitive and can detect earthquakes occurring anywhere on the planet. The USGS alone operates hundreds of seismometers across the United States and collaborates with international networks to monitor global activity around the clock.
Two key measurements describe an earthquake: magnitude and intensity. Magnitude quantifies the total energy released at the source, and is the number you see on our map (e.g., M5.2). It is a single value for each earthquake. Intensity, measured on the Modified Mercalli Intensity (MMI) scale, describes how strongly the shaking is felt at a specific location. Intensity varies with distance from the epicenter, local soil conditions, and building construction. A single earthquake can have one magnitude but many different intensity values depending on where you are when it strikes.
Earthquake Safety: What to Do Before, During, and After
If you live in or are traveling to a seismically active area, knowing how to prepare and respond can be lifesaving. Before an earthquake, secure heavy furniture and appliances to walls, identify safe spots in each room (under sturdy desks or tables, away from windows), and assemble an emergency kit with water, food, a flashlight, and a first-aid kit. Make sure everyone in your household knows the plan.
During an earthquake, follow the “Drop, Cover, and Hold On” protocol: drop to your hands and knees, take cover under a sturdy piece of furniture, and hold on until the shaking stops. If you are outdoors, move away from buildings, utility wires, and overpasses. If you are driving, pull over to a clear area and stay in the car. After the shaking stops, check for injuries and damage, be prepared for aftershocks (which can be nearly as strong as the initial quake), and avoid damaged buildings. If you are near the coast and the earthquake was strong or lasted a long time, move to higher ground immediately — tsunamis can arrive within minutes of a coastal earthquake.
Tip: Bookmark this page and our storm tracker to monitor natural hazards from a single place. If you’re planning international travel, use our travel map planner to plot routes that account for seismic and weather risks along the way.
Related Maps & Tools
Earthquake monitoring is just one way to explore our planet’s dynamics. Here are more interactive tools from Mappr that complement the seismic data you see above:
Live Storm Tracker — Track active hurricanes, typhoons, and tropical storms in real time. Useful alongside earthquake data for monitoring natural hazards during severe weather events.
Population Density Explorer — Overlay earthquake zones with population data to understand which seismic events affect the most people. A magnitude 6.0 earthquake in a remote ocean is very different from one near a city of 10 million.
World Time Zones Map — When a major earthquake strikes, knowing the local time at the epicenter helps contextualize the impact — a nighttime event can be more dangerous when people are asleep indoors.
Travel Time Map — Planning a trip to a seismically active region? Use the isochrone calculator to map out evacuation routes and distances from coastal areas where tsunamis may follow strong undersea earthquakes.
20 Biggest Earthquakes in History — Put today’s seismic activity in perspective by comparing it to the most powerful earthquakes ever recorded, from the 1960 Chile M9.5 to the 2011 Tōhoku M9.1.
Frequently Asked Questions
How often is the earthquake data updated?
The live earthquake map refreshes its data automatically every 5 minutes. The data comes directly from the USGS Earthquake Hazards Program, which continuously monitors seismic activity through a global network of seismometers. New earthquakes typically appear on our map within minutes of being detected and processed by the USGS.
What is the minimum magnitude shown on the map?
By default, the map displays all earthquakes of magnitude 2.5 and above for the selected time range. You can adjust the minimum magnitude filter using the legend controls on the map to show only larger events (e.g., magnitude 4.0+ or 5.0+) if you want to focus on more significant earthquakes.
What do the different colors on the map mean?
Earthquake markers are color-coded by magnitude to help you quickly assess their significance. Green markers indicate minor earthquakes (below magnitude 3.0), yellow markers represent light earthquakes (3.0-4.0), orange markers show moderate earthquakes (4.0-5.0), and red markers highlight strong to major earthquakes (5.0 and above). Larger magnitude earthquakes also appear as larger markers on the map.
Can I see earthquakes in a specific region?
Yes. Simply zoom into the area you are interested in using your mouse scroll wheel or pinch-to-zoom on mobile devices. The map will automatically decluster the earthquake markers as you zoom in, revealing individual events. You can click on any marker to see the full details for that specific earthquake.
Where does the earthquake data come from?
All earthquake data displayed on this map is sourced from the United States Geological Survey (USGS) Earthquake Hazards Program. The USGS operates the Advanced National Seismic System (ANSS) and collaborates with international seismic networks to monitor and report earthquake activity worldwide. It is the most comprehensive and authoritative source of global earthquake data available to the public.
How many earthquakes happen per day worldwide?
The USGS estimates that approximately 55 earthquakes per day are large enough to be detected and located, which amounts to about 20,000 per year. However, the vast majority of these are minor (below magnitude 3.0) and go unnoticed by most people. On average, about 15 earthquakes of magnitude 4.0 or greater occur each day, roughly one magnitude 5.0+ earthquake occurs daily, and about 15 major earthquakes (magnitude 7.0+) happen each year globally.
Can I get earthquake alerts on my phone?
Yes. The USGS offers a free Earthquake Notification Service that sends email or text alerts when earthquakes matching your criteria occur. Google’s Android Earthquake Alerts System uses phone accelerometers to detect shaking and send warnings seconds before strong shaking arrives — this “ShakeAlert” system is active in California, Oregon, and Washington. Apple’s iPhone also supports critical earthquake alerts in supported regions. For global coverage, apps like MyShake (UC Berkeley) and LastQuake (EMSC) provide real-time notifications worldwide.
What is the difference between earthquake magnitude and intensity?
Magnitude measures the total energy released at the earthquake’s source — it’s a single number assigned to each event (e.g., M6.3). Intensity measures how strongly the shaking is felt at a specific location, using the Modified Mercalli Intensity (MMI) scale from I (not felt) to XII (total destruction). A single earthquake has one magnitude but many intensities: shaking is strongest near the epicenter and decreases with distance. Factors like soil type, building construction, and depth also affect local intensity.