Key Takeaways
- The ocean's plastic doesn't spread evenly: it collects in five spots. The subtropical gyres of the North and South Pacific, North and South Atlantic and the Indian Ocean spin floating debris into semi-permanent garbage patches.
- The Great Pacific Garbage Patch covers about 1.6 million km². Dropped on Europe at true scale, it would bury Germany with room to spare: roughly the area of Britain, Italy, Poland, Germany and Spain combined.
- It is a soup, not an island. About 1.8 trillion plastic pieces weighing roughly 80,000 tonnes float there, most of it as fragments and microplastics you could sail through without noticing.
- Rivers are the conveyor belt. Roughly 80% of river-borne ocean plastic arrives via about 1,000 rivers, mostly small urban waterways in Asia, and nets and fishing gear make up almost half the patch's mass.
Where does the ocean’s plastic actually go? Not everywhere: physics is tidier than that. Floating debris rides the currents until it reaches one of the ocean’s five great rotating systems, the subtropical gyres, whose slow inward spiral traps it for years. The result is five semi-permanent accumulation zones, and one of them has become the most famous waste mass on Earth.
The Map: Five Gyres, Five Garbage Patches
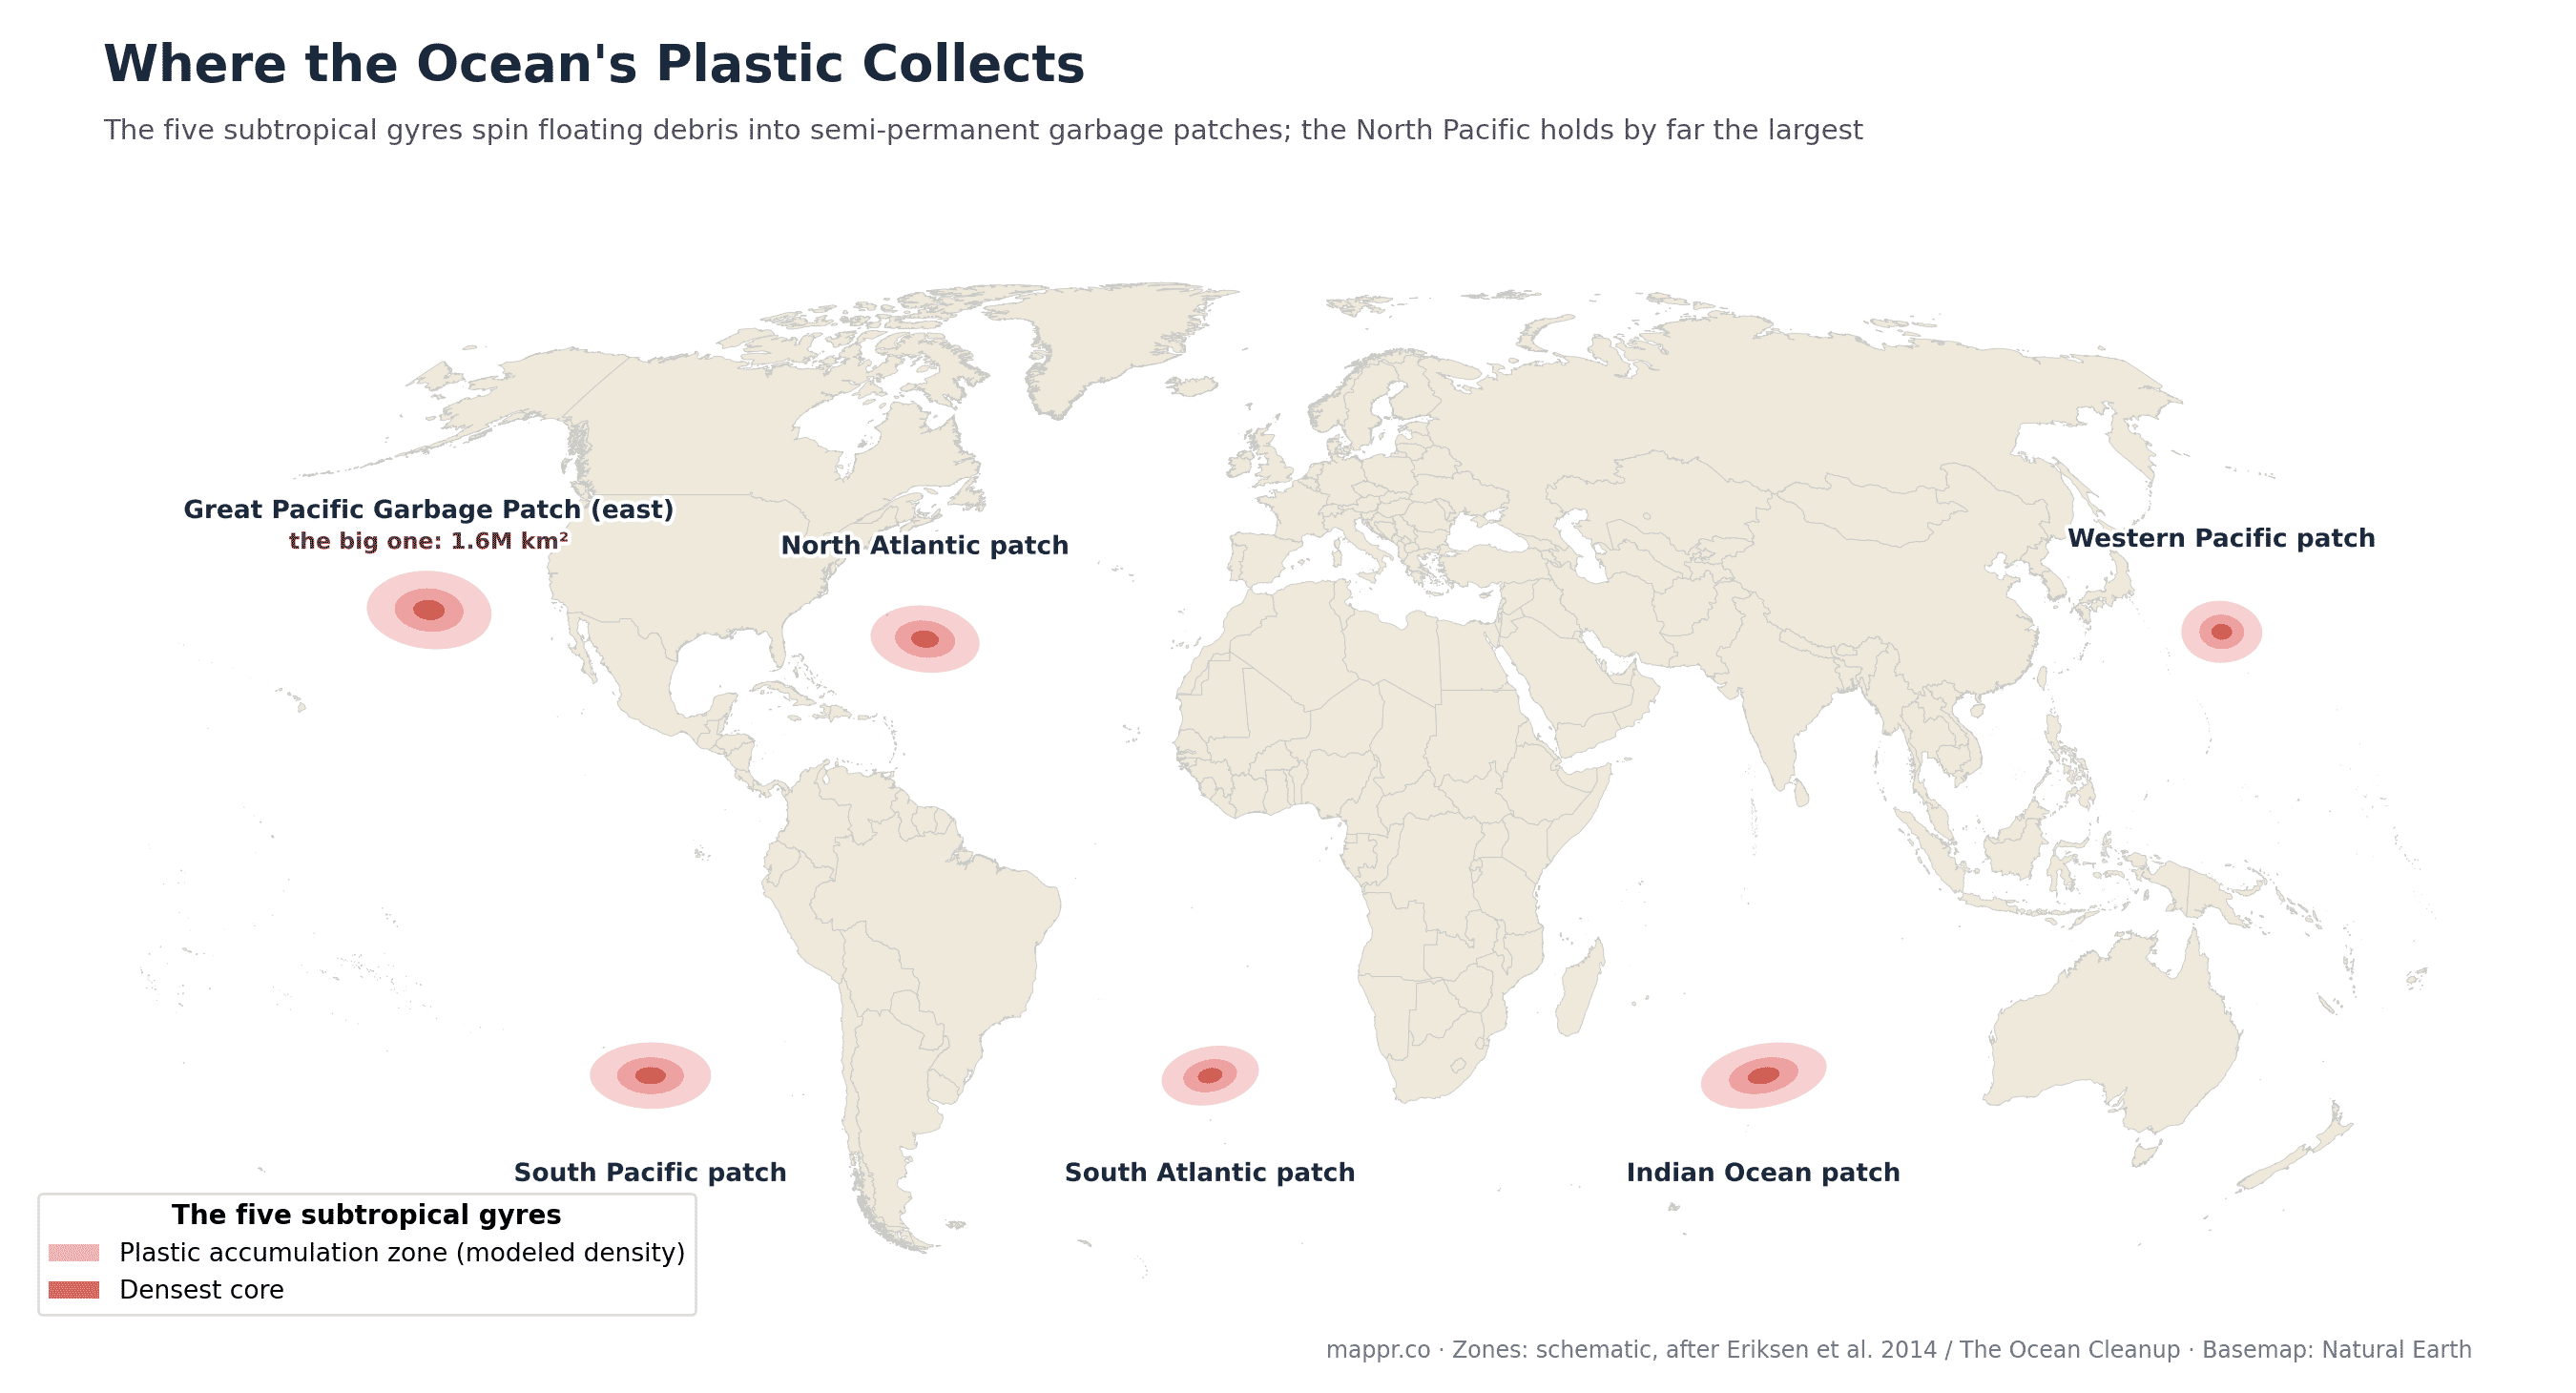
Every ocean basin that straddles the horse latitudes has one: the North Pacific (two connected patches), the North Atlantic, the South Atlantic, the South Pacific and the Indian Ocean. A landmark global survey estimated more than 5 trillion plastic pieces afloat worldwide, and the gyres hold the densest concentrations.
Inside the North Pacific Gyre
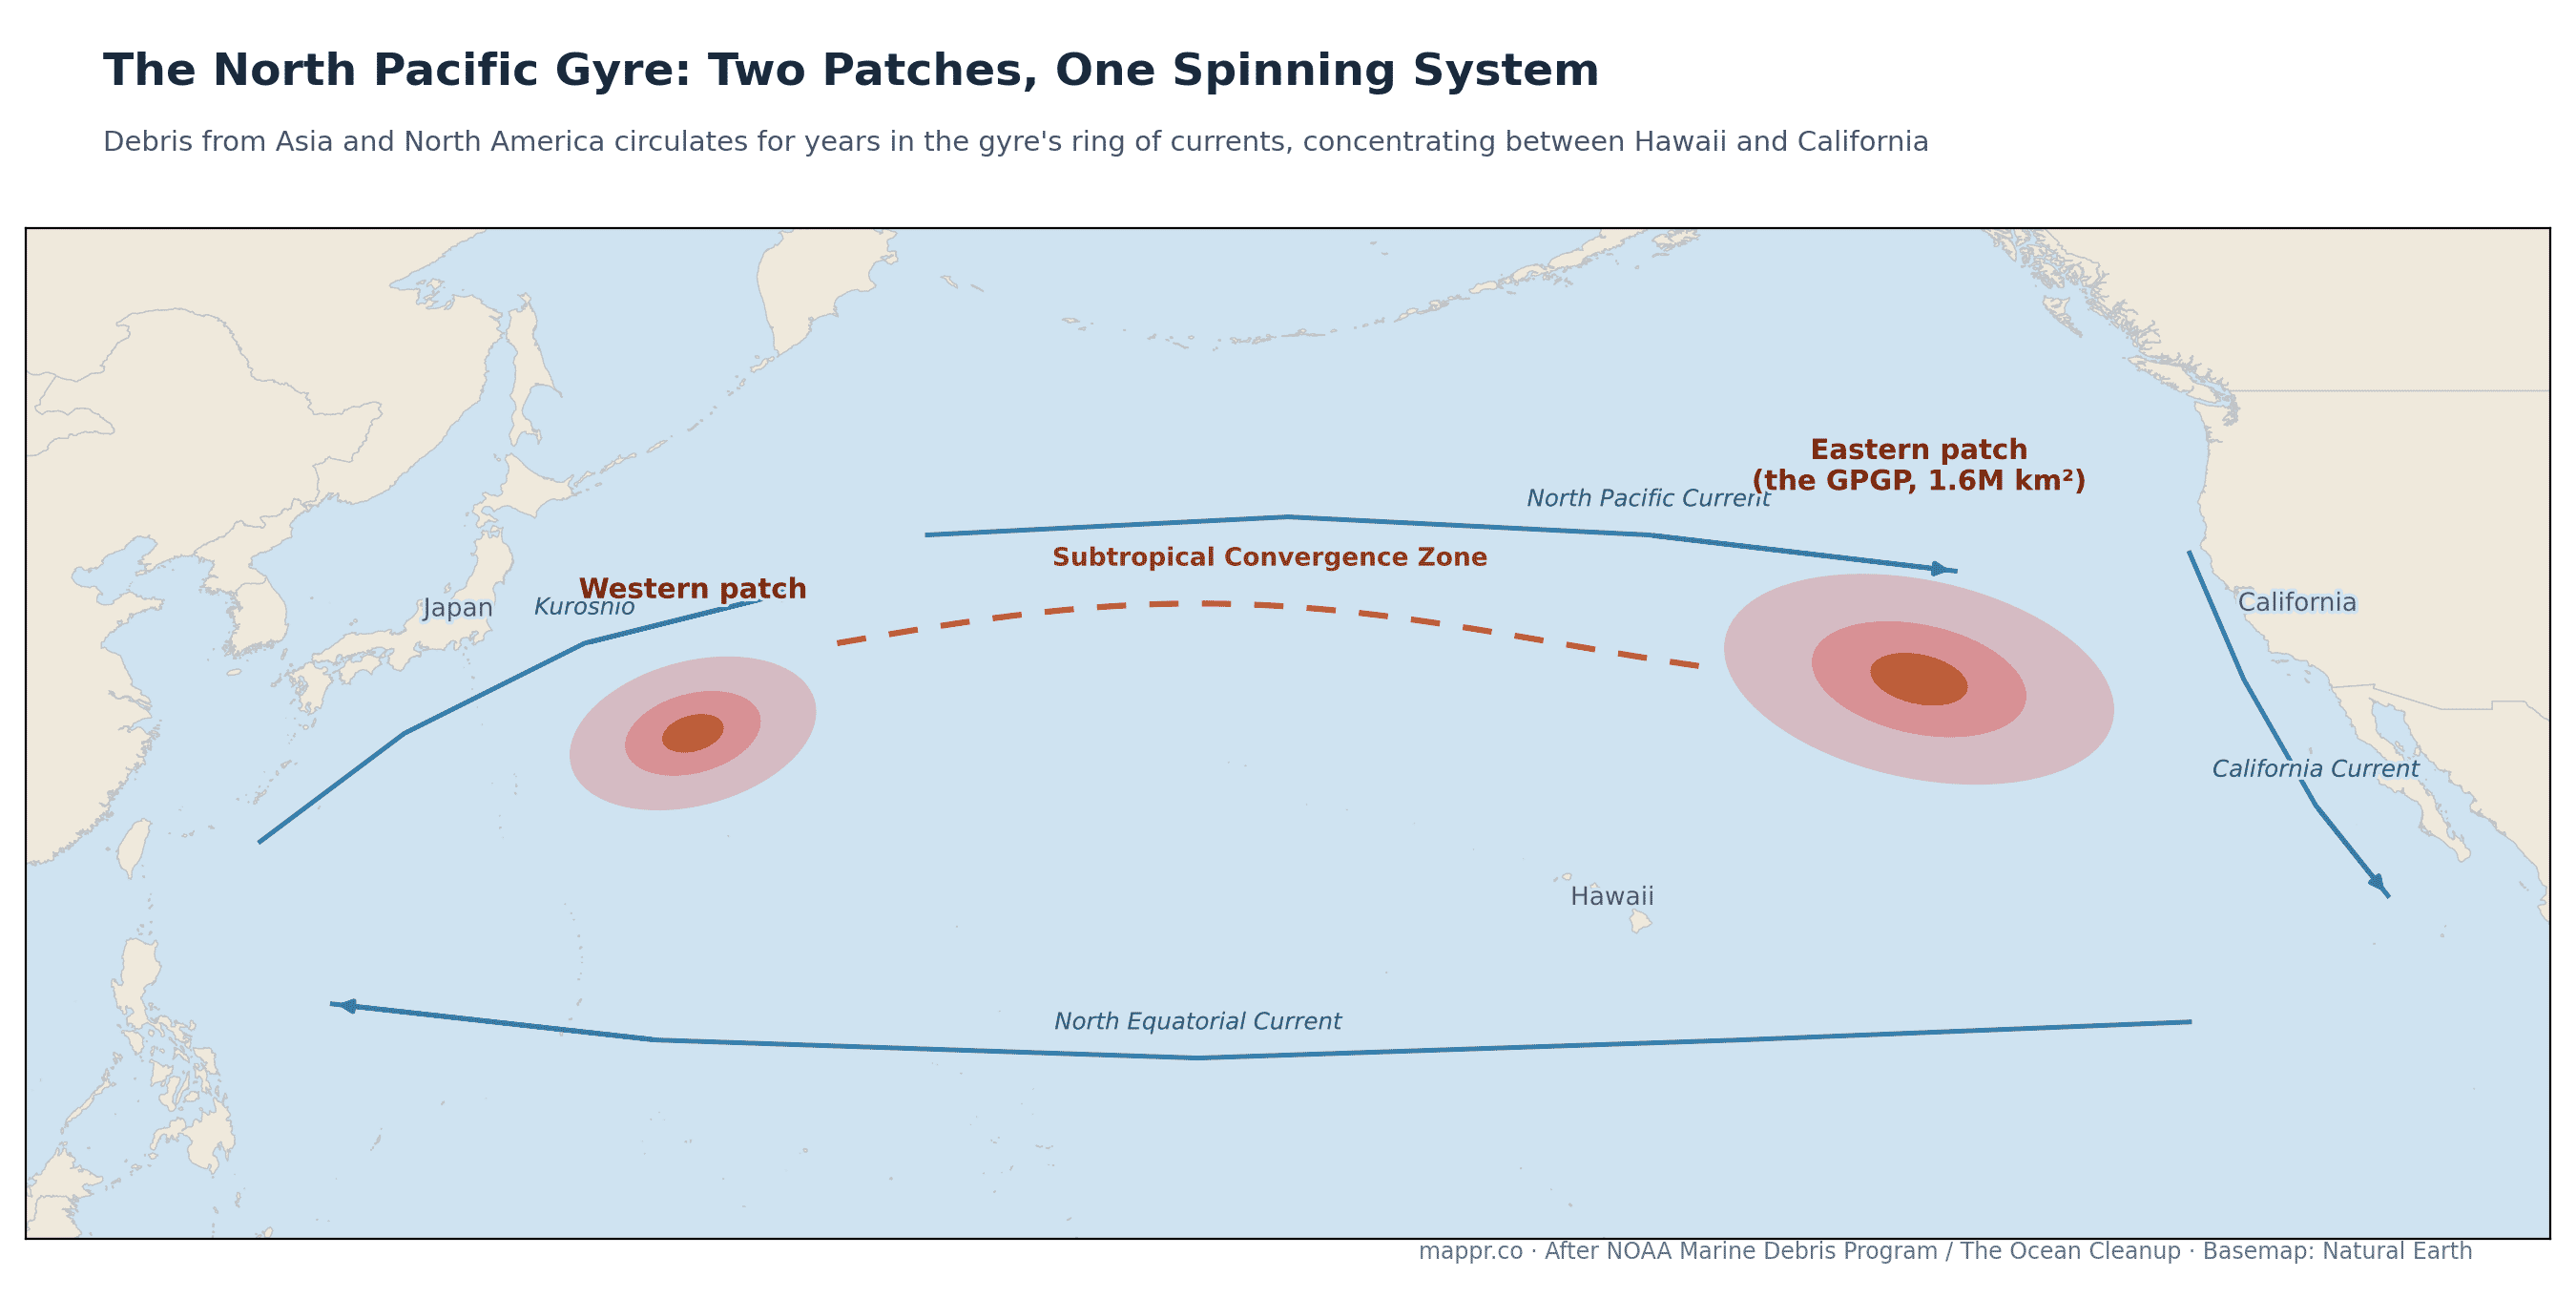
The “Great Pacific Garbage Patch” is really the eastern half of a two-patch system. Debris washed off Asia’s coasts rides the Kuroshio east; debris from North America drifts west on the North Equatorial Current. A western patch concentrates off Japan, an eastern patch (the GPGP proper) between Hawaii and California, and the Subtropical Convergence Zone ferries debris between them. Despite the name, it is no island: about 1.8 trillion pieces weighing ~80,000 tonnes, mostly confetti-sized fragments in the top metre of water. Nearly half the mass is abandoned fishing gear.
How Big Is 1.6 Million km², Really?
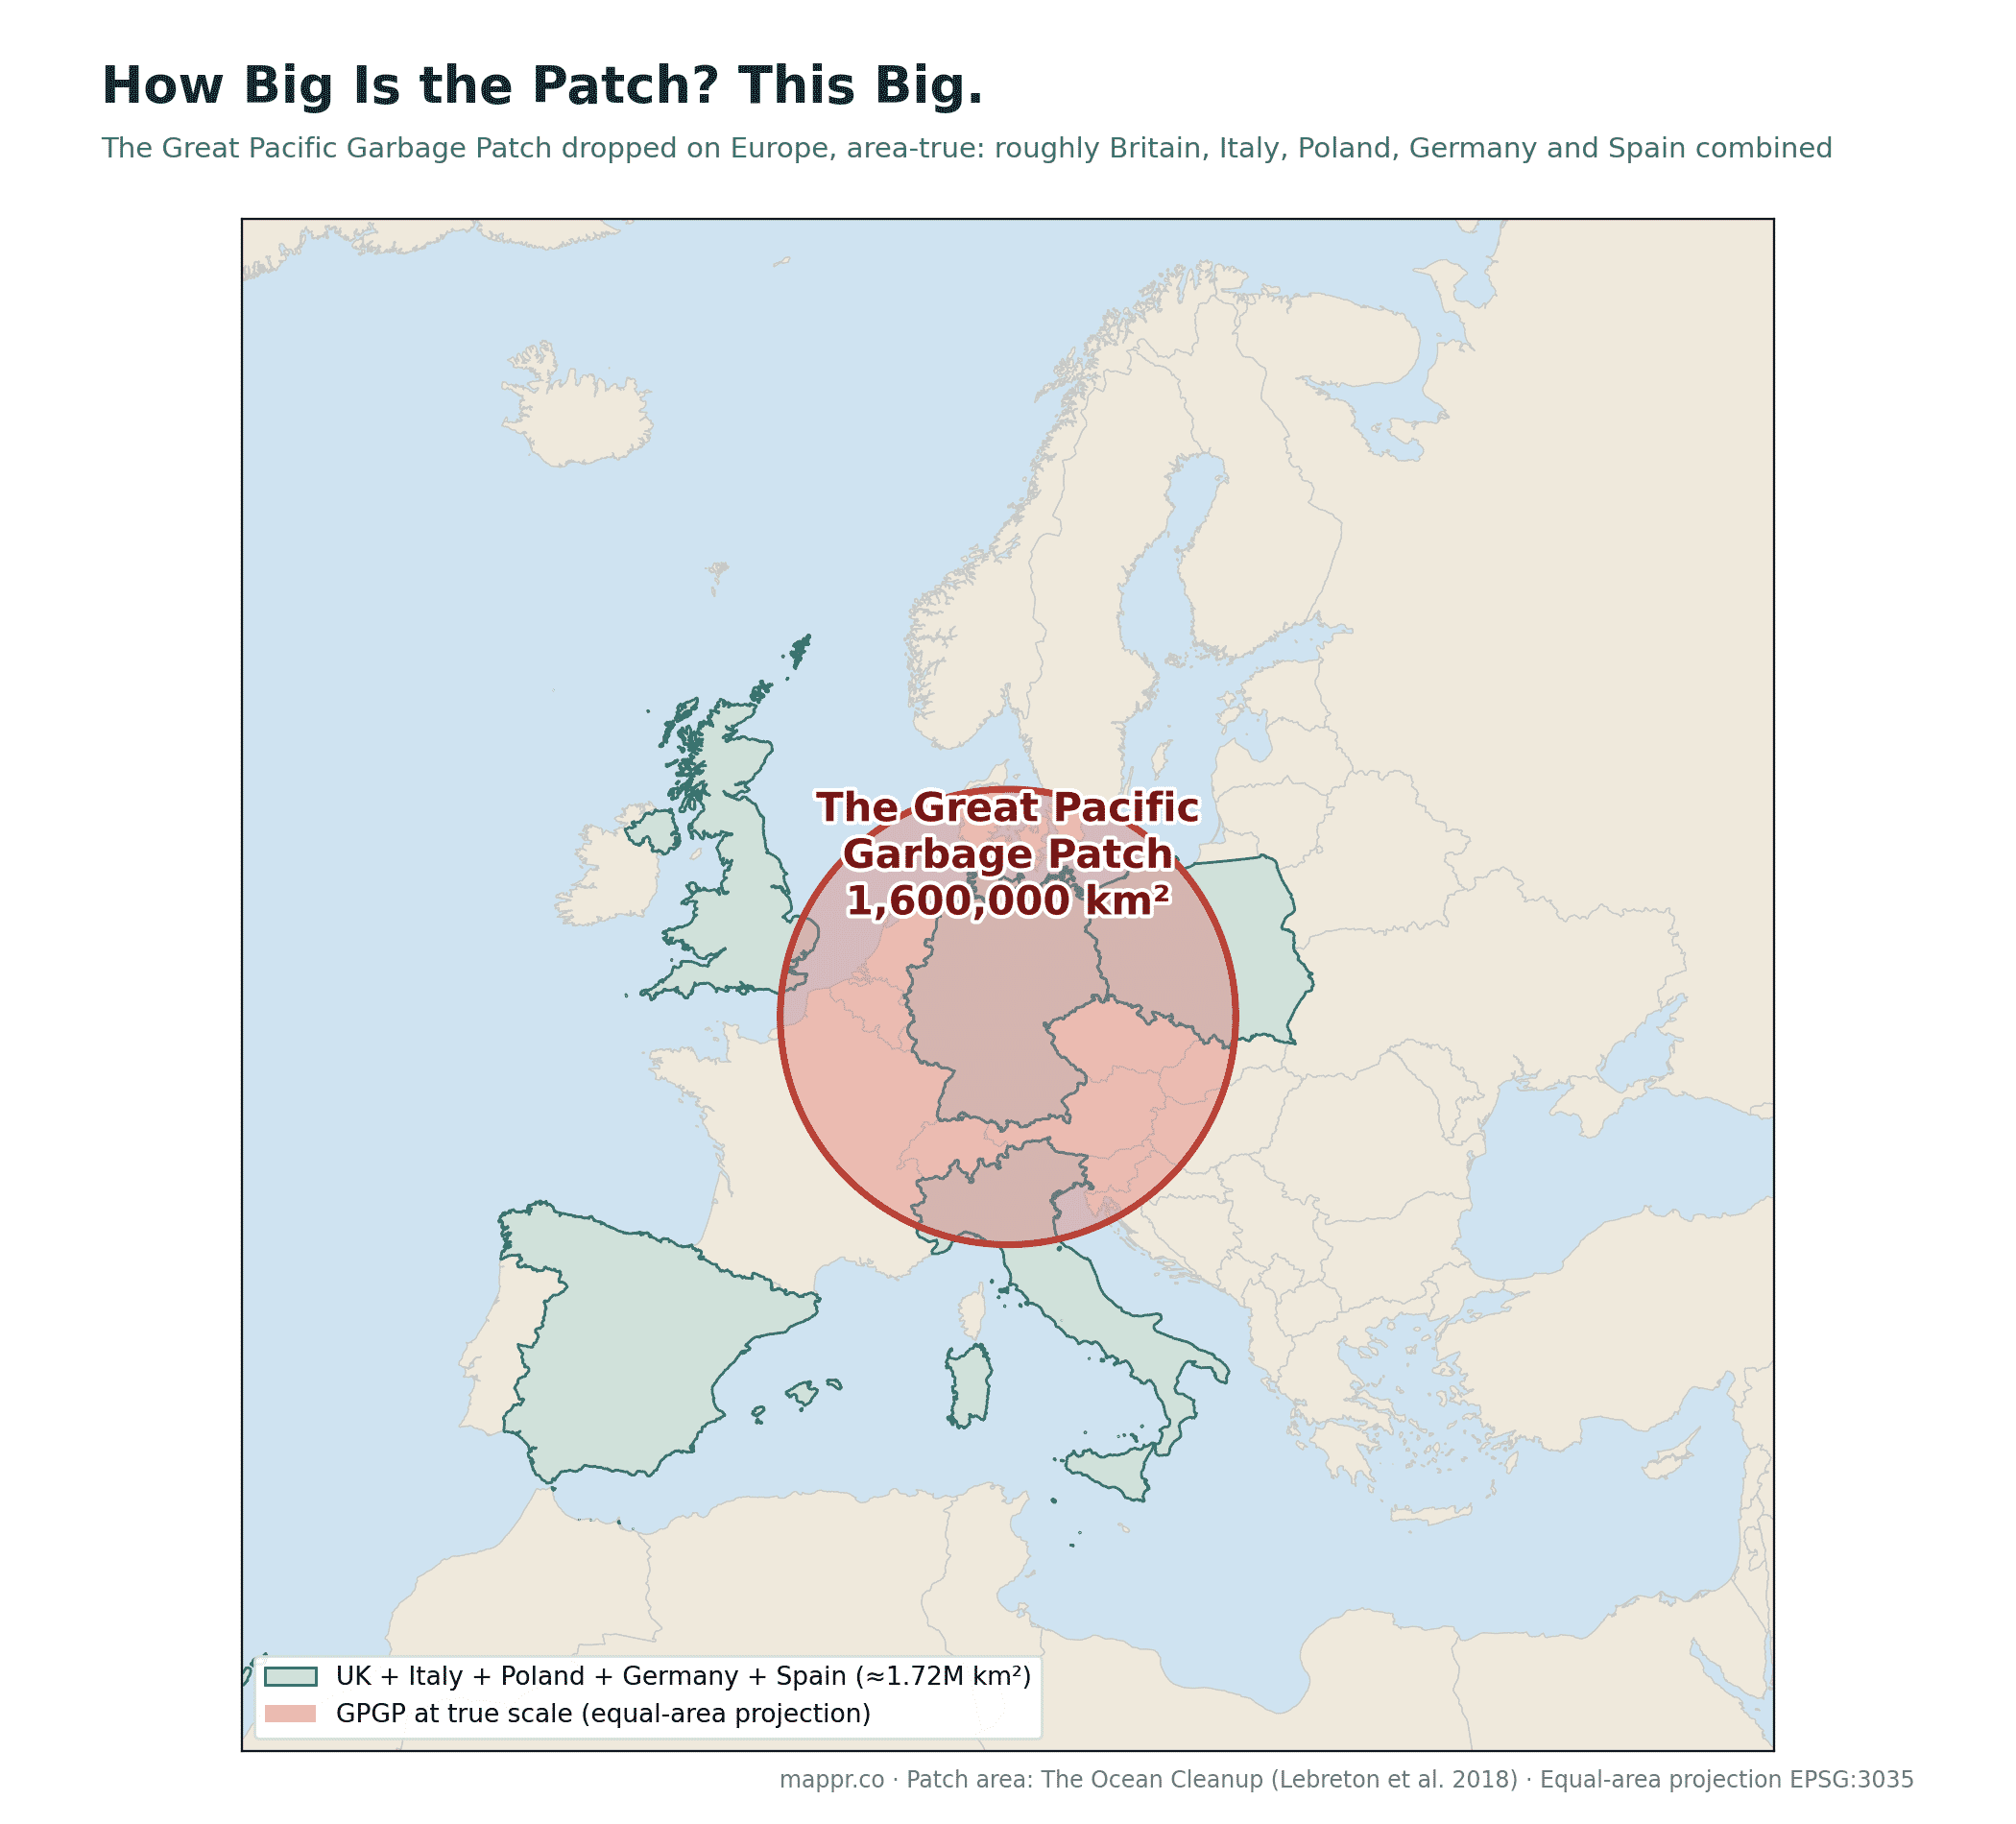
Size comparisons usually lie on web maps because Mercator inflates everything far from the equator, so we did this one honestly, in an equal-area projection. At 1.6 million km², the patch dropped on Central Europe swallows Germany whole and reaches from the North Sea to northern Italy. It is roughly Great Britain, Italy, Poland, Germany and Spain combined (those five sum to about 1.72 million km²), or for American readers, nearly the size of Alaska, about three times France, and more than twice Texas.
The Conveyor Belt: How It Gets There
The patches are the destination, not the source. Research mapping global river outflows found that about 1,000 rivers deliver roughly 80% of river-borne plastic emissions, with small, dense urban rivers in Asia contributing far more than the giant rivers of geography lessons. Once at sea, plastic doesn’t biodegrade; it photodegrades into ever-smaller fragments, which is why the patches grow denser rather than more visible, and why cleanup gets harder every year the inflow continues.
The same logic drives the household math: a four-person family that switches from bottled to tap water keeps roughly 100 kg of plastic a year out of the waste stream in the first place. Where your tap water stands in for the bottle is a map of its own, and one we’re working on next.
Data and reporting for this article come from the following sources: