Key Takeaways
- The Philippines is the world's most disaster-prone country, again. It scores 46.69 on the WorldRiskIndex 2026, ahead of India (44.97) and Indonesia (44.63). It has topped every edition of the index since 2011.
- Risk = exposure x vulnerability, and the two tell opposite stories. China has the world's highest exposure (71.1) but low vulnerability (12.3). Somalia has minimal exposure (11.9) but the world's highest vulnerability (71.0). Both land in the top ten.
- Storms are the 2026 report's focus, and the costliest weather extreme. Direct disaster losses run about US$202 billion a year; the broader economic toll is estimated near US$2.3 trillion once cascading effects are counted.
- Risk is not where the news happens. Germany sits 99th at 4.29. The countries facing the highest structural risk are concentrated in Asia and the Americas, whatever made headlines this year.
Four days before the International Day for Disaster Risk Reduction on October 13, whose 2026 theme is “Resilience Starts at Home”, this map asks the question behind the headlines: which countries actually face the highest disaster risk?
The answer comes from the freshly released WorldRiskReport 2026, published in late September by the German alliance Bündnis Entwicklung Hilft with the Institute for International Law of Peace and Armed Conflict (IFHV) at Ruhr University Bochum. Its WorldRiskIndex scores all 193 UN member states, covering more than 99% of the world’s population, by combining exposure to earthquakes, storms, floods, droughts, tsunamis and sea-level rise with a society’s vulnerability to them.
The Map: Disaster Risk in 193 Countries
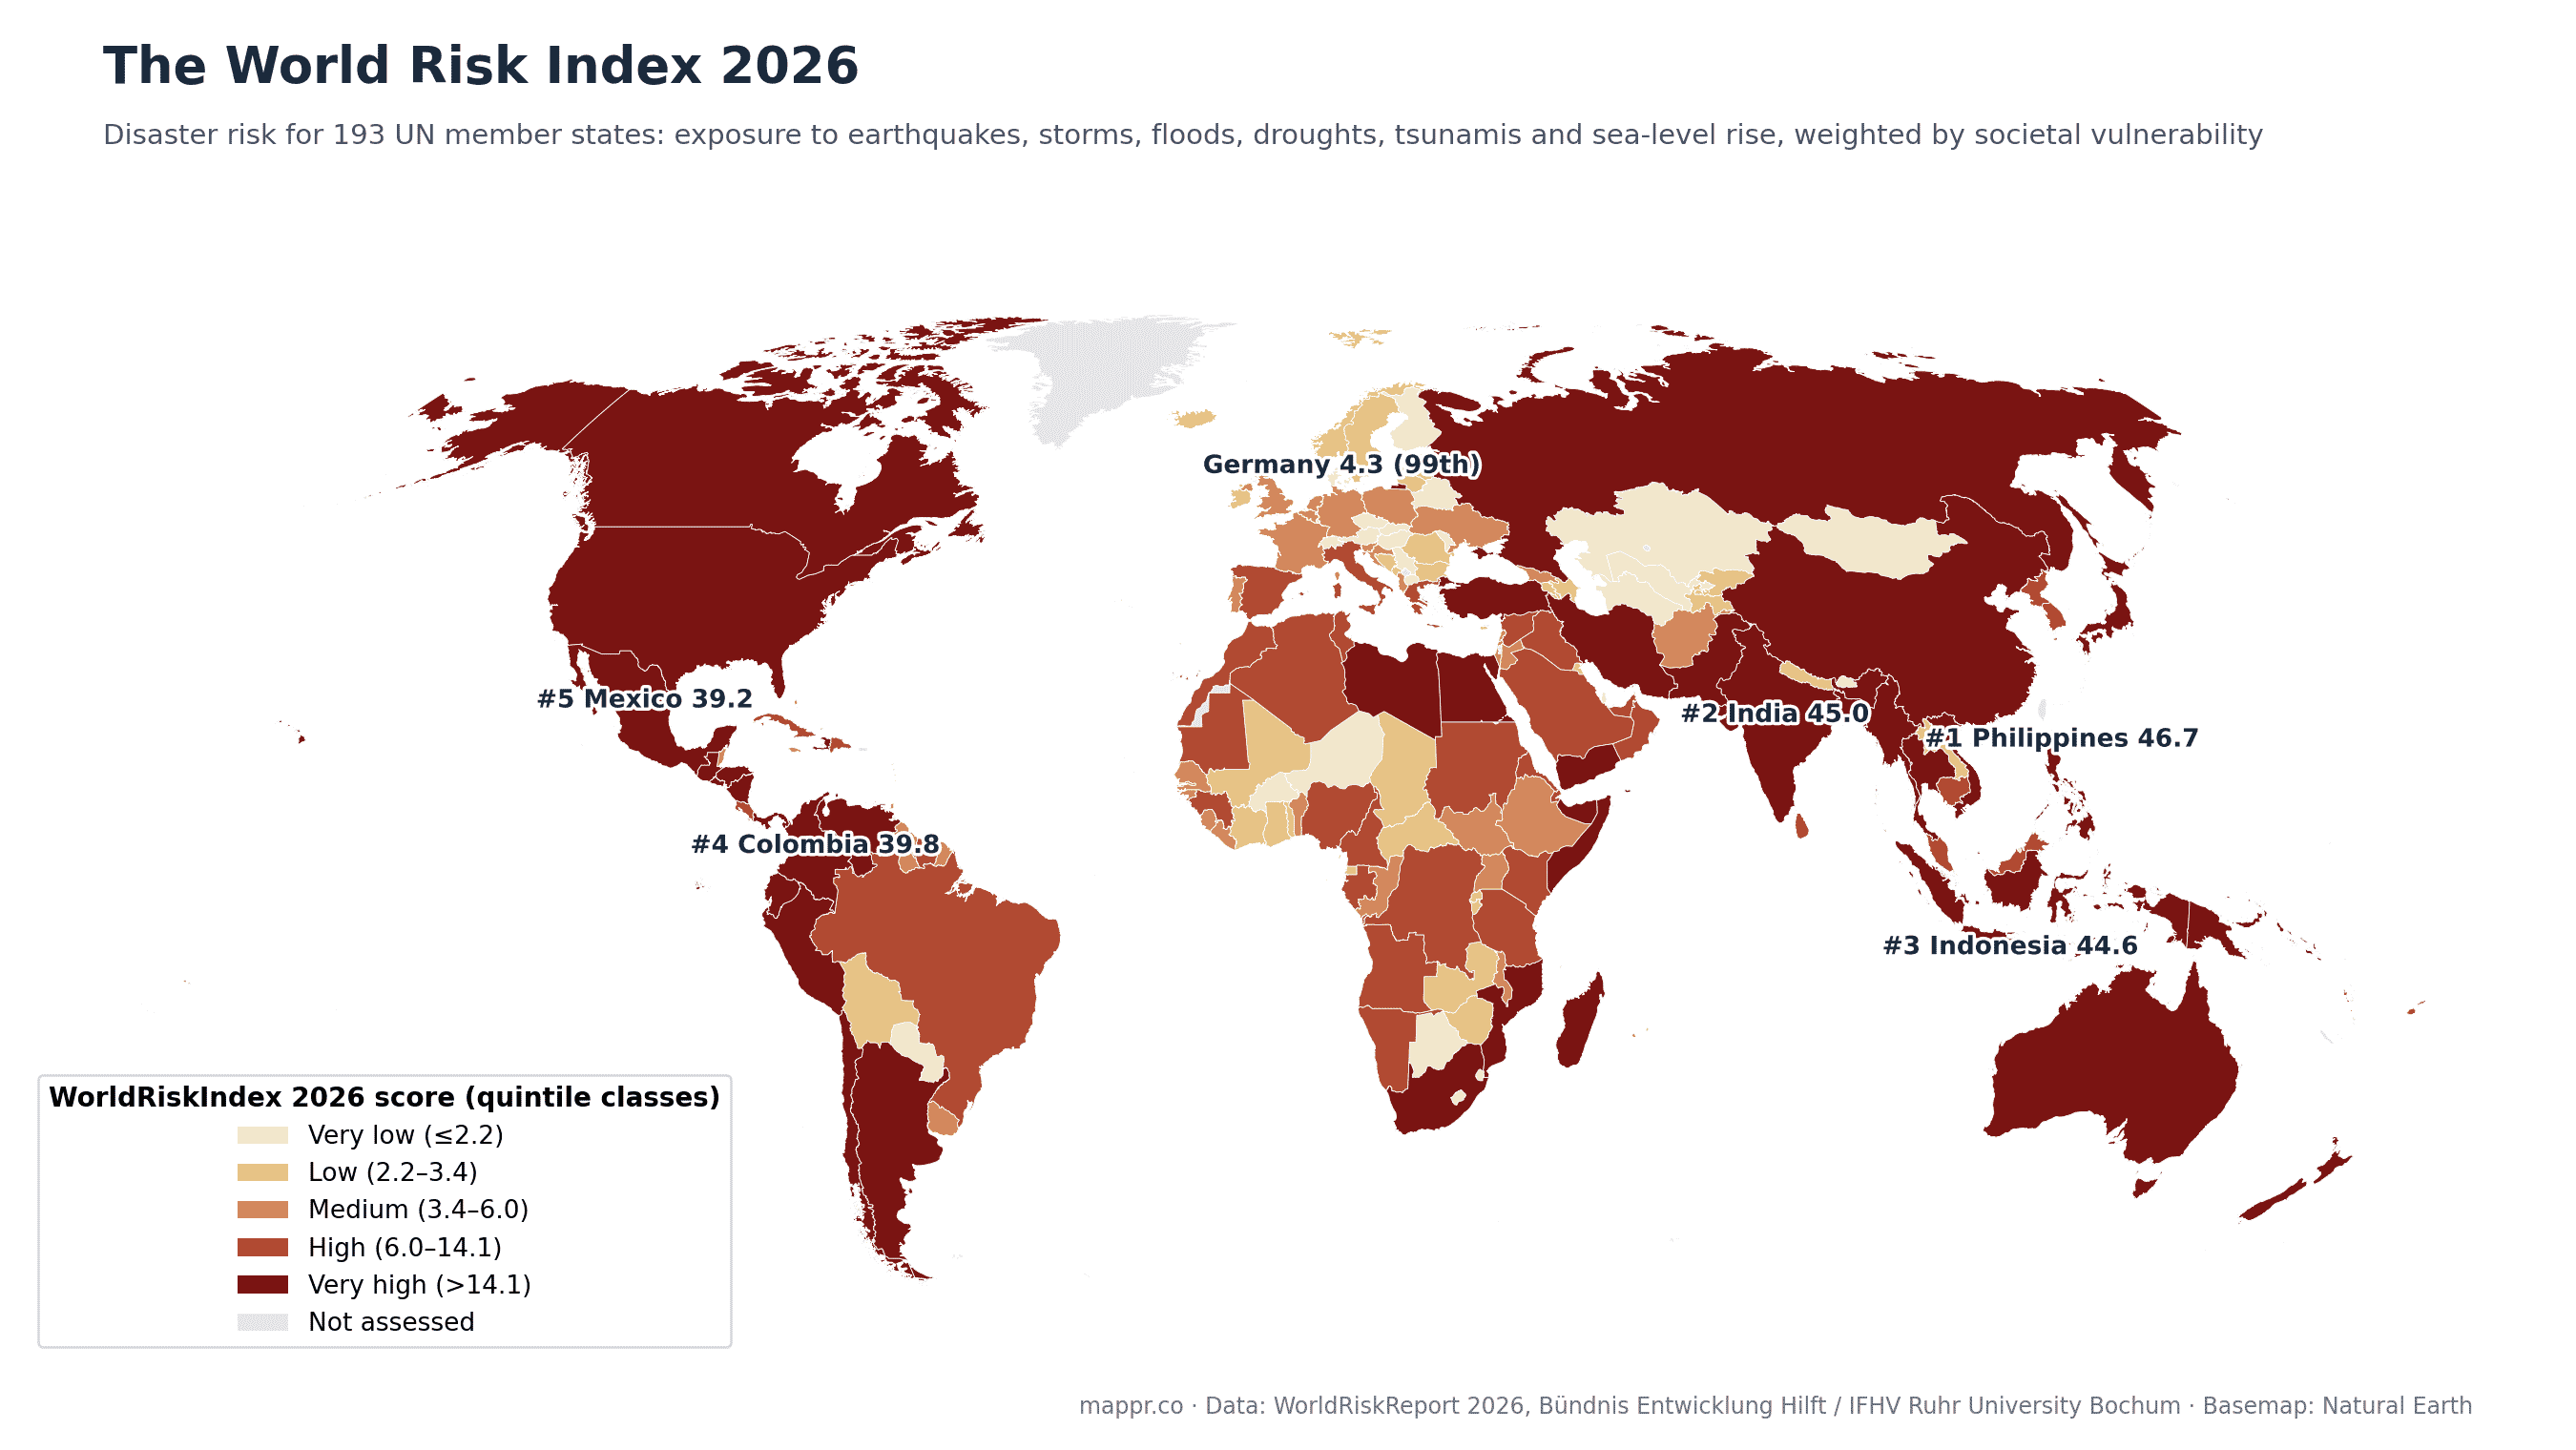
The Philippines leads with 46.69, as it has every year since 2011. An archipelago on the typhoon belt and the Pacific Ring of Fire, it combines near-maximal exposure with mid-range vulnerability. India (44.97) and Indonesia (44.63) follow, then Colombia (39.80) and Mexico (39.18): risk is concentrated in Asia and the Americas, which supply eight of the top ten.
At the other end sit Europe’s microstates: Monaco (0.21), San Marino and Andorra (0.33), Luxembourg (0.45) and Liechtenstein (0.67). Germany ranks 99th at 4.29, squarely in the global midfield.
Two Opposite Roads Into Risk
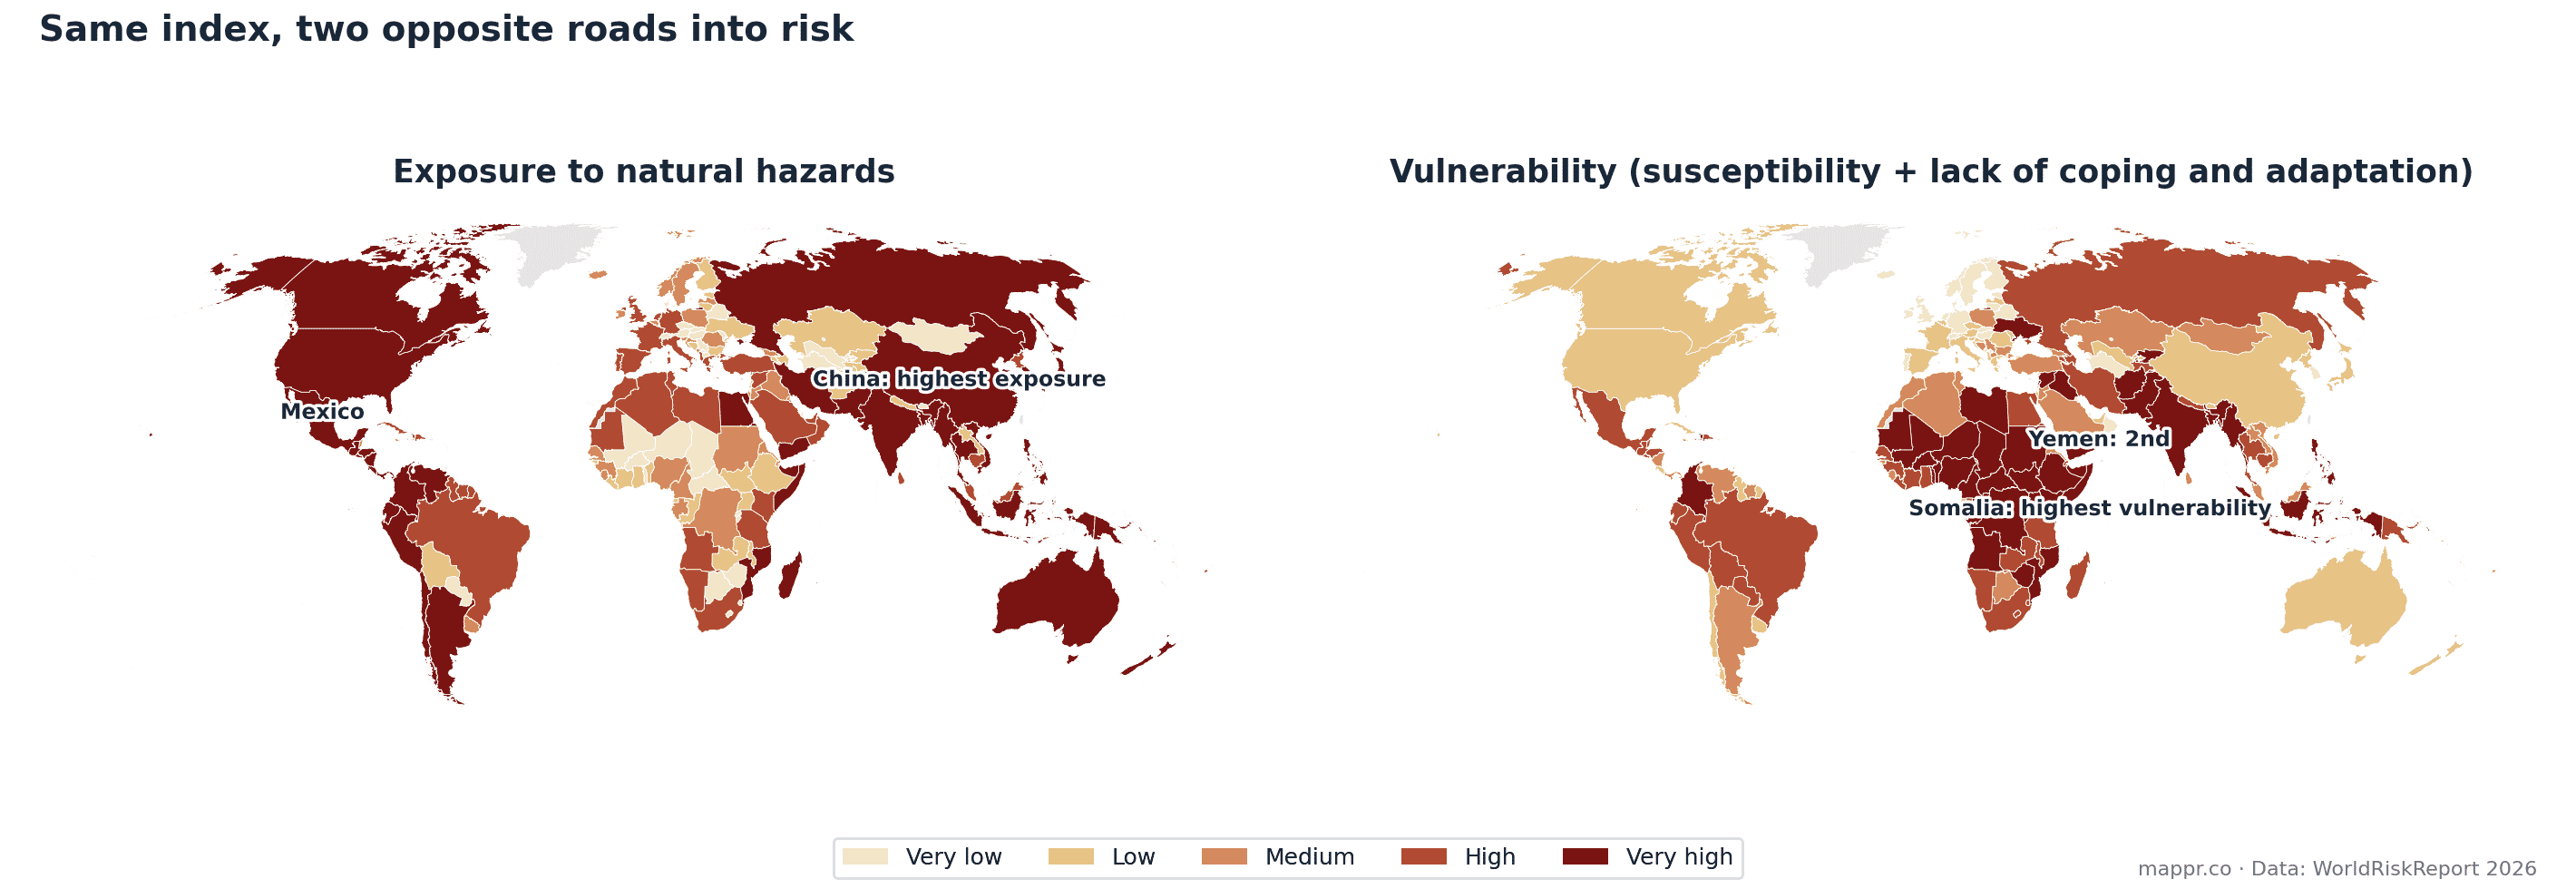
The index multiplies two components, and the small multiple shows why that matters. China has the highest exposure on Earth (71.1): more people and assets in the path of hazards than anywhere else. But wealth, infrastructure and coping capacity push its vulnerability down to 12.3, so it lands 9th rather than 1st.
Somalia is China’s mirror image. Its exposure is modest (11.9), yet the world’s highest vulnerability score (71.0) carries it into the top ten anyway. Yemen repeats the pattern (exposure 9.4, vulnerability 67.8). Two countries can share a risk score for opposite reasons, and the policy answer differs accordingly: engineering and early warning where exposure rules, poverty reduction and institutions where vulnerability does.
The Ranking
Ranked
WorldRiskIndex 2026: the fifteen highest-risk countries, and the five safest
Score 0-100, where risk = exposure to natural hazards x societal vulnerability.
| Country | Rank | Score | Note |
|---|---|---|---|
| 🇵🇭 Philippines | 1 | 46.69 | Top of the index every year since 2011 |
| 🇮🇳 India | 2 | 44.97 | |
| 🇮🇩 Indonesia | 3 | 44.63 | |
| 🇨🇴 Colombia | 4 | 39.80 | |
| 🇲🇽 Mexico | 5 | 39.18 | Highest exposure in the top five (50.7) |
| 🇲🇲 Myanmar | 6 | 37.51 | Risk driven by vulnerability (62.7), not exposure |
| 🇲🇿 Mozambique | 7 | 30.92 | |
| 🇷🇺 Russia | 8 | 30.58 | |
| 🇨🇳 China | 9 | 29.54 | World's highest exposure (71.1), cushioned by low vulnerability |
| 🇸🇴 Somalia | 10 | 29.12 | World's highest vulnerability (71.0) on minimal exposure |
| 🇭🇳 Honduras | 11 | 27.68 | |
| 🇵🇬 Papua New Guinea | 12 | 27.64 | |
| 🇵🇰 Pakistan | 13 | 27.03 | |
| 🇧🇩 Bangladesh | 14 | 25.70 | |
| 🇾🇪 Yemen | 15 | 25.18 | Vulnerability 67.8: the Somalia pattern repeated |
| 🇱🇮 Liechtenstein | 189 | 0.67 | Among the five safest |
| 🇱🇺 Luxembourg | 190 | 0.45 | |
| 🇦🇩 Andorra | 191 | 0.33 | |
| 🇸🇲 San Marino | 192 | 0.33 | |
| 🇲🇨 Monaco | 193 | 0.21 |
Risk Is Not the Same as Events
A year of mapping disasters as they happen, from Hurricane Polo on Mexico’s Pacific coast to the largest earthquakes ever recorded, teaches one lesson quickly: where disasters strike is not the same as where they do the most damage. The WorldRiskIndex is the structural map underneath the news cycle. Japan absorbs magnitude-7 earthquakes with minimal casualties; a far weaker event in a high-vulnerability country can kill thousands. That gap is vulnerability, and it is why the index’s top ten looks so different from any given year’s disaster headlines.
The 2026 edition’s thematic focus is storms, the costliest class of weather extreme. The UN’s disaster office puts direct losses at roughly US$202 billion a year, and the broader economic impact near US$2.3 trillion once knock-on effects through supply chains, health and ecosystems are counted. The report’s argument, echoed in this year’s “Resilience Starts at Home” theme, is that those losses are not fate: the vulnerability half of the equation is the half governments can actually move.
The Full Ranking: All 193 Countries
The complete WorldRiskIndex 2026 table below is searchable and sortable: every UN member state with its overall score, exposure and vulnerability components. Type a country name into the search box to jump straight to it.
| Rank | Country | WRI Score | Exposure | Vulnerability |
|---|---|---|---|---|
| 1 | Philippines | 46.69 | 40.76 | 53.49 |
| 2 | India | 44.97 | 40.83 | 49.54 |
| 3 | Indonesia | 44.63 | 39.78 | 50.08 |
| 4 | Colombia | 39.80 | 31.59 | 50.14 |
| 5 | Mexico | 39.18 | 50.69 | 30.28 |
| 6 | Myanmar | 37.51 | 22.44 | 62.70 |
| 7 | Mozambique | 30.92 | 14.69 | 65.09 |
| 8 | Russia | 30.58 | 28.37 | 32.97 |
| 9 | China | 29.54 | 71.06 | 12.28 |
| 10 | Somalia | 29.12 | 11.94 | 71.00 |
| 11 | Honduras | 27.68 | 21.89 | 34.99 |
| 12 | Papua New Guinea | 27.64 | 21.20 | 36.04 |
| 13 | Pakistan | 27.03 | 13.91 | 52.53 |
| 14 | Bangladesh | 25.70 | 15.91 | 41.51 |
| 15 | Yemen | 25.18 | 9.36 | 67.75 |
| 16 | Vietnam | 24.83 | 26.12 | 23.60 |
| 17 | United States | 24.17 | 39.78 | 14.69 |
| 18 | Madagascar | 24.16 | 19.10 | 30.57 |
| 19 | Japan | 22.69 | 43.35 | 11.88 |
| 20 | Nicaragua | 22.63 | 22.79 | 22.48 |
| 21 | Guatemala | 22.41 | 15.42 | 32.58 |
| 22 | Peru | 21.31 | 14.89 | 30.50 |
| 23 | Thailand | 21.15 | 14.10 | 31.74 |
| 24 | Ecuador | 20.80 | 14.33 | 30.18 |
| 25 | Australia | 19.92 | 32.11 | 12.36 |
| 26 | Canada | 19.48 | 26.08 | 14.55 |
| 27 | Iran | 18.77 | 12.47 | 28.24 |
| 28 | Panama | 18.18 | 16.27 | 20.32 |
| 29 | Haiti | 17.81 | 5.61 | 56.51 |
| 30 | Egypt | 17.74 | 10.49 | 30.00 |
| 31 | Bolivarian Republic of Venezuela | 17.61 | 15.89 | 19.51 |
| 32 | El Salvador | 17.44 | 10.65 | 28.55 |
| 33 | Argentina | 15.67 | 11.29 | 21.76 |
| 34 | Libyan Arab Jamahiriya | 15.15 | 4.75 | 48.30 |
| 35 | South Africa | 15.08 | 6.98 | 32.57 |
| 36 | Solomon Islands | 15.03 | 9.94 | 22.72 |
| 37 | New Zealand | 14.74 | 18.10 | 12.00 |
| 38 | Turkey | 14.56 | 8.86 | 23.92 |
| 39 | Chile | 14.46 | 12.91 | 16.20 |
| 40 | Timor-Leste | 13.58 | 8.74 | 21.10 |
| 41 | Dominican Republic | 13.50 | 7.27 | 25.07 |
| 42 | Kenya | 13.28 | 3.12 | 56.55 |
| 43 | Malaysia | 12.90 | 8.86 | 18.77 |
| 44 | Brazil | 12.85 | 6.31 | 26.18 |
| 45 | Morocco | 12.59 | 7.45 | 21.26 |
| 46 | Tanzania | 12.53 | 5.39 | 29.11 |
| 47 | Costa Rica | 12.14 | 10.59 | 13.92 |
| 48 | Syria | 11.55 | 2.56 | 52.07 |
| 49 | Vanuatu | 11.54 | 5.77 | 23.08 |
| 50 | Mauritania | 11.06 | 2.77 | 44.17 |
| 51 | Italy | 10.98 | 8.86 | 13.60 |
| 52 | Angola | 10.85 | 2.31 | 50.99 |
| 53 | Democratic Republic of Congo | 10.76 | 1.69 | 68.53 |
| 54 | North Korea | 10.37 | 6.84 | 15.73 |
| 55 | South Korea | 10.20 | 9.83 | 10.58 |
| 56 | Greece | 10.10 | 8.14 | 12.53 |
| 57 | Cameroon | 10.08 | 1.66 | 61.22 |
| 58 | Spain | 9.74 | 7.54 | 12.57 |
| 59 | Iraq | 9.16 | 1.70 | 49.40 |
| 60 | Nigeria | 9.08 | 1.28 | 64.36 |
| 61 | Saudi Arabia | 9.02 | 4.32 | 18.82 |
| 62 | United Arab Emirates | 8.53 | 4.72 | 15.42 |
| 63 | Oman | 8.46 | 7.04 | 10.17 |
| 64 | Cambodia | 8.10 | 2.48 | 26.45 |
| 65 | Federated States of Micronesia | 8.07 | 3.54 | 18.40 |
| 66 | Algeria | 7.96 | 3.07 | 20.64 |
| 67 | Tunisia | 7.74 | 3.45 | 17.35 |
| 68 | Sri Lanka | 7.57 | 2.35 | 24.41 |
| 69 | Fiji | 7.51 | 2.83 | 19.95 |
| 70 | Sudan | 7.34 | 0.78 | 69.03 |
| 71 | Namibia | 7.15 | 1.87 | 27.33 |
| 72 | Guinea | 6.73 | 1.44 | 31.43 |
| 73 | Cuba | 6.61 | 3.45 | 12.66 |
| 74 | Gabon | 6.30 | 1.56 | 25.47 |
| 75 | Suriname | 6.26 | 1.82 | 21.53 |
| 76 | Eritrea | 6.20 | 1.78 | 21.60 |
| 77 | Djibouti | 6.14 | 1.35 | 27.95 |
| 78 | France | 5.92 | 2.63 | 13.33 |
| 79 | Belize | 5.90 | 1.40 | 24.89 |
| 80 | Senegal | 5.86 | 1.05 | 32.69 |
| 81 | Albania | 5.79 | 2.28 | 14.72 |
| 82 | Poland | 5.77 | 1.67 | 19.96 |
| 83 | Guyana | 5.71 | 2.20 | 14.83 |
| 84 | Tonga | 5.65 | 2.72 | 11.72 |
| 85 | Lebanon | 5.38 | 0.52 | 55.63 |
| 86 | Portugal | 5.36 | 3.12 | 9.22 |
| 87 | Uruguay | 5.10 | 1.57 | 16.55 |
| 88 | Samoa | 4.98 | 2.49 | 9.95 |
| 89 | United Kingdom | 4.95 | 2.60 | 9.41 |
| 90 | Sierra Leone | 4.91 | 1.06 | 22.75 |
| 91 | Ethiopia | 4.89 | 0.36 | 66.33 |
| 92 | Croatia | 4.84 | 1.55 | 15.13 |
| 93 | Comoros | 4.66 | 0.68 | 31.89 |
| 94 | Belgium | 4.61 | 1.79 | 11.89 |
| 95 | Trinidad and Tobago | 4.57 | 1.00 | 20.92 |
| 96 | Netherlands | 4.50 | 2.17 | 9.33 |
| 97 | Israel | 4.43 | 1.20 | 16.35 |
| 98 | Ukraine | 4.35 | 0.45 | 42.12 |
| 99 | Germany | 4.29 | 1.95 | 9.45 |
| 100 | Jamaica | 4.26 | 1.04 | 17.42 |
| 101 | Jordan | 4.21 | 0.78 | 22.67 |
| 102 | Afghanistan | 4.18 | 0.26 | 67.36 |
| 103 | South Sudan | 4.14 | 0.25 | 68.66 |
| 104 | Gambia | 4.09 | 0.59 | 28.38 |
| 105 | Liberia | 4.08 | 0.54 | 30.86 |
| 106 | Georgia | 4.06 | 0.70 | 23.59 |
| 107 | Bahamas | 4.04 | 1.18 | 13.83 |
| 108 | Marshall Islands | 3.89 | 0.77 | 19.61 |
| 109 | Barbados | 3.88 | 0.95 | 15.82 |
| 110 | Slovenia | 3.70 | 0.95 | 14.44 |
| 111 | Republic of Congo | 3.67 | 0.33 | 40.73 |
| 112 | Malawi | 3.60 | 0.34 | 38.05 |
| 113 | Guinea-Bissau | 3.59 | 0.59 | 21.90 |
| 114 | Uganda | 3.57 | 0.22 | 57.78 |
| 115 | Benin | 3.46 | 0.22 | 54.35 |
| 116 | Dominica | 3.43 | 1.12 | 10.52 |
| 117 | Central African Republic | 3.37 | 0.16 | 70.89 |
| 118 | Ireland | 3.32 | 1.48 | 7.43 |
| 119 | Antigua and Barbuda | 3.30 | 1.67 | 6.54 |
| 120 | Romania | 3.30 | 0.66 | 16.52 |
| 121 | Sweden | 3.30 | 1.07 | 10.16 |
| 122 | Ghana | 3.28 | 0.34 | 31.68 |
| 123 | Latvia | 3.19 | 0.69 | 14.76 |
| 124 | Plurinational State of Bolivia | 3.17 | 0.35 | 28.76 |
| 125 | Zambia | 3.17 | 0.27 | 37.28 |
| 126 | Cyprus | 3.15 | 0.68 | 14.60 |
| 127 | Burundi | 3.07 | 0.15 | 62.86 |
| 128 | Mauritius | 3.06 | 0.48 | 19.53 |
| 129 | Laos | 2.99 | 0.37 | 24.20 |
| 130 | Cote d'Ivoire | 2.98 | 0.31 | 28.66 |
| 131 | Kyrgyzstan | 2.96 | 0.23 | 38.09 |
| 132 | Chad | 2.88 | 0.12 | 69.34 |
| 133 | Grenada | 2.88 | 0.45 | 18.38 |
| 134 | Bosnia and Herzegovina | 2.87 | 0.34 | 24.29 |
| 135 | Tajikistan | 2.85 | 0.23 | 35.29 |
| 136 | Montenegro | 2.81 | 0.83 | 9.53 |
| 137 | Zimbabwe | 2.77 | 0.20 | 38.35 |
| 138 | Saint Lucia | 2.67 | 0.46 | 15.51 |
| 139 | Armenia | 2.66 | 0.23 | 30.73 |
| 140 | Norway | 2.66 | 1.10 | 6.43 |
| 141 | Togo | 2.65 | 0.13 | 54.06 |
| 142 | Saint Vincent and the Grenadines | 2.64 | 0.63 | 11.05 |
| 143 | Saint Kitts and Nevis | 2.49 | 0.74 | 8.40 |
| 144 | Lithuania | 2.48 | 0.63 | 9.76 |
| 145 | Rwanda | 2.48 | 0.15 | 40.85 |
| 146 | Nepal | 2.47 | 0.24 | 25.37 |
| 147 | Kiribati | 2.41 | 0.50 | 11.63 |
| 148 | Iceland | 2.37 | 0.71 | 7.88 |
| 149 | Azerbaijan | 2.36 | 0.22 | 25.35 |
| 150 | Bulgaria | 2.34 | 0.30 | 18.19 |
| 151 | Kuwait | 2.29 | 1.01 | 5.21 |
| 152 | Mali | 2.27 | 0.08 | 64.17 |
| 153 | Equatorial Guinea | 2.24 | 0.30 | 16.74 |
| 154 | Palau | 2.19 | 0.34 | 14.16 |
| 155 | Kazakhstan | 2.18 | 0.25 | 19.00 |
| 156 | Niger | 2.16 | 0.07 | 66.63 |
| 157 | Brunei | 2.07 | 0.99 | 4.31 |
| 158 | Burkina Faso | 2.06 | 0.07 | 60.58 |
| 159 | Estonia | 1.99 | 0.53 | 7.44 |
| 160 | Serbia | 1.92 | 0.17 | 21.65 |
| 161 | Eswatini | 1.90 | 0.14 | 25.80 |
| 162 | Paraguay | 1.89 | 0.14 | 25.44 |
| 163 | Seychelles | 1.89 | 0.51 | 6.97 |
| 164 | Mongolia | 1.68 | 0.15 | 18.78 |
| 165 | Nauru | 1.65 | 0.35 | 7.77 |
| 166 | Finland | 1.59 | 0.51 | 4.94 |
| 167 | Uzbekistan | 1.55 | 0.17 | 14.21 |
| 168 | Cape Verde | 1.52 | 0.12 | 19.20 |
| 169 | Maldives | 1.51 | 0.23 | 9.86 |
| 170 | Botswana | 1.47 | 0.09 | 23.87 |
| 171 | Tuvalu | 1.42 | 0.14 | 14.34 |
| 172 | Austria | 1.37 | 0.16 | 11.80 |
| 173 | North Macedonia | 1.37 | 0.10 | 18.65 |
| 174 | Turkmenistan | 1.29 | 0.17 | 9.72 |
| 175 | Czech Republic | 1.23 | 0.10 | 15.24 |
| 176 | Lesotho | 1.22 | 0.06 | 24.67 |
| 177 | Moldova | 1.19 | 0.09 | 15.74 |
| 178 | Switzerland | 1.15 | 0.16 | 8.29 |
| 179 | Bhutan | 1.14 | 0.10 | 12.91 |
| 180 | Denmark | 1.13 | 0.18 | 7.05 |
| 181 | Slovakia | 1.03 | 0.10 | 10.57 |
| 182 | Malta | 0.98 | 0.15 | 6.36 |
| 183 | Qatar | 0.94 | 0.17 | 5.20 |
| 184 | Bahrain | 0.87 | 0.12 | 6.30 |
| 185 | Sao Tome and Principe | 0.85 | 0.04 | 18.10 |
| 186 | Hungary | 0.82 | 0.11 | 6.15 |
| 187 | Belarus | 0.74 | 0.05 | 10.99 |
| 188 | Singapore | 0.72 | 0.17 | 3.01 |
| 189 | Liechtenstein | 0.67 | 0.09 | 4.97 |
| 190 | Luxembourg | 0.45 | 0.06 | 3.35 |
| 191 | Andorra | 0.33 | 0.02 | 5.58 |
| 192 | San Marino | 0.33 | 0.03 | 3.60 |
| 193 | Monaco | 0.21 | 0.02 | 2.28 |
Data and reporting for this article come from the following sources: